Great Hunting Opportunity In XPDUSDFriends, push the like button, write a comment, and share with your mates - that would be the best THANK YOU.
P.S. I personally will open entry if the price will show it according to my strategy.
Always make your analysis before a trade.
XPDUSD

palladium : test 2500 last week was very bullish for palladium despite bad cars sail numbers in usa and confinement , next week we can see small retrace before new pump to 2700

50-80% ROI since March Lows for these MetalsTake a look at this comparison chart and see the ROI for these few important Metals performance.
The best is COPPER and the worst is Platinum since the March Low.
I am investing for the long term and will wait for healthy correction to add more long positions. And I have reiterated the volatility of this PM and personally, I do not take a large positions in each of these PMs.
I am often asked how to diversify your portfolio ? The answer is pretty straight forward. It depends on the size of your capital. If you are starting out with a small capital of say 5 to 10,000, then I would say 50% in SPX500 and the rest in growth stocks.
If you have 100,000 to 500,000 then it becomes easier to allocate a certain % of your capital to other assets class like PMs. And even then, start with 1 or 2 before adding as this over-concentration can cause some traders/investors sleepless nights like the recent March crash. Imagine you have all 5 of these PMs, a 10% fall in 1 metal is amplified by 5 times if you purchased all though the reverse is true as well.
So, how much risks you can stomach has also to do with your capital base and your personality, imo.
Also, there are many complicated instruments out there being promoted by various brokers like DLCs, leveraged ETFs, options, etc. Personally, I do not have expertise in these instruments and would not comment if it is worthwhile.
Just managing my own portfolio across commodities, stocks, futures, ETFs, currencies IS MORE THAN ENOUGH for me to handle. Then again, to each his own. If you have the bandwidth and knowledge , it is OK to expand your investment reach into these new products. But always start small and gradually inch in as you gain more confidence.

XPDUSD, Aroon Indicator entered an Uptrend on Oct 19, 2020Over the last three days, Tickeron A.I.dvisor has detected that XPDUSD's AroonUp green line (see chart) is above 70, while the AroonDown red line is below 30. When the green line goes above 70 while the red line stays below 30, this is an indicator that the stock could be poised for a strong Uptrend. For traders, this could mean going long the stock or exploring call options in the next month. Tickeron A.I.dvisor backtested this indicator and found 106 similar cases, 95 of which were successful. Based on this data, the odds of success are 90%. Current price 2347.92 is above 2322.75 the highest resistance line found by Tickeron A.I. Throughout the month of 09/23/20 - 10/23/20, the price experienced a +7% Uptrend. During the week of 10/16/20 - 10/23/20, the FOREX enjoyed a +0.97% Uptrend growth.
Bullish Trend Analysis
The Momentum Indicator moved above the 0 level on October 23, 2020. You may want to consider a long position or call options on XPDUSD as a result. Tickeron A.I. detected that in 25 of 27 past instances where the momentum indicator moved above 0, the stock continued to climb. The odds of a continued upward trend are 90%.
The Moving Average Convergence Divergence (MACD) for XPDUSD just turned positive on October 21, 2020. Looking at past instances where XPDUSD's MACD turned positive, the stock continued to rise, Tickeron A.I. shows that in 18 of 19 cases over the following month. The odds of a continued upward trend are 90%.
Following a +2.74% 3-day Advance, the price is estimated to grow further. Considering data from situations where XPDUSD advanced for three days, in 90 of 96 cases, the price rose further within the following month. The odds of a continued upward trend are 90%.
The Aroon Indicator entered an Uptrend today. Tickeron A.I. detected that in 98 of 106 cases where XPDUSD Aroon's Indicator entered an Uptrend, the price rose further within the following month. The odds of a continued Uptrend are 90%.

#Palladium - 5-wave complete though impulse is very strongHi guys!
Palladium has touched the dynamic resistance and might retrace from here though the impulse is very strong, hence it might retrace just a bit and continue the uptrend backed by the weak US Dollar due to the Stimulus bill.


XPD USD SELL (PALLADIUM - US DOLLAR)Hi there. Price is forming a continuation pattern to the downside. Wait for the price to complete the pattern and watch strong price action for sell.

XPD gained +5.88% relative to the USD last weekCurrent price 2329.50 is above 2287.99 the highest resistance line found by Tickeron A.I. Throughout the month of 08/17/20 - 09/16/20, the price experienced a +10% Uptrend. During the week of 09/09/20 - 09/16/20, the FOREX enjoyed a +6% Uptrend growth.
Bullish Trend Analysis
The Momentum Indicator moved above the 0 level on August 31, 2020. You may want to consider a long position or call options on XPDUSD as a result. Tickeron A.I. shows that in 17 of 20 past instances where the momentum indicator moved above 0, the stock continued to climb. The odds of a continued upward trend are 85%.
Following a +4.96% 3-day Advance, the price is estimated to grow further. Considering data from situations where XPDUSD advanced for three days, in 80 of 86 cases, the price rose further within the following month. The odds of a continued upward trend are 90%.
The Aroon Indicator entered an Uptrend today. Tickeron A.I. shows that in 92 of 103 cases where XPDUSD Aroon's Indicator entered an Uptrend, the price rose further within the following month. The odds of a continued Uptrend are 89%.


Palladium : the big dream chart lol with @nmike clonePalladium : stupid chart but the big dream chart lol with @nmike clone

PALLADIUM 1D TRIANGLE ATB INDICATORADVANCED TRIANGLE BREAKOUT INDICATOR
1 Shows a green column for an upcoming long trade setup.
2 Shows a long trade entry signal.
3 Shows a stop loss signal.
4 Shows a take profit signal.


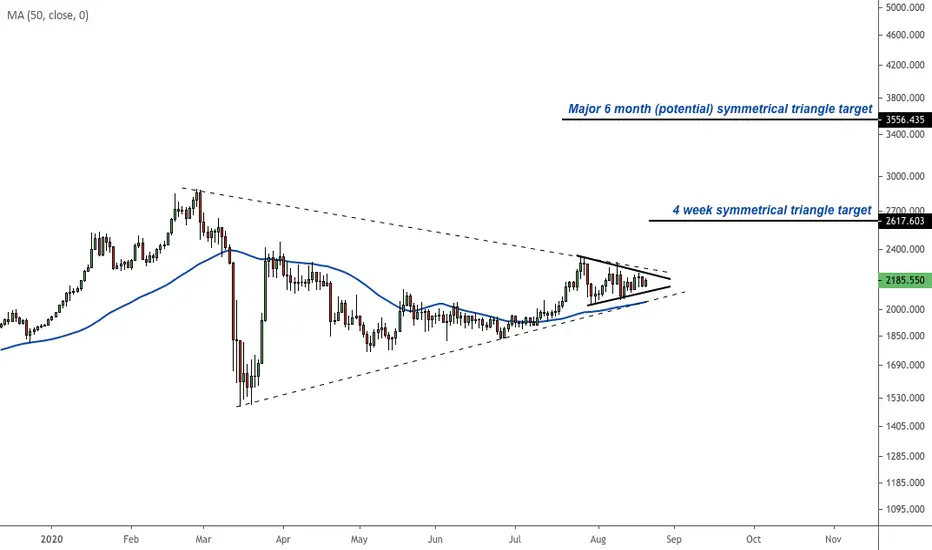
Palladium is setting up for a move higherBlue moving average is the 50 day.
Palladium miners will benefit from a continued rise in palladium prices.
The best ETF for palladium is PALL, but it's not very liquid and options on it are... not an option...
The palladium futures contract is about $220k at these prices, so it's probably the most volatile futures contract you could buy because of the size (palladium is a lot more volatile than any other futures contract with that notional value that I could think of).
I'll be on the hunt for palladium miners.
XPDUSD setting up for a run to the upsideXPDUSD setting up for a run to the upside. Watch price action, do not overleverage
Please comment with your chart and analysis or send your questions in my DM,
Comment, LIKE, and Follow

Palladium bullish scenarioAscending Triangle breakout is where I would take a long position with target of previous all time high.
NOT FINANCIAL ADVICE

Lovely little buy, But what's next...Caught a lovely little buy today from 2163, Looking to close around that resistance line of the possible wedge. I'll then be carefully watching to see whether it breaks out or acts a resistance and pulls back to bottom support. Either way, SL past entry..Time to just not let those emotions get in the way, Hold onto some winners and go for a walk. For now B1GFUDG3 OUT!
Disclaimer: I am not advising anyone to take any trades nor am i providing market direction certainty. Please do your own analysis and use the correct risk management. PS Dont bet the house.

XPD USD BUY (PALLADIUM - US DOLLAR)Hi there. Price is forming a possible continuation pattern to the upside. Wait for the price to complete the pattern and watch strong price action for buy.

Palladium looks like it could squeeze against silverI am long BOTH Silver and Palladium, but Palladium may outperform silver if it squeezes higher out of that consolidation.
Notice palladium recently broke out of a very tight triangle
The best way to buy palladium if not the futures contract is through the ETF, PALL

ridethepig | Palladium Market Commentary 2020.06.15Here the consolidation is condemned to break for the common good, as a diversionary sacrifice. Covid cases will act as the catalyst undoubtedly. The question is only and above all when?
For those tracking the breakout momentum is much more on the buyers side, clearly defined jurisdictions are on both sides of the map... As a quick cheatsheet: Strong Support (1635) <=> Soft Support (1750) <=> Soft Resistance (2300) <=> Strong Resistance (2800).

neutral on palladium palladium is ranging, no bull order power no sharp down spike , so no trade yet

Palladium's missile is ready for deployment to tag all-time highThis is a hot trading opportunity as price could retest the all time high.
+45% from the current level

PALLADIUM Falling Wedge IdeaPossible falling wedge on XPDUSD
Included a critical point which is adjacent to Fibonacci spiral
Buy on breakout of wedge at critical point or earlier.
