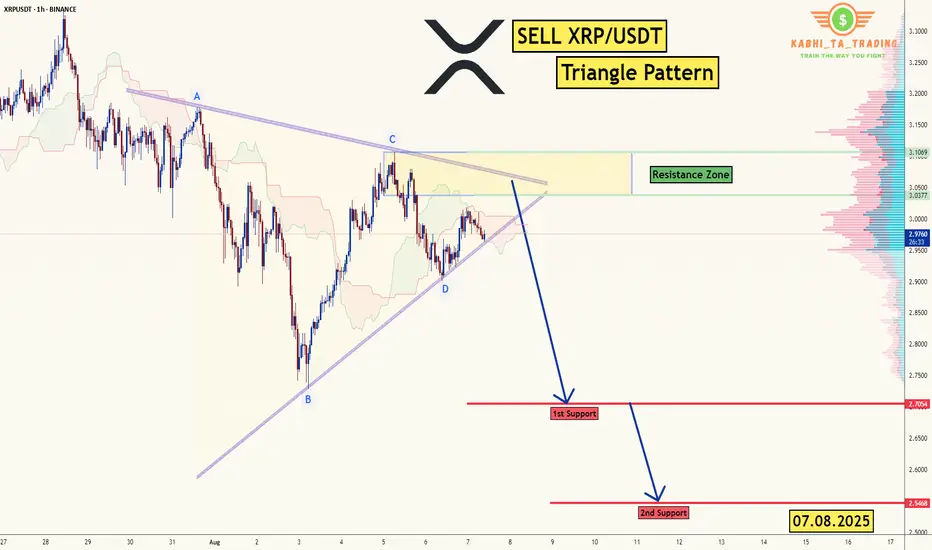
XRP/USDT -H1 - Triangle Breakout (07.08.2025)The XRP/USDT Pair on the H1 timeframe presents a Potential Selling Opportunity due to a recent Formation of a Triangle Breakout Pattern. This suggests a shift in momentum towards the downside in the coming Days.
Possible Short Trade:
Entry: Consider Entering A Short Position around Trendline Of The Pattern.
Target Levels:
1st Support – 2.7054
2nd Support – 2.5468
🎁 Please hit the like button and
🎁 Leave a comment to support for My Post !
Your likes and comments are incredibly motivating and will encourage me to share more analysis with you.
Best Regards, KABHI_TA_TRADING
Thank you.
XRP-USDT
Ripple is Nearing Important SupportHey Traders, in today's trading session we are monitoring XRPUSDT for a buying opportunity around 2.35 zone, XRP is trading in an uptrend and currently is in a correction phase in which it is approaching the trend at 2.35 support and resistance area.
Trade safe, Joe.

XRP fractal, sometimes simple is bestI'm loving XRP at the moment. We've seen a gorgeous positive breakout the last few days giving high confidence in a furthe upward surge. I'm looking closely and can see a beautful fractal appearing that looks like it could play out again. IF it does, my target will be just shy of the top around 1.9. I'm in until then. Follow for more.

Ripple can continue to decline to 0.5065 support levelHello traders, I want share with you my opinion about Ripple. Observing the chart, we can see that the price some time ago started to decline inside the downward channel, where it soon broke the resistance level, which coincided with the seller zone and fell to the support line of the channel. After this movement, Ripple continued to decline in the channel and reached a support level, which coincided with the buyer zone, and even soon broke it too and declined more. But later, XRP turned around and made a strong impulse up from the support line, thereby breaking the 0.5065 support level again and exiting from the downward channel also. Then price continued to grow and even later reached a resistance level, but not a long time ago rebounded and declined to the support line. Also recently, XRP broke this line and now it continues to decline, so, in my opinion, Ripple can make a little movement up and then continue to fall to the 0.5065 support level, which is my target also. Please share this idea with your friends and click Boost 🚀

XRPUSDT.1DThe daily chart for Ripple (XRP/USDT) shows the price fluctuating within a defined range, currently sitting at $0.5298. The chart outlines key resistance levels at $0.5746 (R1) and $0.6686 (R2), which are critical points where the price has previously encountered selling pressure.
The support level (S1) is established at $0.4697. Observing XRP's recent behavior near this level could provide insights into potential future movements. If XRP can maintain above S1, it might retest R1, suggesting a consolidation within this range.
The RSI is almost at the neutral point of 47.24, which does not indicate a strong momentum in either direction, suggesting the market is in a state of balance between buyers and sellers. The MACD is very close to the signal line and slightly below zero, indicating a lack of strong bullish or bearish momentum.
For traders:
Watching the reaction at S1 is crucial; holding above it might suggest stability or a potential upward move toward R1.
Breaking below S1 could signal a further decline, potentially reaching lower historical levels not marked on this chart.
A breakout above R1 could lead to a test of R2, providing a bullish scenario to target higher levels.
Traders should consider these levels for potential stop-loss or take-profit points, and observe volume and other indicators for confirmation of any potential moves.

Ripple can exit from triangle, make retest and continue to riseHello traders, I want share with you my opinion about Ripple. By observing the chart, we can see that the price some time ago reached a resistance level, which coincided with the seller zone and broke it, after which started to trades in the range. Inside the range, the price rose to the top part and then turned around and declined lower than the 0.6085 level, thereby exiting from the range. After this, Ripple turned around and rose higher than the resistance level and started to trades in a triangle, where it rebounded from the resistance line and made a strong impulse down to the support line, breaking 0.6085 and 0.5065 levels. Then price turned around and made an upward impulse from the support line of the triangle to the support level, which coincided with the buyer zone and later finally broke the 0.5065 level, after which reached the resistance line of the triangle. But recently it rolled down from this line to the support line, where at the moment continues to trades near. For this reason, I think that Ripple can reach the resistance line, and break it, thereby exiting from the triangle and making a retest. After this, XRP will continue to move up, therefore I set my 1-st TP at the 0.5745 level. Please share this idea with your friends and click Boost 🚀

XRPUSDT.1DOn the daily chart for Ripple (XRP/USDT), XRP is exhibiting a range-bound behavior, oscillating between defined levels of support and resistance. The price is currently near $0.5203, with a noticeable support level (S1) at $0.4697. Above, there is resistance at $0.5746 (R1), and a further resistance (R2) at $0.6686.
The RSI is in the lower half of the range at 42.28, which can suggest bearish momentum but not yet oversold, providing potential room for downward movement. The MACD is slightly below the signal line, reinforcing the bearish sentiment as it suggests the possibility of further decline.
For traders, the area around S1 could be seen as a potential entry point for a long position if they believe the support will hold, with a stop loss set below S1 to mitigate risk. A break below S1, however, could signal a stronger bearish trend and a potential short opportunity. Conversely, a move above R1 could indicate a shift to a bullish outlook, potentially targeting R2. Trading decisions should be accompanied by other technical indicators and volume analysis for better confirmation.

Ripple can break support level and decline to 0.4480 pointsHello traders, I want share with you my opinion about Ripple. Observing the chart, we can see that the price some time ago, and started to trades in the range, where it at once rose to the top part of this pattern and some time traded near. After this, the price turned around from the top part of the range, and in a short time declined to the seller zone, which coincided with the 0.5680 resistance level, after which XRP bounced and tried to rise in the range. But, after it a little rose, the price turned around and made a strong impulse down to the support line, thereby exiting from the range and breaking resistance with support levels also. After this, XRP in a short time rebounded from the support line and rose higher support level, breaking it one more time. After this, Ripple made a little correction to the support line, but now XRP continues to trades near the 0.4835 support level. In my opinion, Ripple can make a little movement up and then rebound down to 0.4480, thereby breaking the support line and level. Please share this idea with your friends and click Boost 🚀

XRPUSDT.4HAnalyzing the XRP/USDT chart from a 4-hour timeframe, the market is currently in a consolidation phase, trading within a defined range marked by the support level S1 and resistance level R1. The horizontal channel pattern indicates indecision between buyers and sellers.
The RSI is just shy of the 60 mark, suggesting a slight bullish bias but not significant enough to confirm a strong upward trend. The market could be approaching a potential shift in momentum as the RSI is neither overbought nor oversold.
The MACD shows a narrowing gap with the signal line, implying a weakening of the current trend. The histogram reflects this indecision with minimal height bars, indicating the market could be poised for a breakout or breakdown.
If the price action can sustain above the S1 level, it might indicate an appetite for a retest of the resistance at R1. A breakout above R1 could signal the start of a new uptrend. Conversely, a fall below S1 may indicate a bearish move towards the lower end of the range or beyond.
In conclusion, as a trader, I would wait for a clear signal beyond this consolidation range before making any significant trading decisions. The current market condition calls for a cautious approach, with an eye on both the R1 and S1 levels for potential breakout or breakdown.

Ripple can continue to move up inside rangeHello traders, I want share with you my opinion about Ripple. Looking at the chart, we can see how the price some time ago rebounded from the resistance line and made a strong impulse down to 0.6035 support level, which coincided with the buyer zone, thereby breaking the 0.6585 resistance level. After this, the price at once rebounded from this level and rose to the resistance line and even higher this line, but soon fell back, making a fake breakout. Also later, XRP declined below the support level and some time traded there. After this, the price turned around and made a strong impulse up, breaking the support level one more time and soon the resistance line, after which Ripple started to trades in a range. In this pattern, the price first rose slightly, then fell to the support level, after which rebounded and rose to 0.6585. But recently, Ripple turned around and in a short time declined to the 0.6035 level, after which it rebounded and started to move up. So, now I think that XRP can continue to move up inside the range. For this case, I set my target at the 0.6410 level. Please share this idea with your friends and click Boost 🚀

Ripple can correct to support area and then start to riseHello traders, I want share with you my opinion about Ripple. Observing the chart, we can see that the price a not long time ago started to rise in an upward channel, where it first made a fake breakout of 0.5825 level, which coincided with the buyer zone and then rebounded up to the resistance line of the channel. Then XRP rebounded from this line and made the correction, but soon it turned around and rose to the current support level, which coincided with the support area, after which the price turned around and made a strong downward impulse to 0.5385 points, thereby exiting from the upward channel. Also, price started to trades in a triangle, where it rebounded from support line and made impulse up higher than the 0.5825 level, after which XRP made correction to this level. Then price repeated the upward impulse, and at this moment it exited from the triangle and reached the current support level and soon broke it. After this, the price continued to move up, but recently it turned around and started to decline to support area, after which it bounced up, so now I think that Ripple can decline to support area again and then rebound up. Therefore I set my target at the 0.7360 level. Please share this idea with your friends and click Boost 🚀

XRPUSDT.1DBased on the provided market data, XRP is currently trading at $0.719 against USDT. The Relative Strength Index (RSI) for 4 hours, 1 day, and 7 days are 79.58, 79.16, and 66.86 respectively. These high RSI values suggest that XRP is currently in an overbought condition, which could be a signal of a potential price decrease in the short term.
The Moving Average Convergence Divergence (MACD) for 4 hours, 1 day, and 7 days are 0.0124, 0.012, and 0.019 respectively. The positive MACD indicates a bullish signal for XRP, suggesting that the buyers are in control.
The Bollinger Bands (BB) for 4 hours, 1 day, and 7 days are 0.71, 0.73, and 0.73 respectively, and the current price is slightly below the upper band. This could mean that the price is in a high range and could potentially revert.
In terms of support and resistance levels, the immediate support levels stand at $0.62, $0.57, and $0.54 for the 4-hour timeframe. For the 1-day timeframe, support is at $0.62, $0.53, and $0.49, and for the 7-day timeframe, it is at $0.58, $0.48, and $0.30. The resistance levels are $0.74, $0.83, and $0.94 for 4 hours; $0.75, $0.83, and $0.86 for 1 day; and $0.93, $1.060, and $1.43 for 7 days.
Based on these technical indicators, it seems that XRP is currently in a bullish trend but is overbought. Therefore, there might be a potential for a short-term price correction. However, the positive MACD suggests that the overall trend might continue to be bullish. Please note that this analysis is based on the current market data and does not consider other factors that could impact the price. It's always recommended to do your own research and consider multiple factors before making any investment decisions.

XRPUSDT.1DBased on the provided market data, the XRP cryptocurrency is currently trading at $0.64. The Relative Strength Index (RSI) over 4 hours, 1 day, and 7 days are 69.38, 72.92, and 59.71 respectively. An RSI over 70 usually indicates that an asset may be overbought, and thus due for a price correction. However, the 7-day RSI is still below 70, suggesting that the asset is not in the overbought territory on a weekly basis.
The Moving Average Convergence Divergence (MACD) for 4 hours, 1 day, and 7 days are 0.15, 0.022, and 0.0078 respectively. A positive MACD suggests that the asset is in a bullish phase and may continue to rise.
The Bollinger Bands (Bb) for 4 hours, 1 day, and 7 days are 0.66, 0.6545, and 0.6931 respectively. The current price is below the upper band in all three periods, suggesting that the asset is not overbought.
The support levels for 4 hours, 1 day, and 7 days are $0.6294/$0.5925/$0.5808, $0.5753/$0.5442/$0.5050, and $0.5916/$0.4852/$0.4827 respectively. If the price of XRP falls, these levels could serve as the points where the price may start to rise again.
The resistance levels for 4 hours, 1 day, and 7 days are $0.66/$0.6880/$0.7160, $0.6623/$0.7248/$0.7548, and $0.6956/$0.7550/$0.8150 respectively. If XRP continues to rise, these levels could serve as the points where the price may start to fall.
In conclusion, the XRP seems to show a bullish trend based on its positive MACD and RSI values that are not in the overbought territory. However, it's important to monitor the RSI closely as it's approaching the overbought level in the 4-hour and 1-day periods. As always, it's crucial to consider other market factors and your risk tolerance before making investment decisions.

Ripple can continue to move up in upward channelHello traders, I want share with you my opinion about Ripple. Looking at the chart, we can see how the price some days ago started to trades in the range, where it tried at once to rise, but failed and declined to the bottom part, which coincided with the buyer zone and 0.5300 level. After this, XRP some time traded in this zone, and last time it rebounded up to the top part of the range, which coincided with the 0.5940 support level with the area. But the price at once bounced and made impulse down to 0.5300 level, after which it started to rise in an upward channel, exited from range. In the channel, the price rose to the support area, breaking the 0.5940 level, but soon made a correction below this level. Later, XRP broke the 0.5940 level again and rose to the resistance line of the channel, after which it rebounded down to the current support level. But a not long time ago price bounced from this level and continued to rise in an upward channel. So, now I think Ripple can make a small correction movement and then continue to grow to the resistance line of the channel. For this case, I set my target at the 0.6930 level, which coincided with line. Please share this idea with your friends and click Boost 🚀

Ripple can bounce up from support line of pennant to seller zoneHello traders, I want share with you my opinion about Ripple. Observing the chart, we can see that the price recently started to trades in the range, where soon price declined to the 0.5070 support level, which coincided with the buyer zone and then continued to rise. But when it reached the top part of the range, XRP turned around and declined lower than the 0.5070 level, thereby exiting from the range. After this, the price started to rise in an upward pennant, where it at once rebounded from the support line and rose to 0.5070 level and in a short time broke it one more time. Then XRP some time traded near this level and later made a strong upward impulse to the resistance line of the pennant, breaking the 0.5570 resistance level, but soon price turned around and declined back. Also, price tried to back up to the resistance line, but failed and declined to support line of the pennant. But recently it rebounded from this line and started to rise. So, now I think that Ripple can correct to support line of pennant again and then rebound up to the seller zone, breaking the resistance level. For this case, I set my target at 0.5635 points inside the seller zone. Please share this idea with your friends and click Boost 🚀

Ripple can decline to 0.5315 points, breaking support levelHello traders, I want share with you my opinion about Ripple. By observing the chart, we can see that the price some time ago broke the 0.5180 support level, which coincided with the buyer zone and declined below. Then the price turned around and started to rise in an upward channel, where XRP soon broke the 0.5180 level broke it again and rose to the resistance line of the channel. After this, the price bounced down from this line and declined to the buyer zone, where it exited from the channel and entered to upward pennant, in which Ripple turned around and then it rebounded from the support line and made a strong upward impulse to resistance line, thereby breaking 0.5500 level, which coincided with resistance area. But a not long time ago price rebounded from this line and declined to 0.5500 current support level, and at the moment price trades very close to this level in the resistance area. So, in my mind, Ripple can exit from the pennant, break the support level, and continue to decline. For this reason, I set my target at the 0.5315 level. Please share this idea with your friends and click Boost 🚀

XRPUSDT.1DBased on the market data provided, the XRP cryptocurrency is currently trading at $0.560 against Tether (USDT). The Relative Strength Index (RSI) for 4 hours, 1 day, and 7 days are 79.83, 67.19, and 51.20 respectively. The higher values of RSI (especially the 4-hour RSI) suggest that the cryptocurrency is currently being overbought, which might indicate a potential downward correction in the near future.
The Moving Average Convergence Divergence (MACD) for 4 hours, 1 day, and 7 days are 0.011, 0.0080, and -0.0014 respectively. The positive MACD values in the shorter time frames (4 hours and 1 day) suggest a bullish trend, but the negative MACD value in the 7-day time frame may hint at a longer-term bearish trend.
The Bollinger Bands (BB) for 4 hours, 1 day, and 7 days are 0.57, 0.57, and 0.68 respectively. The BB values suggest that the cryptocurrency is currently trading near the upper band, which might indicate a potential price drop.
The support levels for 4 hours, 1 day, and 7 days are $0.54, $0.52, and $0.57 respectively, while the resistance levels are $0.59, $0.62, and $0.62. The proximity of the current price to the support levels suggests that a downward price movement might encounter some resistance, which could potentially slow down or halt the price drop.
Based on the technical analysis, it seems that XRP might be heading for a short-term price correction due to its overbought condition. However, the positive MACD values in the shorter time frames suggest that the bullish trend might continue if the cryptocurrency can maintain its momentum. Please note that this is just a technical analysis and does not take into account other factors like market news or sentiment, which can also have a significant impact on the price.

Ripple can break resistance level, make retest and continue growHello traders, I want share with you my opinion about Ripple. Observing the chart, we can see that the price a not long time ago started to trades in an upward channel, where it first declined to the support line and then continued to move up in the channel. XRP reached a resistance level, which coincided with the seller zone and soon broke it, after which the price made little correction and later rose to the resistance line of the upward channel. Next, the price turned around and made a strong downward impulse to support line of the triangle, thereby exiting from the channel and breaking two levels - 0.5265 and 0.5010. But soon, Ripple turned around again and in a short time rose back to the resistance line, breaking the 0.5010 support level, which coincided with the buyer zone. Then it made a correction to this level and some time traded near, after which the price rebounded and made impulse up to the resistance level, thereby exiting from the triangle. Now Ripple trades near the 0.5265 level and I think that price can correct a little and then rise to the resistance level, and try to break it. After breaks, Ripple will make retest and continue to move up. For this case, I set two targets, the first target at the 0.5265 resistance level, and the second - at the 0.5365 level. Please share this idea with your friends and click Boost 🚀

XRPUSDT.1DBased on the provided market data, XRP is currently priced at $0.50, trading between the support level at $0.48 and the resistance level at $0.54 on a 4-hour chart. The Relative Strength Index (RSI) for 4 hours is 48.53, which suggests that the market is neither overbought nor oversold. The Moving Average Convergence Divergence (MACD) for 4 hours is -0.0018, indicating a bearish signal.
On the daily chart, XRP has a support level at $0.48 and a resistance level at $0.55. The RSI is 38.13, indicating that the asset is somewhat oversold, and could potentially be a buying opportunity. The MACD is -0.018, which is a bearish sign.
On the weekly chart, XRP has a support level at $0.46 and a resistance level at $0.60. The RSI is 42.20, indicating that the asset is neither overbought nor oversold. The MACD is 0.0011, suggesting a bullish signal.
In my opinion, XRP is currently in a slightly bearish trend in the short term but could potentially be a buying opportunity based on the daily RSI. However, the bearish MACD on the daily chart suggests that the downward trend may continue, so caution should be exercised. The weekly chart suggests a possible upward trend, but the asset is currently trading below the weekly Bollinger Band (BB) of $0.68, which is a bearish sign. Therefore, investors should watch the market closely for any changes in these indicators.

XRPUSDT.1DBased on the provided market data, the XRP cryptocurrency is currently trading at $0.63 against USDT. The Relative Strength Index (RSI) for 4 hours, 1 day and 7 days is 67.81, 54.85, and 53.09 respectively. This suggests that XRP is approaching overbought territory on the 4-hour chart (RSI above 70 indicates overbought conditions), while the daily and weekly RSI readings are in the neutral zone.
The Moving Average Convergence Divergence (MACD) for 4 hours, 1 day, and 7 days are 0.0037, 0.0001, and 0.0306 respectively. This indicates a bullish trend in the short term (4 hours) and a more neutral trend in the longer term (1 day and 7 days).
The Bollinger Bands (BB) for 4 hours, 1 day, and 7 days are 0.6433, 0.66, and 0.69 respectively. The current price of 0.63 is below the middle band in all cases, suggesting that XRP is not overbought.
The main resistance levels are $0.6681, $0.6720, and $0.6919 for the 4-hour chart, and $0.67, $0.71, and $0.73 for the daily chart. For the weekly chart, the resistance levels are at $0.73, $0.90, and $1.36. On the other hand, the support levels are at $0.6176, $0.5998, and $0.5775 for the 4-hour chart, and $0.60, $0.56, and $0.54 for the daily chart. For the weekly chart, the supports are at $0.56, $0.46, and $0.44.
In conclusion, the technical indicators suggest a short-term bullish trend for XRP, but the cryptocurrency is approaching overbought conditions on the 4-hour chart. Therefore, traders should be cautious about a possible price correction. In the longer term, the trend is more neutral, and the price could move in either direction, depending on market conditions and sentiment.


XRPUSDTThis is a 1D frame analysis for XRPUSDT As we can see, the price can form a rising pattern, but only if it can break through the first resistance line and we have seen signs of a market reversal, we can anticipate a market reversal and if the price holds below the first support line, it can move towards the second support line. However, if it can break through the first resistance line, we can consider a market reversal and an upward trend.

🔥 XRP Ultimate Game Plan For The Next Bull-RunIf you enjoy this analysis, please give it a like and a follow.
With XRP's lawsuit behind us, a lot of the bearish sentiment has been cleared. Still, it appears that this event had little staying power with the bulls, since XRP has given up around half the gains it made shortly after the SEC news.
Nevertheless, I'm long-term bullish on XRP. As seen on the chart, XRP is seemingly trading in a parallel channel. The top two resistance lines are direct copies of the bottom support line.
I'm going to wait for XRP to drop towards the bottom support, and ideally bounce from it. My target for the next bull-run is placed at 7$, stop just below the channel's support. This will give us a massive risk-reward of almost 110, which is a serious money maker if it plays out well.
Keep in mind we can hit the bottom support further away in time, which moves the entry up.
