FireHoseReel | XRP Breaks Key Support, Eyes $1.99 Next🔥 Welcome To FireHoseReel !
Let’s jump into Ripple (XRP) market analysis.
👀 XRP 4H Overview
Compared to most coins in the market, XRP has experienced a sharper sell-off. Based on chart data, it has now broken its dynamic support and is currently moving toward the next dynamic support around $1.9928.
📊 Volume Analysis
XRP volume has declined due to the holiday period, so we rely more on past reactions. Previously, price attempted to defend this zone and bounce higher. This time, however, the level has been broken with a strong sell-off candle.
✍️ XRP Trading Scenarios
🟢 Long Scenario:
A breakout above the local high at $2.2454, supported by strong buying volume, could trigger a sharp upside move.
🔴 Short Scenario:
At the moment, a stop can be defined above the previous 4H candle. For a safer entry, wait for a reaction at $1.9928—if this support breaks with selling pressure, a short setup becomes valid.
🧠 Protect your capital first. No setup is worth blowing your account. If risk isn’t controlled, profit means nothing. Trade with rules, not emotions.
XRPBTC

#XRP/USDT XRP (1h) (spot)#XRP
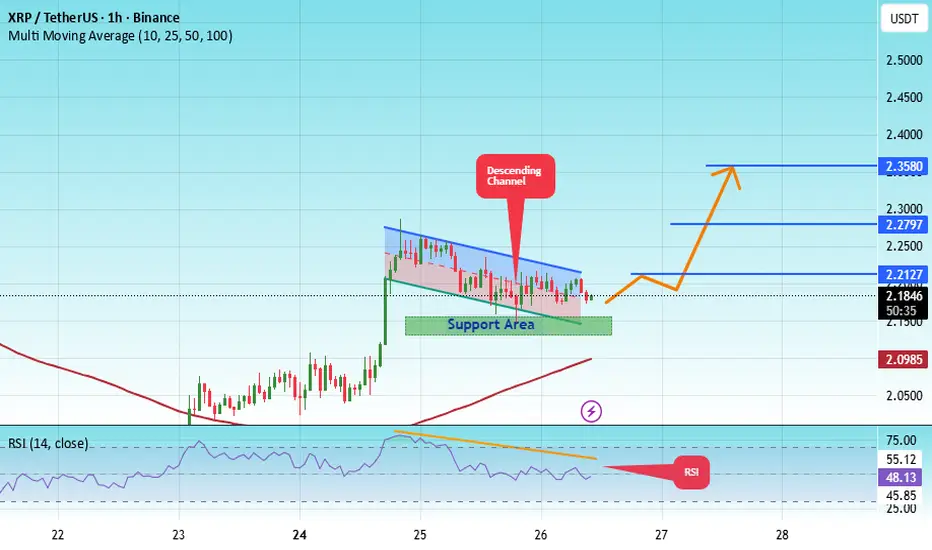
The price is moving within an ascending channel on the 1-hour timeframe and is holding well. It is poised to break out strongly and retest the channel.
We have a downtrend line on the RSI indicator that is about to break and retest, which supports the upward move.
There is a key support zone in green at the price of 2.14, representing a strong support point.
We have a trend to stabilize above the 100-period moving average.
Entry price: 2.18
First target: 2.21
Second target: 2.28
Third target: 2.35
Don't forget a simple money management rule:
Place your stop-loss order below the green support zone.
Once you reach the first target, save some money and then change your stop-loss order to an entry order.
For any questions, please leave a comment.
Thank you.
XRP RoadMap (1D)Let's take a look at Ripple to see what fluctuations it may experience over the next month or two.
We considered the upward move in 2024 as Wave A, the following correction as Wave B, and the third rise as a terminal 5-wave structure.
The sharp downward move is considered a post-pattern terminal, and now the waves we are in are regarded as a bearish cycle, forming an expanding/diametric/symmetrical triangle.
Whatever the larger pattern is, in aggregation it seems that the price will move downward from the red zone to the short-term targets marked on the chart.
The targets are marked on the chart.
A daily candle closing above the invalidation level will invalidate this analysis
For risk management, please don't forget stop loss and capital management
When we reach the first target, save some profit and then change the stop to entry
Comment if you have any questions
Thank You

XRPUSDT UPDATE#XRP
UPDATE
XRP Technical Setup
Pattern: Falling Wedge Pattern
Current Price: $2.49
Target Price: $3.80
Target % Gain: 52.61%
Technical Analysis: XRP is forming a falling wedge pattern on the 1D chart, suggesting bullish momentum is building. The price is approaching the upper resistance trendline and is expected to break out soon. A successful breakout, supported by volume expansion, could push XRP toward the $3.80 zone, aligning with previous structural highs.
Time Frame: 1D
Risk Management Tip: Always use proper risk management.
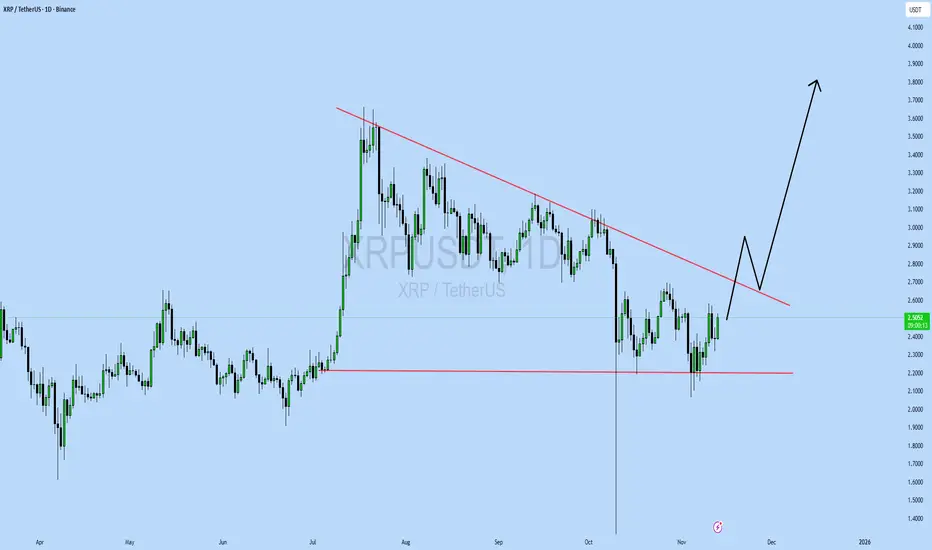
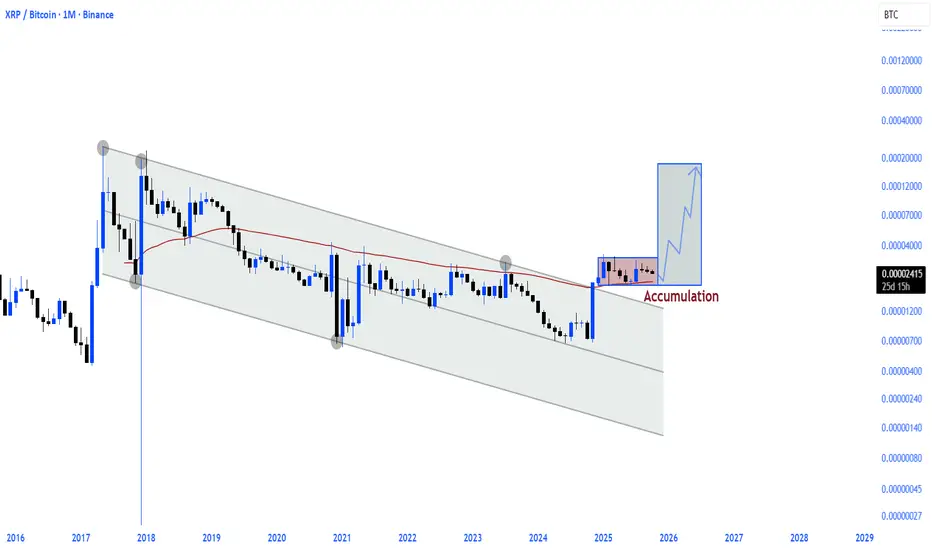
$XRP / $BTC bullish enough Ripple broke above the falling channel structure, which has existed since 2017, and also broke above the 50 EMA in November 2024. Following this breakout, the price entered a prolonged period of re-accumulation.
The recent market crash served as a technical retest of this structure.
While short-term volatility may appear misleading, over the long term, CRYPTOCAP:XRP still maintains a clearly bullish structure.

#XRP/USDT long idea/classic pattern#XRP
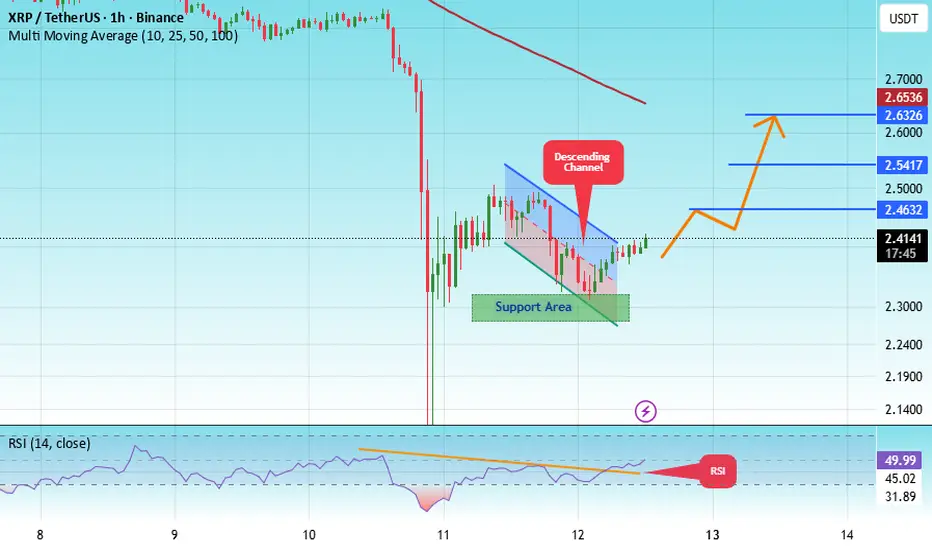
The price is moving within a descending channel on the 1-hour frame, adhering well to it, and is heading for a strong breakout and retest.
We have a bearish trend on the RSI indicator that is about to be broken and retested, which supports the upward breakout.
There is a major support area in green at 2.30, representing a strong support point.
We are heading for consolidation above the 100 moving average.
Entry price: 2.41
First target: 2.46
Second target: 2.54
Third target: 2.63
Don't forget a simple matter: capital management.
When you reach the first target, save some money and then change your stop-loss order to an entry order.
For inquiries, please leave a comment.
Thank you.
XRP 1D Analysis - Key Triggers Ahead☃️ Welcome to the cryptos winter , I hope you’ve started your day well.
⏰ We’re analyzing XRP on the 1-Day timeframe .
👀 On the daily timeframe of Ripple (XRP), we can see that — for this analysis — I decided to share my perspective from left to right across the chart.
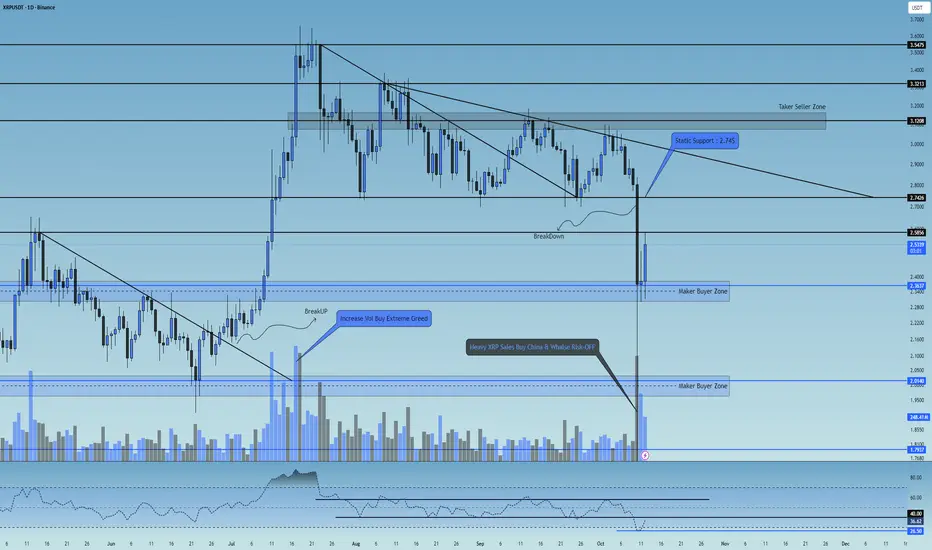
From mid-May to late June, Ripple was trading below a descending dynamic resistance trendline, which it successfully broke to the upside, rallying from $2 to $3.5. In that area, heavy profit-taking occurred, pushing the price downward. The first major support after that sharp rally was at $2.74.
Later, Ripple formed a lower high at $3.23 and a double bottom (equal low) around $2.74, which created a strong static support and positioned the price within the final third of its triangle pattern. It then broke its dynamic trendline resistance again and managed to make a higher high, but this time it failed to show the same sharp bullish momentum. It was quickly rejected from $3.1, which was a taker-seller zone, and pulled back toward its static support.
Buyers didn’t allow the key floor to break — they defended the level aggressively, pouring in additional liquidity to keep XRP above support. However, since no major new capital inflow entered the market and Ripple remained compressed within multiple overlapping triangle formations, a new dynamic resistance was formed. Even with intense effort from buyers, that resistance couldn’t be broken, and eventually, Ripple lost its key static support at $2.74 and dropped further.
Although this move was technically predictable, the speed and depth of the fall were hard to manage in real time. Now, Ripple is sitting above a strong buyer-maker support zone, and much of the selling volume is being absorbed by buybacks. Retail traders are also accumulating again.
The interesting point: Ripple has a critical resistance at $2.58 — if it breaks and holds above this level, it can reignite a bullish move upward. The main resistance zone remains the same old static support area that buyers previously tried hard to protect. Once the $2.74 level is broken back to the upside, Ripple could experience a strong pump.
🧮 On the daily RSI oscillator, Ripple had a very strong static resistance zone around 62, and on its last touch it got heavily rejected, dropping below 50 and 30 without much resistance. Currently, RSI has a support around 26.5 and a key resistance around 40 — these are the main RSI pivot levels. If Ripple’s RSI breaks out of this range, it can trigger higher volatility and momentum aligned with the market direction.
🕯 The recent candle structures — especially the large bearish candle with a long lower wick — caused panic and FOMO among Ripple holders. This led many institutions and big wallets to switch into risk-off mode, dumping their XRP positions and causing a 50% crash within hours.
However, Ripple has recovered well, and the last two bullish candles came with solid buying volume, likely supported by the RSI exiting its oversold zone. With continued buying volume and a break above the key taker-seller resistance at $2.58, Ripple could resume its upward movement.
🧠 If we held Ripple — what would we do?
Personally, if I owned XRP right now, I’d strictly follow capital and risk management, avoiding emotional decisions driven by fear or greed. Ripple is currently forming a new trading range with tight highs and lows, meaning that breaking either boundary will likely start the next major leg of movement.
The upcoming week, especially with the meeting between Trump and the Chinese President, could significantly impact risk markets.
So for now, I’d do nothing major — and if I decided to open a position, I’d do it with minimal risk (and yes, I call that “a bad habit” on purpose 🙂).
This scenario will be updated with more precision and detail in future analyses.
❤️ Disclaimer : This analysis is purely based on my personal opinion and I only trade if the stated triggers are activated .
$XRP / $BTCThe 7.5-year descending channel broke in November 2024
The resistance level (50EMA), which served as a significant barrier, was broken in November 2024 after 5.5 years, and accumulation is currently occurring above this level.
The Ripple rally is definitely going to be very hot.
XRP Ready for a Bullish Rally?XRP is breaking out of a descending wedge structure on the daily chart after weeks of consolidation. Price is reclaiming moving averages (50 EMA & 100 EMA), showing renewed bullish momentum.
✏️ Entry Zone: ~$3.05
✏️ Target (TP): $5.00 (major resistance from previous high)
✏️ Stop-Loss (SL): ~$2.70(below support / invalidation level)
✏️ Risk/Reward Ratio: 1:6
Key Points
- Daily structure shows a series of higher lows holding strong.
- Breakout accompanied by volume confirmation suggests buyers stepping in.
- If price sustains above the breakout trendline, momentum could extend toward $5+.
- Losing $2.70 support would invalidate the bullish setup.
Cheers
Hexa

The big move UP is comingHave published this one in the mind section fews times.
Now you can keep track ot it.
The fractal is working quite well. Combined with the parallel channel you get a better picture of the key levels. Also my custom EMA indicator is confirming the downside shorterms with a good opportunity to buy around 2.5 level.
Good luck all.

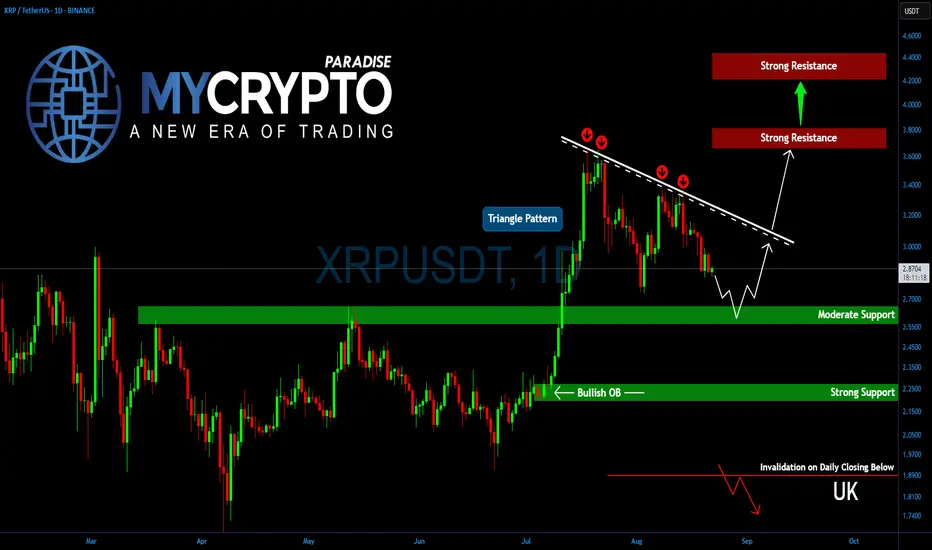
Triangle or Trap? XRP’s Next Move Could Shock TradersYello, Paradisers! Is #XRP quietly preparing for its second explosive leg? The chart is tightening fast, and the next move will decide everything.
💎XRP has been one of the strongest altcoins in this rally, holding momentum after July’s major leg up. Price action is now consolidating inside a triangle formation, which often signals continuation before the next move. This consolidation is also beginning to resemble a potential bull flag, a strong bullish setup.
💎For #XRPUSDT, the key to confirmation lies at $3.15. A breakout above the descending resistance with strong volume would trigger the second bullish leg, sending XRP toward $3.70–$3.85. If momentum carries through, the move could even extend to $4.20–$4.40, which aligns with the 161.8% Fibonacci extension.
💎On the downside, solid support sits between $2.65–$2.55. The longer price holds above this range, the stronger the base bulls will have to push higher. In the case of aggressive profit-taking, XRP could retest $2.25–$2.20, a strong support zone that is expected to withstand any deeper breakdown attempts.
Paradisers, strive for consistency, not quick profits. Treat the market as a businessman, not as a gambler.
MyCryptoParadise
iFeel the success🌴
#XRP How Long To Reach 3.31 ?#XRP
The price is moving within a descending channel on the 1-hour frame, adhering well to it, and is heading for a strong breakout and retest.
We have a bearish trend on the RSI indicator that is about to be broken and retested, supporting the upside.
There is a major support area (in green) at 2.80, which represents a strong basis for the upside.
For inquiries, please leave a comment.
We are in a consolidation trend above the 100 Moving Average.
Entry price: 2.90
First target: 3.30
Second target: 3.14
Third target: 3.31
Don't forget a simple matter: capital management.
When you reach the first target, save some money and then change your stop-loss order to an entry order.
For inquiries, please leave a comment.
Thank you.

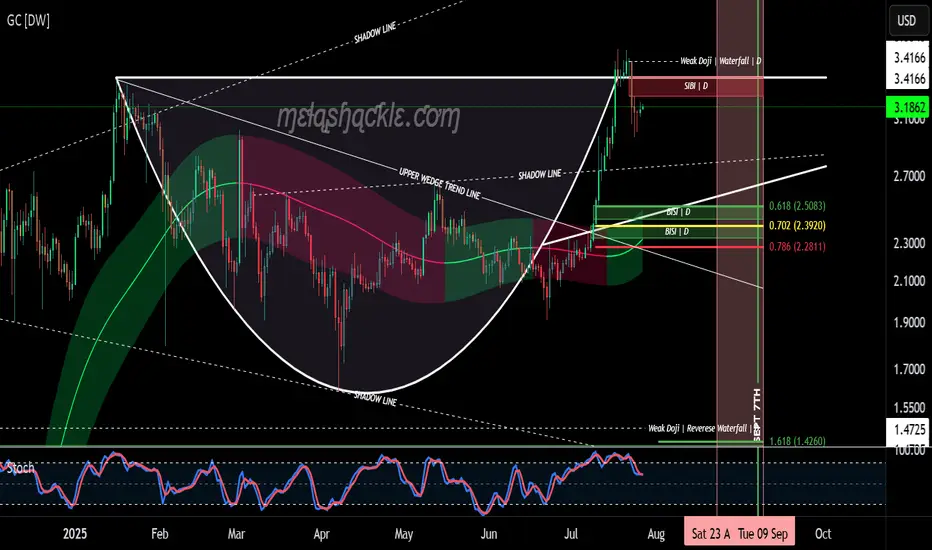
XRP Cup & Handle Pattern on the Daily Chart.XRP is now forming the handle on a very nice cup-and-handle pattern on the daily chart, starting at the previous all-time high set on January 16th, 2025.
But this pattern isn’t all sunshine and rainbows. The price of XRP could drop down into the $2.50 range—toward the bullish fair value gaps I’ve outlined at the bottom of the handle—before making any credible gains or a major breakout to higher levels.
I do believe we’ll see much higher prices in XRP in the coming years as we continue moving into the new global digital financial system. However, for this pattern to fully play out, there will likely be some pain before the pleasure.
I’d keep a close eye on the pink area marked on the charts—spanning from August 23rd through September 8th—as a potential zone for bearish price action.
Luckily for me, my XRP bags have been filled since before the Trump election pump, so I don’t personally need to buy more—unless I see a clear buying opportunity.
Good luck, everyone!
XRP/BTC – Channel Midline in Play The XRP/BTC pair trade inside a multi-year channel, with price currently testing the midline of this structure — a pivotal level that could define the next macro leg.
If bulls manage to break the midline to the upside and successfully retest it as support, the upper boundary of the channel becomes the next major target.
🔼 Upside Scenario:
A confirmed breakout above the midline would signal structural strength and likely lead to a rally toward the upper channel resistance.
If this move aligns with BTC dominance dropping below the 60% threshold, we could see a full-blown altseason emerge.
Under such conditions, historical XRP/BTC behavior suggests that XRP/USD could reach $12–$24.
🔽 Downside Risk:
Losing the mid-channel from here would weaken the structure and invalidate the breakout thesis.
In that case, XRP/BTC would likely rotate back toward range lows, and a defensive strategy is warranted.
Macro Implication:
The 60% BTC Dominance level remains critical. A clean breakdown below it historically marks the beginning of altseason, where high-beta plays like XRP against BTC have outperformed. XRP’s current posture within the channel reflects this high-stakes moment.
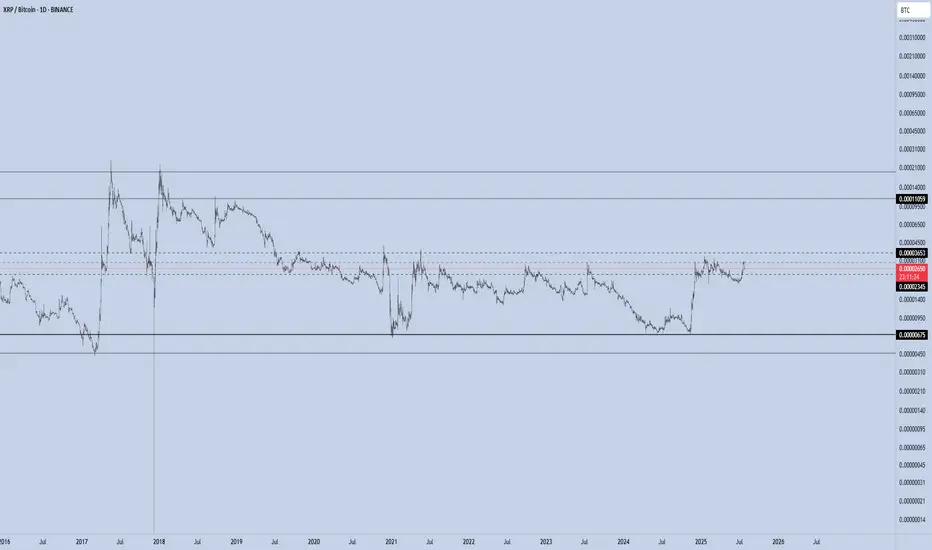
XRPBTC 303% Bullish Wave in the Making (Or Higher)One of the most unique charts in the entire Cryptocurrency market, XRPBTC produced very little retrace after its major late 2024 bullish breakout and recovery. This small retrace is a signal of strength. When prices produce a strong advance but fail to move deep once the advance is over—consolidation happening at high prices—this is one of the strongest signals the market can offer.
XRPBTC started at a low of 674 satoshis in mid-November 2024. The peak happened two months later at 3419 satoshis. Mid January 2025. Now, the retrace lowest point in June was 1928 satoshis. This is 185% higher compared to the November 2024 low, that's what I mean by strength.
The fact that there wasn't strong selling pressure after a 400% bullish wave, signals that participants are ready to hold long-term. And this is a great choice, people are smart. They are holding because they know XRP will continue to grow.
When it comes to Fibonacci retracements, the correction found support right at 0.5. When the market is weak, it tends to move below 0.618 and reach 0.786 or lower before recovering.
The rounded bottom is already in and the candles are starting to curve. Three weeks green, we can expect XRPBTC to produce a new wave of growth. The targets can be found on the chart.
Namaste.

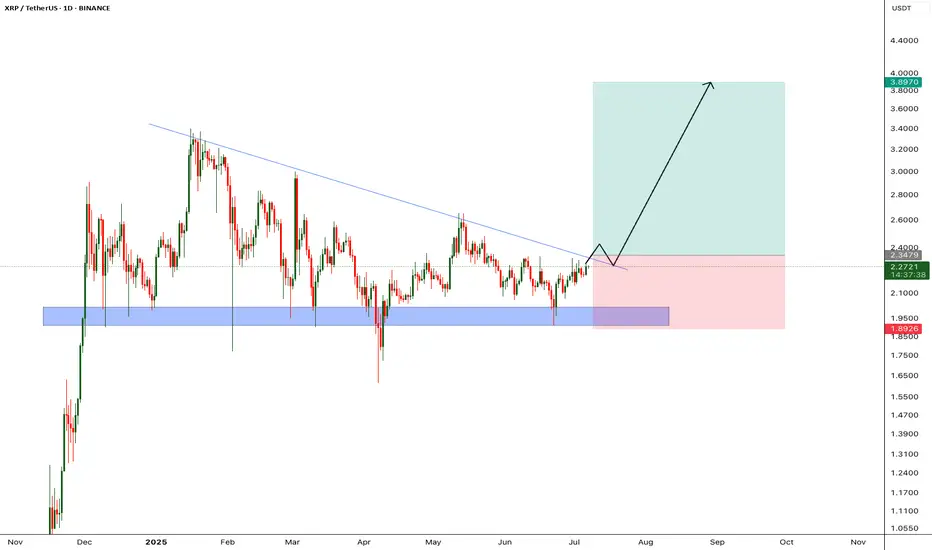
XRP - Huge breakout incomingXRP price is retesting it's descending trendline, in the past price got rejected from this trendline multple times, however im expecting price to breakout from this trendline since we almost at the last 2 quarters of bull run.
We will enter the trade after candle closes above the trendline
Entry Price: 2.34
StopLoss: 1.89
TP1: 2.5981
TP2: 2.8543
TP3: 3.2796
TP4: 3.8676
Like and follow.
Cheers
GreenCrypto
XRPBTC May Face Another Rally This YearXRPBTC pair can be trading in a larger weekly (A)(B)(C) flat correction, where wave (C) can be now in progress as a five-wave bullish impulse back to 2021 highs.
XRPBTC is currently slowing down due to BTC dominance, but notice that it's now testing February 2025 lows, so wave 4 correction can be coming to an end, which can extend the rally for wave 5 of (C) towards 0.000040 area and it can bring the ALTseason.

XRP Still in Buy Zone – Eyes on $2.50+our chart clearly marks that XRP has bounced off a strong buy zone (around the $2.10–$2.15 range), aligning well with a classic setup: price hitting support, creating a small base, and starting an upward rotation. 👇
Support area respected – The highlighted circle shows XRP revisiting the demand zone and quickly rebounding, very bullish behavior.
Lower wicks & volume spike – Indicate absorption of selling pressure and possible institutional interest.
Green arrow projection – Suggests a break above the immediate resistance (~$2.17 EMA/Ichimoku levels) could trigger a rally toward the next resistances around $2.22, $2.47, and potentially $2.63.
“Still in buy zone” annotation – Absolutely valid: as long as XRP stays above that key base ($≈$2.10), the bullish case holds.
🔍 Market Context
Range consolidation between ~$2.10–$2.30 has been the dominant theme, awaiting a breakout catalyst (e.g., ETF approvals or legal clarity)
thecryptobasic.com
+14
fxempire.com
+14
crypto.news
+14
.
Analysts highlight a falling wedge and support zone between $2.00–$2.20—if price holds, a move toward $3–$4 is plausible .
A range-bound weekly outlook anticipates a push toward $2.50 resistance before exploring higher targets .
✔️ Summary
Buy zone holding: Bullish pattern confirmed with rebound from support.
Key resistance levels: Watch for a breakout above $2.17/EMA and then $2.22–$2.30/$2.50.
Ideal strategy: Maintain position above support; add on breakout, targeting $2.50–$3.00.
Risk points: A drop below $2.10 could test $2.00 or even $1.85 support.

#XRP/USDT#XRP
The price is moving within a descending channel on the 1-hour frame, adhering well to it, and is heading towards a strong breakout and retest.
We are experiencing a rebound from the lower boundary of the descending channel, which is support at 2.21.
We are experiencing a downtrend on the RSI indicator that is about to be broken and retested, supporting the upward trend.
We are heading for stability above the 100 Moving Average.
Entry price: 2.24
First target: 2.27
Second target: 2.30
Third target: 2.35

xrpusd - fractal from the beginning Everything is fractal: big repeats small, and small repeats big. So if you want to do something big, you start small, then go a little bigger to understand how it works and how forces of nature affect it. As a result, small machines were designed first, then large ones. The same applies to graphs and patterns. Strength lies in simplicity.

XRP 4444 day mega pump/cycleI used geometric progression by cycles to gain a deeper understanding of what is happening on the graph, apart from what can be seen from the fractals. The fact that the graph repeats itself means that it is cyclical. Cyclicality in infinite time is infinite, which means it has no angles. The circle is the only thing in which one thing is known, namely the ratio of the circumference to its diameter, which allows us to extend the graph into the future using the number Pi. This can also be used in our work by applying mirror zones 69 96, calculating them from the circle.
I expect the start of strong growth on day 4444 in this time range and a breakout at zone 4144, followed by a retest with further growth, according to the fractal.
Translated with DeepL.com (free version)

XRP will start to outperform BTC in coming weeks.XRP will start to outperform BTC in coming weeks.
We have a golden cross on weekly timeframe and is reaching big support around 2000 sats also we had a nice reset on rsi levels between January and now.
On the montly timeframe we had nearly 6 months of consolidation. The next move will be a super explosive possibly a new all time high between xrp/btc.

#XRP/USDT#XRP
The price is moving in a descending channel on the 1-hour frame and is expected to continue upward.
We have a trend to stabilize above the 100 moving average once again.
We have a downtrend on the RSI indicator, which supports the upward move with a breakout.
We have a support area at the lower boundary of the channel at 2.25.
Entry price: 2.34
First target: 2.42
Second target: 2.47
Third target: 2.56
