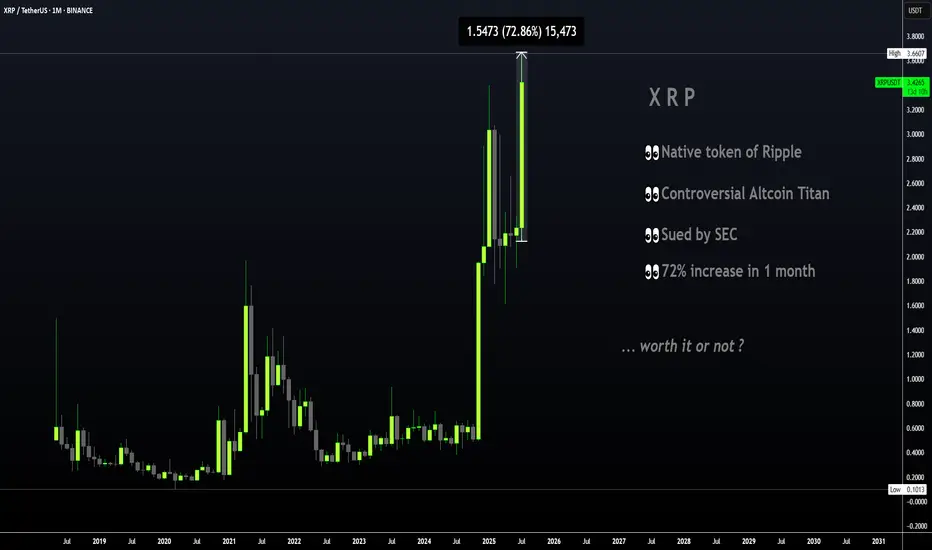
XRP Update · What To Expect Short-TermRetraces should be considered a buy opportunity. It is the only time when prices are not rising. Whenever there is a stop, a retrace, that is an opportunity to enter or buy more before the continuation of the bullish trend.
XRP started its latest major advance 22-June growing for 26 days straight peaking 18-July. there were only two red days in the entire move. This is certainly a strong advance and resulted in a new all-time high. More than 90% growth. After a strong move, there is always a pause, or correction or retrace.
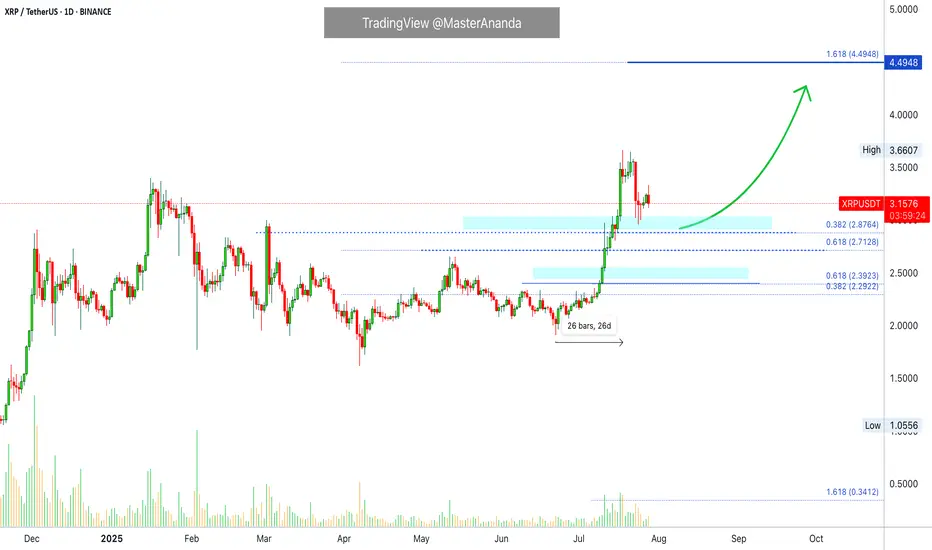
A retrace can last a few days. Seeing this chart, here it can even last for weeks as I see no hurry on this chart. Prices can consolidate at support before the next advance. Some small swings are expected but nothing big and always knowing that the end result will be an advance going further toward $4.44. The bigger picture.
Do not try to SHORT within a retrace or even correction. It can lead to disaster. It is better to wait for support to show up and once confirmed buy LONG. The upside has no limitations while the downside is limited. It is harder and carries more risk, even more now that the market is bullish and people are starting to wake up. People can see the development of a major rise now, people are becoming aware and soon there will be a rush. This rush will fuel the next wave of growth.
XRP can consolidate for a little while after finding support before reaching higher. Market conditions remain strongly bullish for this pair. If support breaks, things can change.
Namaste.
XRPUSDT
$500 Million XRP Accumulation To Drive 15% Price Rise to ATHBINANCE:XRPUSDT is currently trading at $3.20, which places it 14% away from reaching its ATH of $3.66. The support at $3.38 is crucial, and securing it could lead to further gains.
BINANCE:XRPUSDT has been seeing significant inflows in the past three days. Over 163 million XRP, worth around $519 million , have been accumulated by investors. This buying surge suggests that a wave of optimism is returning to the market, signaling that investors are positioning themselves for a potential price increase.
If BINANCE:XRPUSDT can reclaim support at $3.38 , it will be well-positioned to push past its ATH and reach new highs. This would mark a significant milestone for the altcoin, setting the stage for further price gains.
However, should the investor sentiment shift and selling pressure increase, BINANCE:XRPUSDT could face a decline. If the price falls below $3.00, it could slide to $2.96 or lower , invalidating the bullish thesis.

Bullish Signals Mount for XRP as Price Holds Weekend GainsXRP at a Crossroads: Technical Strength Meets Fundamental Catalysts in a High-Stakes Market
July 28, 2025 – In the volatile and ever-evolving world of digital assets, few tokens command as much attention, debate, and fervent community support as XRP. The digital asset, intrinsically linked with the fintech company Ripple, is currently navigating a period of intense market focus. After a period of consolidation, XRP is demonstrating renewed strength, holding onto recent gains and pressing against critical technical resistance levels. This price action is not occurring in a vacuum; it is the culmination of powerful undercurrents, including bullish chart patterns, significant accumulation by large holders, and a shifting landscape of regulatory clarity and institutional interest that could define its trajectory for years to come.
As of Monday morning, XRP has shown stability, trading around the $3.16 to $3.24 range. This follows a period where the token has been building momentum, with analysts closely watching key resistance zones between $3.30 and $3.40. A decisive break above these levels could signal the start of a new upward trend, while the ability to hold support, particularly around $3.15 to $3.20, is seen as crucial for maintaining the current bullish structure. This delicate balance has traders and long-term investors alike on high alert, as a confluence of technical indicators and fundamental developments suggests that XRP may be poised for its next significant move.
________________________________________
Chapter 1: Decoding the Charts: Bullish Patterns Emerge
For technical analysts, the recent XRP charts are a compelling study in bullish potential. Several classic patterns and indicators have emerged, suggesting that the path of least resistance may be upwards. These signals, watched closely by traders globally, are fueling a narrative of an imminent breakout.
One of the most discussed formations is the "Cup and Handle" pattern. This is a bullish continuation pattern that resembles a teacup on a chart. The "cup" is a U-shaped or rounded bottom that forms after a price run-up, indicating a period of consolidation and accumulation. This is followed by the "handle," a shorter and shallower downward drift in price, representing a final shakeout before a potential major upward move. Analysts have identified a large cup formation developing on XRP's long-term charts, with some pointing to a breakout zone around $3.64. A confirmed move above the handle's resistance could, according to technical theory, trigger an explosive rally, with some analysts projecting targets as high as $5.18, $7, or even a staggering $30 based on the pattern's depth.
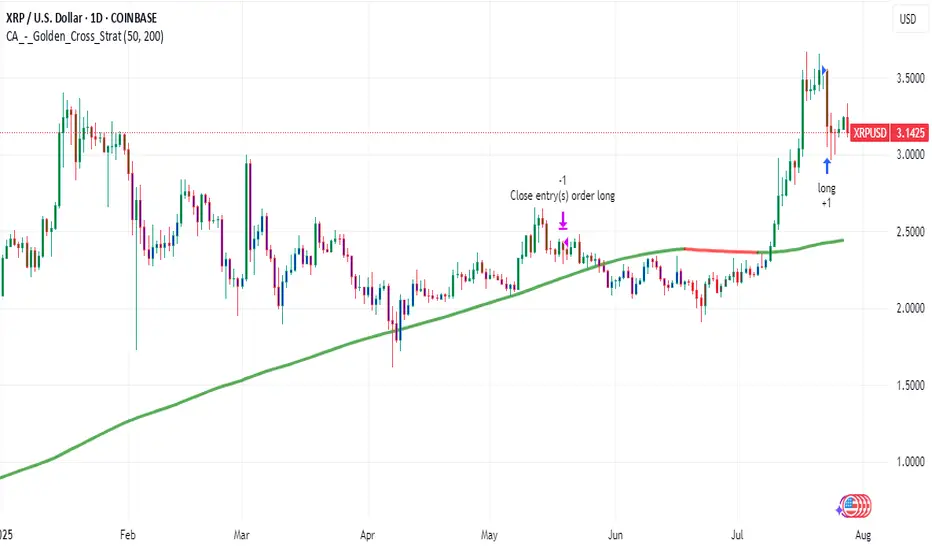
Adding to this bullish thesis is the appearance of a "Golden Cross." This occurs when a shorter-term moving average (like the 50-day) crosses above a longer-term moving average (like the 200-day) on a price chart. It is widely regarded as a signal of a potential long-term uptrend. A golden cross was recently confirmed on XRP's daily chart around July 23, 2025, an event that historically has preceded significant price runs. The last major golden cross in late 2024 was followed by a rally of over 460% in two months. While past performance is not indicative of future results, the reappearance of such a powerful signal has undoubtedly bolstered investor confidence.
Furthermore, a rare golden cross has also been observed on the XRP/BTC trading pair, where XRP's price is measured against Bitcoin. This specific event, where the 23-day moving average crossed the 200-day, previously preceded a 158% surge in the pair's value in just two weeks. The near-identical structure of the current pattern has led analysts to suggest that XRP may be poised to outperform Bitcoin in the near term, especially as Bitcoin's price has been consolidating, shifting investor focus toward promising altcoins.
These technical signals—from the broad Cup and Handle to the precise Golden Cross—are painting a picture of a market coiling for a significant move. They suggest that underlying buying pressure is quietly building, setting the stage for a potential breakout if the market's fundamental drivers align.
________________________________________
Chapter 2: The Whale Effect: Following the Smart Money
Beyond the lines on a chart, the actions of the market's largest players—colloquially known as "whales"—provide another critical layer of insight. These are individuals or entities holding vast amounts of a cryptocurrency, and their trading activity can significantly influence market trends and sentiment. Recently, on-chain data has revealed a clear and compelling trend: XRP whales are accumulating.
In a remarkable show of force, wallets holding between 10 million and 100 million XRP have been steadily increasing their holdings, adding over 130 million XRP in a single day recently. These large-scale investors now control approximately 14% of the circulating supply, a historic high for this cohort. This accumulation is significant because it suggests that sophisticated, well-capitalized market participants are confident in XRP's future prospects and are positioning themselves for a potential price increase.
Simultaneously, the flow of XRP from whale wallets to exchanges has plummeted by over 93% since early July. This is a crucial indicator, as large transfers to exchanges often signal an intention to sell. The sharp decline suggests that whales are not only buying more XRP but are also holding onto their existing assets, reducing the available supply on the market and removing significant sell-side pressure. This behavior, often described as a "supply shock," can create a powerful tailwind for the price if demand continues to rise.
This intense accumulation has not gone unnoticed. In one instance, two identical transactions moved a combined 306.4 million XRP, worth nearly $1 billion, from an exchange to a private wallet within 60 seconds. Such large, coordinated movements are often interpreted as strategic positioning ahead of anticipated positive news or a market-wide rally. This activity, combined with reports of over 2,700 wallets now holding at least 1 million XRP each, paints a picture of broad-based accumulation among the asset's most significant backers. This "smart money" activity often provides a psychological boost to retail investors, reinforcing the belief that a major move could be on the horizon.
________________________________________
Chapter 3: The Fundamental Pillars: Regulation, ETFs, and Utility
While technicals and whale movements drive short-to-medium-term sentiment, the long-term value of any digital asset rests on its fundamental pillars. For XRP, these pillars are its evolving regulatory status, the tantalizing prospect of a spot Exchange-Traded Fund (ETF), and its core utility within Ripple's global payments network.
Regulatory Clarity on the Horizon:
The most significant overhang on XRP for years has been the lawsuit filed by the U.S. Securities and Exchange Commission (SEC) in December 2020, which alleged that Ripple conducted an unregistered securities offering. This legal battle has been a focal point for the entire crypto industry. However, recent developments have shifted sentiment dramatically. Key court rulings, including a partial victory for Ripple where a judge determined that some of its XRP sales did not qualify as securities, have bolstered institutional confidence.
Currently, the case is in a delicate phase, with both Ripple and the SEC having paused their respective appeals. While rumors of a final settlement swirl, legal experts caution that the process is subject to the SEC's internal bureaucratic procedures and a formal vote is still required. Nevertheless, the prevailing belief is that the worst of the legal uncertainty is over. A final resolution, which many hope will come before the end of the year, would remove the primary obstacle to XRP's full-scale adoption in the United States and could pave the way for its relisting on major exchanges and inclusion in institutional products.
The Race for a Spot XRP ETF:
Following the landmark approvals of spot Bitcoin and Ethereum ETFs, the crypto market is buzzing with anticipation for what comes next. XRP is widely considered a prime candidate for its own spot ETF. Asset management giants like Grayscale, Bitwise, Franklin Templeton, and WisdomTree have already filed applications with the SEC.
The approval of a spot XRP ETF would be a watershed moment, providing a regulated, accessible, and insured investment vehicle for both retail and institutional investors in the U.S. to gain exposure to XRP. The launch of XRP futures-based ETFs has been seen as a positive precursor, following the same playbook that led to the spot Bitcoin ETF approvals. Market analysts and prediction markets have placed the odds of a spot XRP ETF approval in 2025 as high as 92-95%, contingent on a favorable resolution of the SEC lawsuit. Such an approval could unlock billions of dollars in institutional inflows, dramatically increasing demand and market legitimacy for the asset.
Core Utility in Global Payments:
At its heart, XRP was designed for utility. It serves as the native digital asset on the XRP Ledger, a decentralized blockchain engineered for speed and efficiency. Its primary use case is powering Ripple's payment solutions, which are now part of the broader Ripple Payments suite.
Ripple's network is designed to challenge the legacy correspondent banking system, exemplified by SWIFT, which can be slow and costly for cross-border payments. By using XRP as a bridge currency, financial institutions can settle international transactions in seconds for a fraction of a cent, without needing to pre-fund accounts in foreign currencies. This utility is not merely theoretical. Ripple has forged partnerships with over 300 financial institutions across more than 45 countries, with a significant portion utilizing XRP for liquidity. In 2024 alone, over $15 billion was transacted via Ripple's liquidity solutions, and the XRP Ledger is now processing over 2 million transactions daily. This growing, real-world adoption provides a fundamental demand for XRP that is independent of market speculation and forms the bedrock of its long-term value proposition.
________________________________________
Chapter 4: The Retirement Dream: Audacious Predictions and Future Outlook
The convergence of bullish technicals, strong fundamentals, and growing market optimism has led to a wave of bold price predictions from analysts. While highly speculative, these forecasts illustrate the immense potential that many see in XRP, fueling a narrative that significant holdings could lead to life-changing wealth.
Price targets for the current cycle vary widely, reflecting different models and timelines. Short-term targets frequently center around the $4 to $7 range, with some analysts suggesting a move to $9 or $15 is possible if momentum continues. One analyst, citing a rare bullish chart pattern, sees a potential 60% rally to around $4.47.
Looking further out, the predictions become even more audacious. Projections based on historical cycles and technical models, such as Elliott Wave theory, have put forth long-term targets of $16, $24, and even $27. Some AI-driven prediction models forecast that XRP could reach the $10-$20 range by the end of 2025, especially if an ETF is approved. Longer-term forecasts extending to 2030 suggest prices could potentially climb to between $19 and $48, depending on the level of global adoption.
These predictions have given rise to the "retire on XRP" dream among its community. For instance, if XRP were to reach one analyst firm's high-end forecast for 2030 of $32.60, an investment of 10,000 XRP could be worth over $326,000. While tantalizing, it is imperative for investors to approach such forecasts with extreme caution. The cryptocurrency market is notoriously volatile, and such high-reward potential is invariably accompanied by high risk. Regulatory setbacks, macroeconomic downturns, or a failure to achieve widespread adoption could all significantly impact XRP's future price.
Conclusion: A Confluence of Forces
XRP currently stands at one of the most fascinating junctures in its history. The digital asset is being propelled by a powerful confluence of forces: bullish technical patterns are signaling a potential breakout, on-chain data shows undeniable accumulation by its largest holders, and its fundamental value proposition is being strengthened by increasing regulatory clarity, the imminent possibility of a spot ETF, and steadily growing real-world utility.
The journey ahead is fraught with both immense opportunity and significant risk. A decisive break above its current resistance could unleash the momentum that analysts and investors have been anticipating for months. However, the market remains sensitive to legal news and broader macroeconomic trends. For now, XRP remains a bellwether asset, its story a microcosm of the broader struggle and promise of the digital asset industry—a high-stakes battle for legitimacy, adoption, and a permanent place in the future of finance
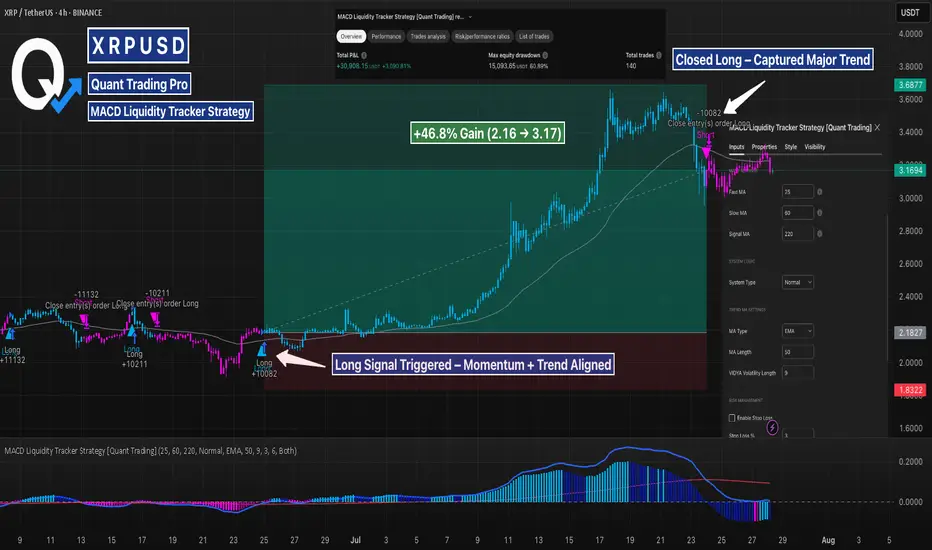
XRP MACD Liquidity Tracker Strategy – Clean Trend Catch (4H)This backtest showcases how the MACD Liquidity Tracker Strategy handled a major trend shift on XRP’s 4H chart. The long was triggered once MACD momentum aligned with the 60/220 EMA trend filters — clean confirmation without noise.
The system stayed with the move through a multi-day rally and exited as momentum began to fade. Visual bias (blue = long, pink = short) made trend context easy to follow, and the settings ensured no premature signals during consolidation.
📊 Strategy Inputs:
MACD: 25 / 60 / 220
Trend Filter: 60 & 220 EMA
System Type: Normal
A great example of how combining momentum + trend confirmation filters can remove second-guessing. This is Backtest Idea #1 in a 10-post strategy series.
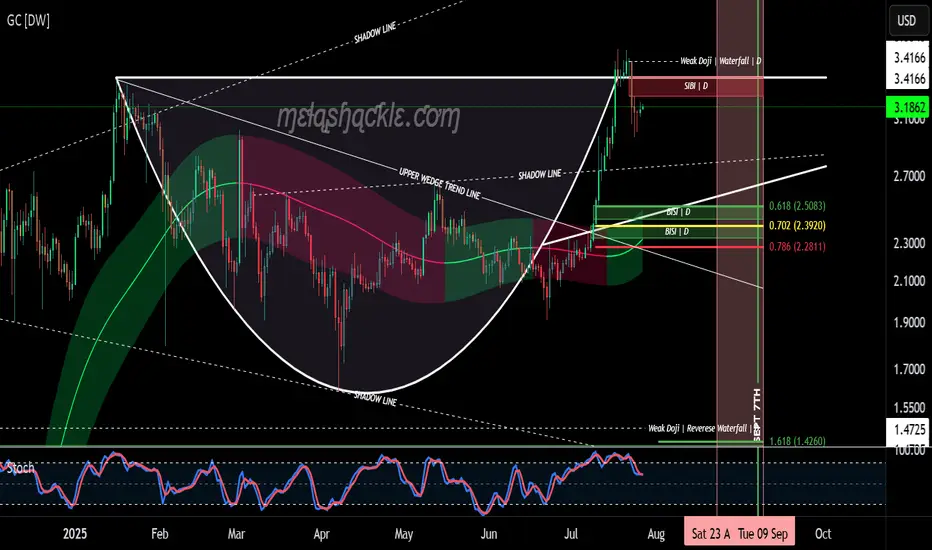
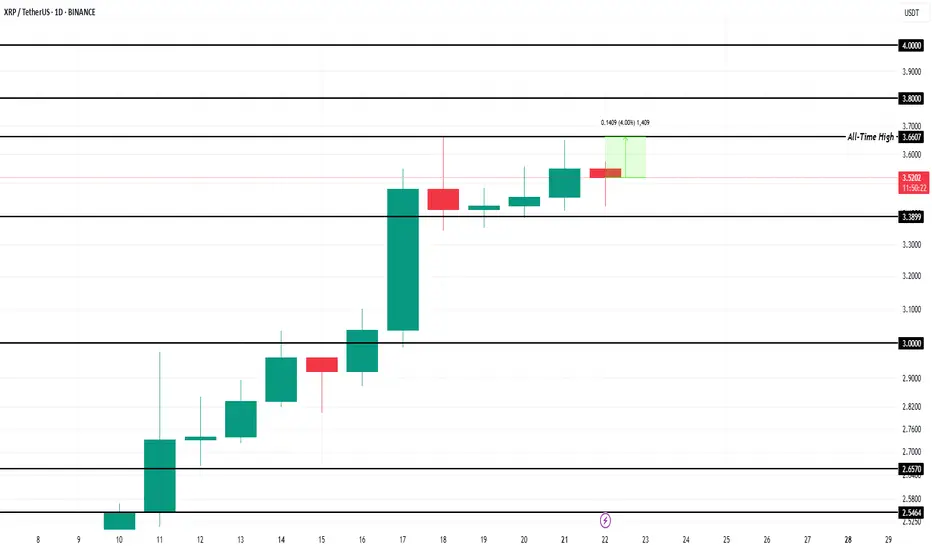
XRP Cup & Handle Pattern on the Daily Chart.XRP is now forming the handle on a very nice cup-and-handle pattern on the daily chart, starting at the previous all-time high set on January 16th, 2025.
But this pattern isn’t all sunshine and rainbows. The price of XRP could drop down into the $2.50 range—toward the bullish fair value gaps I’ve outlined at the bottom of the handle—before making any credible gains or a major breakout to higher levels.
I do believe we’ll see much higher prices in XRP in the coming years as we continue moving into the new global digital financial system. However, for this pattern to fully play out, there will likely be some pain before the pleasure.
I’d keep a close eye on the pink area marked on the charts—spanning from August 23rd through September 8th—as a potential zone for bearish price action.
Luckily for me, my XRP bags have been filled since before the Trump election pump, so I don’t personally need to buy more—unless I see a clear buying opportunity.
Good luck, everyone!
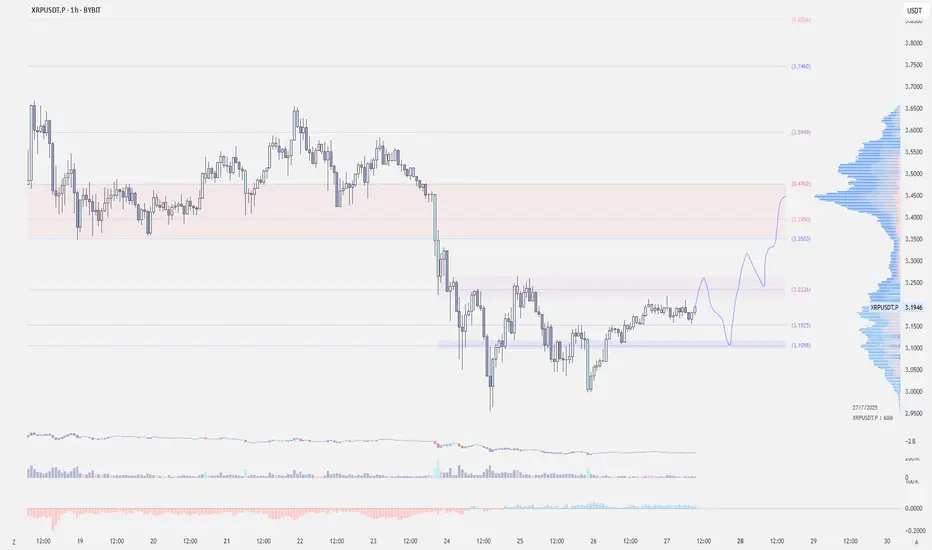
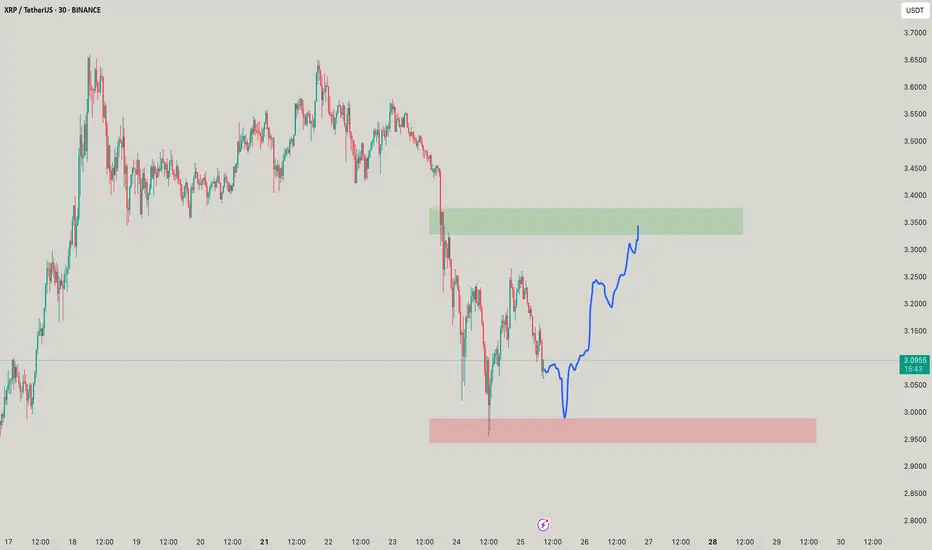
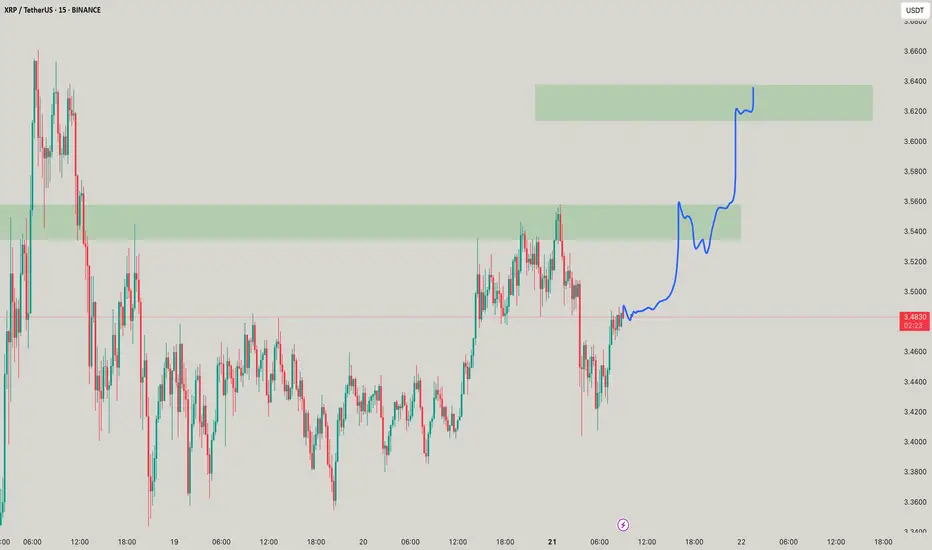
$XRP - Long Trade IdeaCRYPTOCAP:XRP | 1h
Possible retest of $3.24–3.26
If we see rejection, I'll look to enter around $3.12–3.09, targeting $3.35–3.47 (previous value area).
Stoploss set to $3.03-$3
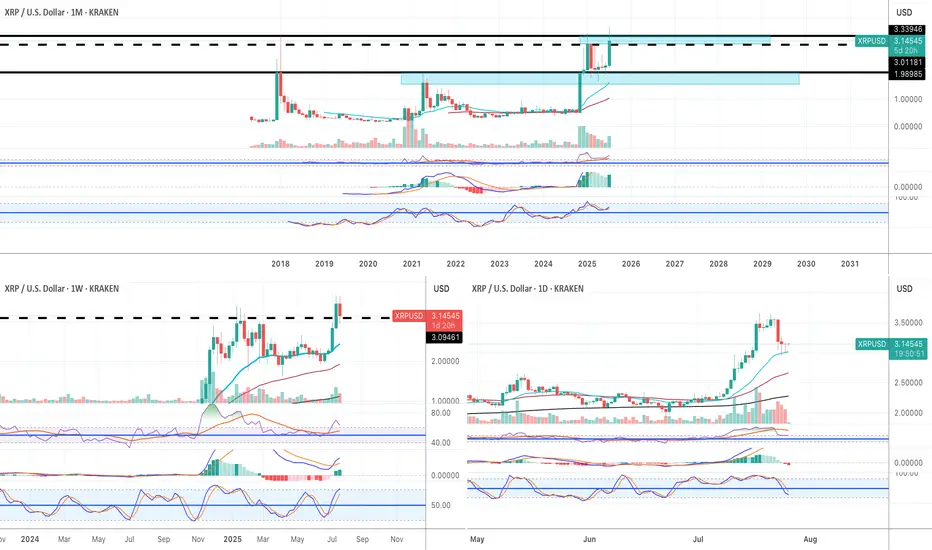
Super bullish!! (I am not a XRP fan, but still) XRP is one of those cryptocurrencies that attract cult-like followers. I am not one of them.
Fundamentally I have no idea about the long term potential of XRP. HOWEVER, purely based on technicaly analysis, it looks very bullish to me.
Monthly:
1) the price finally broke above the 2018 historical ATH.
2) All momentum indicators in the bull zone.
3) Both RSI and MACD are in the overbought territory but they can remain in the OB territory for weeks and weeks when the macro bull trend begins.
4) Stochastic lines have crossed to the upside in the bull zone.
Weekly:
1) all momentum indicators are in the bull zone.
2) The price broke above the historical ATH. It is going through pull back now, but, there is a strong buying pressure around $3.15.
Daily:
1) all momentum indicators have reached the overbought territory. The lines are now rolled to the downside, however, it is likely to be a corrective move.
2) the price is hovering above EMA21 where the recent price breakout happened on Thurs 17th July. I have been monitoring price action in lower time frames such as 5 and 15 minutes, and it looks like the price does not want to go below the previous historical high at this stage.
I am not very familiar with XRP, but purely based on the current price action, it looks very bullish. For the very first time as a trader/investor, I deployed my capital to buy XRP last Wed (just under $3.00).
I have already took some profit when it hit $3.60. But I am planning to sell 90% of my XRP when it reaches $4.50 and $5.00, and let the rest run just in case it goes to the moon😅.
XRPUSDTBINANCE:XRPUSDT broke above its long-term downtrend line and surged to the $3.5000 resistance area, but is now undergoing a correction. The current bullish structure, with a higher high and higher low, suggests the trend remains upward. A pullback toward the $3.0000 demand zone is likely and would be a healthy retracement. Holding this area could trigger a continuation toward the key resistance at $4.2000.
Key Level Price
Main Support $2.2000
Main Resistance $4.2000
Best Buy Range $2.9500 – $3.1500
Best Sell Range $4.1000 – $4.2000
Investment Risk (Buying) Medium
⚠️Please control RISK management
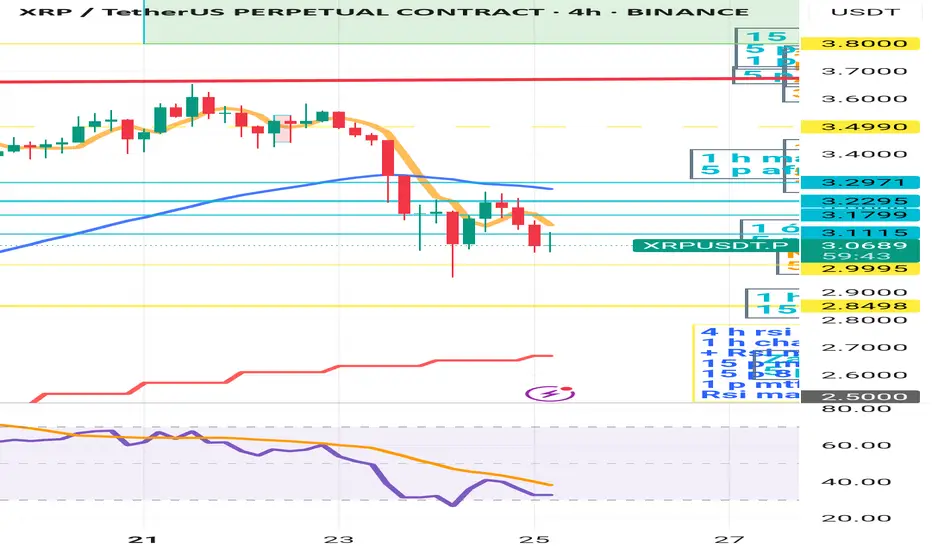
XRP is still waiting for a longI think that XRP - and looking at the Total Market Cap chart - has taken a downward trend. Although the RSI is well above 70 on the daily timeframe, the faster leg is already approaching 50. Looking at the 4-hour RSI, as long as it is below 50, I do not expect an upward movement. I see a chance for further upward movement if the chart is currently above $3.2971. It is worth watching the 4-hour 50 EMA for possible long position opening, but only if the price crosses the 4-hour 50 EMA upwards. There could be a danger if it breaks the 50 EMA on the daily, which will be around $2.7. I should add that the 4-hour 200 EMA is around $2.8, so there will be a band between 2.7-2.8 where the chart can dance before deciding which direction to take. As long as the RSI MA is above 50 on the day, long-term positions - which were started around 2023 - should not be negatively affected by this "small" sell off. I think it is worth waiting for now for longs, not to enter an upward trade into the declining chart. Attention should be focused on the 4-hour 50 ema/chart cross, and the 4-hour rsi MA 50 cross. Until these are met, starting a long is life-threatening. I am curious how you see it.
XRP ~ Is this a best trade to take?XRP ~ This beauty is best to be buys at the red nd aim for the greeens!
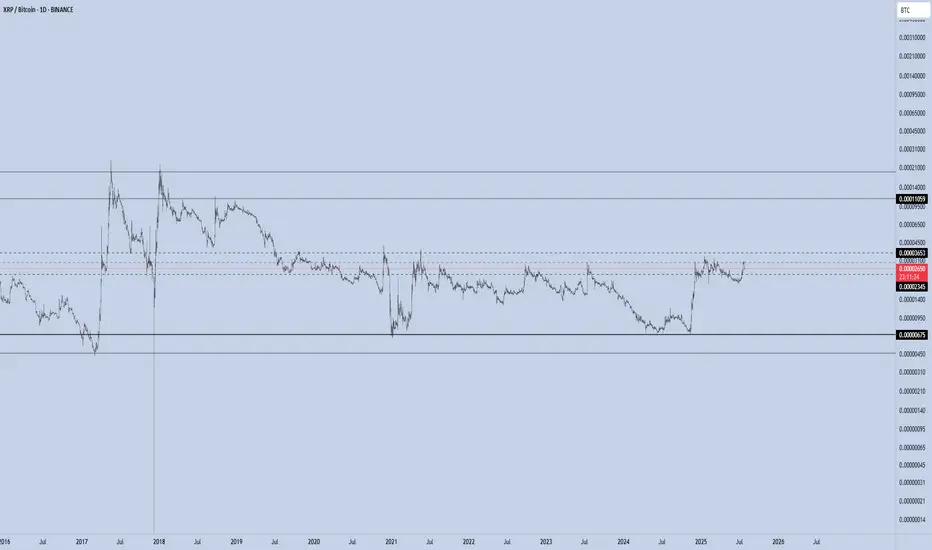
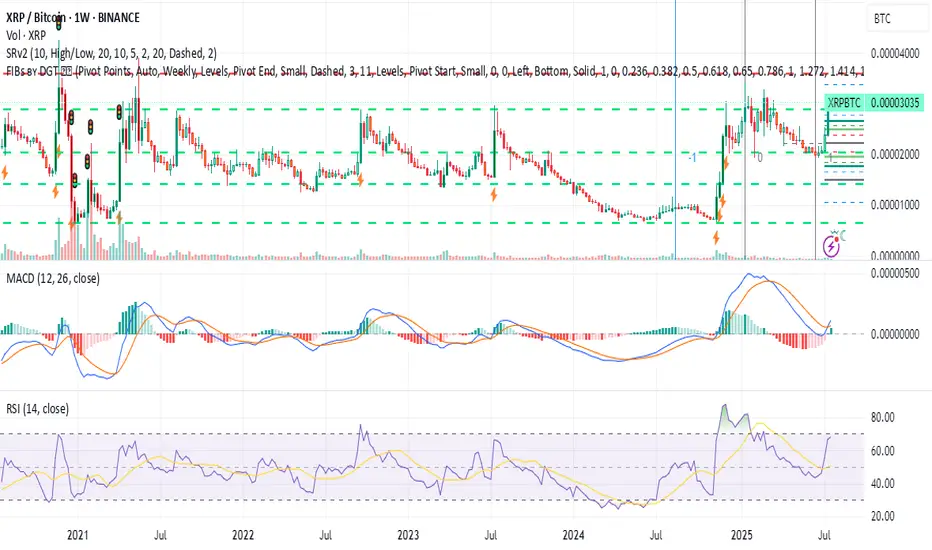
XRP/BTC – Channel Midline in Play The XRP/BTC pair trade inside a multi-year channel, with price currently testing the midline of this structure — a pivotal level that could define the next macro leg.
If bulls manage to break the midline to the upside and successfully retest it as support, the upper boundary of the channel becomes the next major target.
🔼 Upside Scenario:
A confirmed breakout above the midline would signal structural strength and likely lead to a rally toward the upper channel resistance.
If this move aligns with BTC dominance dropping below the 60% threshold, we could see a full-blown altseason emerge.
Under such conditions, historical XRP/BTC behavior suggests that XRP/USD could reach $12–$24.
🔽 Downside Risk:
Losing the mid-channel from here would weaken the structure and invalidate the breakout thesis.
In that case, XRP/BTC would likely rotate back toward range lows, and a defensive strategy is warranted.
Macro Implication:
The 60% BTC Dominance level remains critical. A clean breakdown below it historically marks the beginning of altseason, where high-beta plays like XRP against BTC have outperformed. XRP’s current posture within the channel reflects this high-stakes moment.
XRP : Long term analysisHello friends🙌
🔊Considering the great growth that the price has had and has set a new ceiling, be careful because we are at the ceiling and when we are at the price ceiling, we should always expect a price correction...
⚠Now, given the strong upward trend we have, you can buy with risk and capital management, but our suggestion is lower prices for the possibility of a correction and the possibility of a reversal pattern.
So we have identified important support levels for you and we have also identified price targets.
🔥Follow us for more signals🔥
*Trade safely with us*

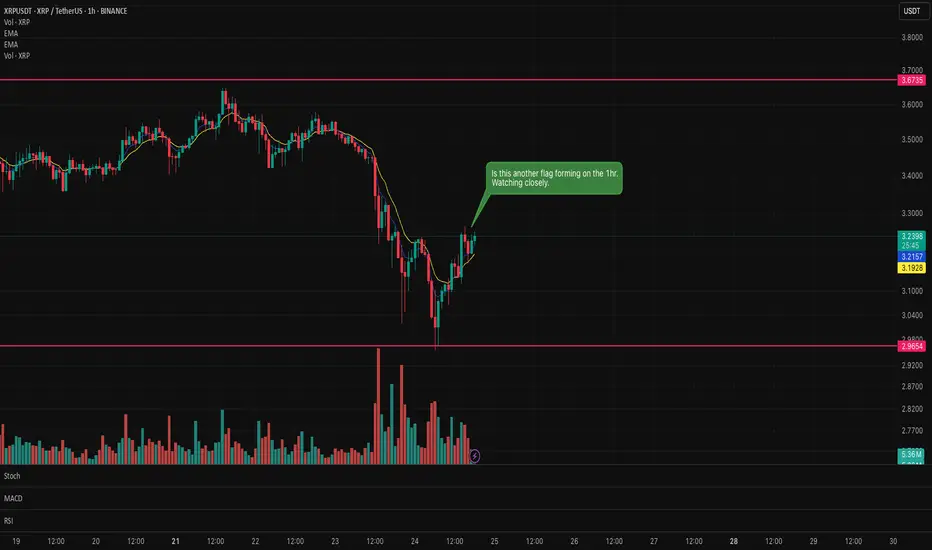
Is there another XRP flag forming on the hourly chart?Could be another flag forming on XRP. Waiting for the formation to prove confirmation as to whether it will be a bull or bear flag.
News of large amounts of XRP entering the exchanges from the CEO could mean a bear flag?
It's only appearing on the hourly so it could be a false flag.
Let's what and see what forms on the hourly candle.
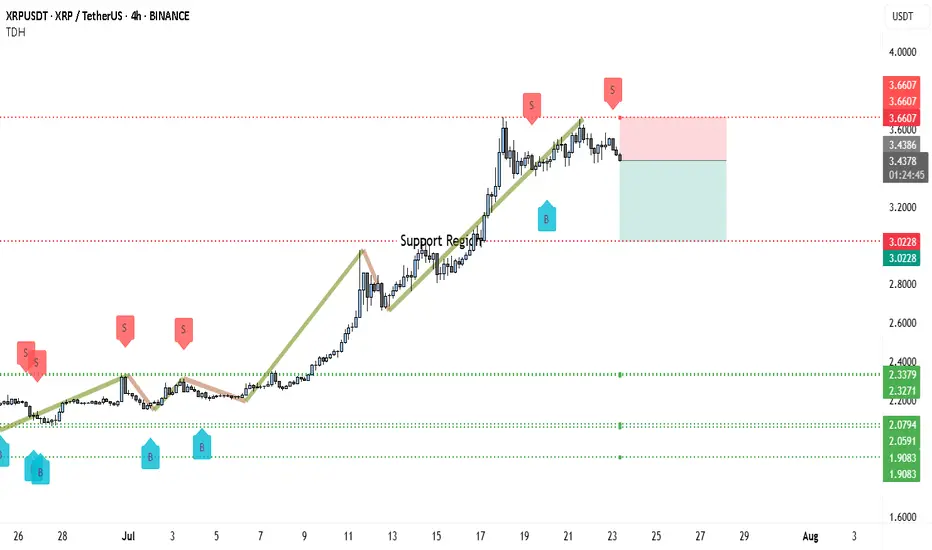
Is XRP About to Crash to $2.40? Charts Don’t LieXRP has been in a steady bullish run throughout July, but cracks are beginning to show. The price recently failed to hold above the key $3.66 resistance, and what once looked like a strong continuation setup now hints at exhaustion. Price action shows clear hesitation near the $3.60–$3.66 region, where multiple “Sell” (S) markers have emerged.
More importantly, the ascending trendline has been broken, and XRP is consolidating beneath it — often a sign of a shift in structure. A lower high has now formed, which could be the early warning of a short-term top.
If buyers can't reclaim the $3.43–$3.60 zone soon, XRP could enter a deeper pullback phase. The former support band between $3.02 and $3.05 is now being tested from below, and if this flips to resistance, further downside looks likely.
There’s a visible liquidity void below $3.00, and with XRP having rallied significantly, a retracement to retest deeper support zones wouldn’t be surprising. Areas like $2.80, $2.40, and even $2.00 are still untouched and could attract buying interest if panic kicks in.
📊 Trading Setup
• Entry (Sell): Around $3.43 (confirmed rejection)
• Stop Loss: Just above $3.66 (key resistance and invalidation zone)
• Target 1: $3.02 (minor support zone)
• Target 2: $2.40–$2.33 (stronger cluster with past reaction)
• Risk-to-Reward: Approx. 1:1.8 — favorable for swing short
The structure is now showing early signs of bearish reversal. The failure to break above $3.66, break of the trendline, and formation of a lower high all signal weakness. If XRP drops below $3.02 and holds there, it may trigger a more aggressive selloff toward mid-$2s. This short setup is valid as long as the price stays below $3.66 — beyond that, bulls might regain control.
Let me know if you want a continuation scenario or need this adapted for tweet threads or YouTube script.
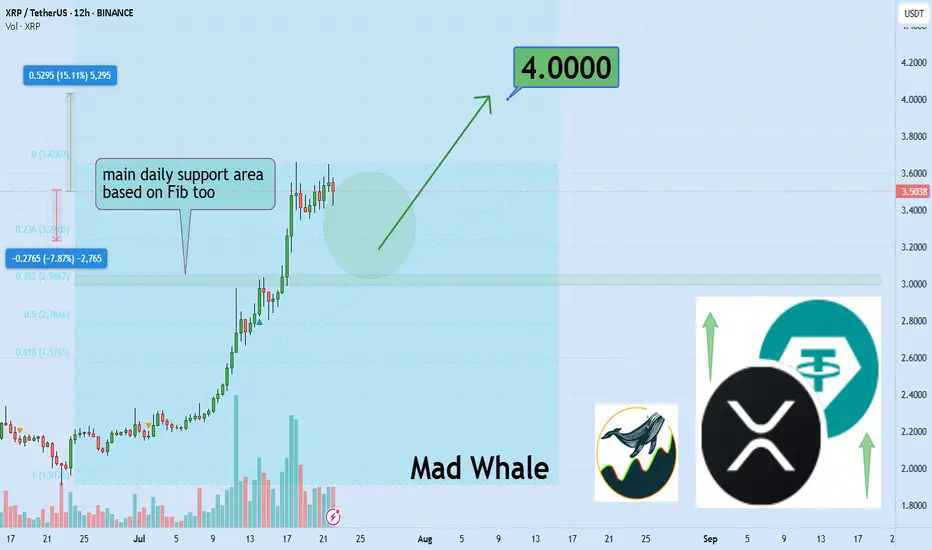
Can Ripple hit $3.40 with 15% upside soon?Hello✌
let’s dive into a full analysis of the upcoming price potential for Ripple📈.
BINANCE:XRPUSDT is poised to challenge the $3.40 level soon, supported by a notable increase in market volume 📊. This price zone also coincides with a key support area aligned with sharp Fibonacci levels, offering a strong base for potential upward movement 🔥.
✨ Need a little love!
We pour love into every post your support keeps us inspired! 💛 Don’t be shy, we’d love to hear from you on comments. Big thanks , Mad Whale 🐋

XRP Price Reversal Likely After $2.81 Billion Selling In 7 DaysBINANCE:XRPUSDT is currently trading at $3.48, only 4% away from its all-time high . Over the past week, exchange wallets saw an influx of nearly 450 million XRP, valued at more than $2.81 billion . This spike in supply indicates that holders are moving their assets to sell, usually a bearish indicator in market cycles.
Despite the proximity, BINANCE:XRPUSDT price is showing signs of weakness and is clinging to the $3.38 support level . Without renewed buying interest, this support may not hold much longer.
If investor selling continues, BINANCE:XRPUSDT could fall through $3.38 and test the $3.00 support . A drop to this level would erase the recent gains and confirm a near-term bearish reversal. The loss of $3.00 could signal a longer consolidation phase or deeper correction.
However, if market participants absorb the sold supply and restore demand, BINANCE:XRPUSDT could rebound quickly . In this scenario, the altcoin might surpass $3.66, breach $3.80, and aim for $4.00 . Such a move would invalidate the bearish outlook and set a new all-time high.
The More You Believe You Know The More You LoseThe moment you see your first green position something changes Suddenly your brain convinces you you’ve got this But the market doesn’t punish bad traders it punishes the ones who think they’re too good to lose
You don’t lose because you’re unskilled
You lose because you believe you’ve mastered the game
Hello✌️
Spend 3 minutes ⏰ reading this educational material.
🎯 Analytical Insight on Ripple:
BINANCE:XRPUSDT remains undervalued at current levels, showing strong volume near a key daily support zone that aligns closely with a major Fibonacci retracement. This confluence suggests a potential shift in momentum. If buyers hold this level, a move toward the $4 area is on the table, representing an estimated 15% upside. 📈 Watch for confirmation through sustained volume and price reaction at support. ⚡
Now , let's dive into the educational section,
🎯 The Confidence Trap
One of the most dangerous mental states for a trader is early victory That moment after a couple of green trades when you start feeling like you’ve figured the market out That’s when the market does to you what you used to do to clueless beginners
From that point forward your decisions aren’t based on analysis they’re based on this thought
I already know how this works.
🧠 How Your Mind Tricks You
You win once Your brain says “Told you you’re good”
You win again It says “Go heavier now”
You lose It says “Fix it now You’ve done it before”
This cycle leads to overtrading and emotional revenge You’re no longer trading the market you’re defending the version of yourself you believe you’ve become
🔄 The Market Doesn’t Send Signals It Sends Lessons
When the market moves against you it’s doing the right thing It’s breaking down your ego so you can finally start seeing the chart for what it is not what your confidence wants it to be
🧱 Experience Can Kill Learning
Many failed traders are not beginners they’re the ones with years of bias built up At some point they stop learning Every chart starts looking the same That’s when their final trade shows up
🕳 The Ego Pitfall
If your mind tells you “I know this” it’s time to be extra cautious That means you’re trading with a rigid mindset And in crypto markets the rigid get destroyed
📉 High Leverage = High Confidence = High Risk
Nobody gets reckless on 2x leverage But once you start feeling pro you go 20x 50x or more And when the market flips the same ego that won you your first big gain is the one that wipes out your entire account.
📊 How TradingView Tools Can Save You
In this mental trap three tools from TradingView can seriously help
Replay Bar Tool
Go back in time and relive previous market conditions This tool shows you exactly where your bias failed and where your overconfidence blinded you It helps kill that false feeling of mastery
OBV (On Balance Volume)
A simple yet powerful volume indicator If price rises but OBV is falling the uptrend is fake If price drops but OBV is climbing sellers are weak and a reversal might be near This gives volume context beyond candles
Volume Spike
Watch out for sudden surges in volume If volume explodes but price barely moves someone big is moving in silence It’s often the prelude to fakeouts traps or major directional shifts These spikes scream pay attention
Risk-to-Reward Tool
Don’t let your “confidence” make you forget basic math This tool gives you the true ratio of what you’re risking versus what you’re chasing It doesn’t care how good you feel it shows you if the trade makes sense
🧊 Humility Is the Only Edge That Lasts
Humility means accepting you might always be wrong It means checking yourself with objective tools It means saying “maybe” instead of “definitely”
It means lasting longer than the rest
🔚 Final Words
If you’re sure you’ve mastered the market pause The best traders second-guess themselves often not because they’re weak but because they know confidence fades but risk never does
✨ Need a little love!
We pour love into every post your support keeps us inspired! 💛 Don’t be shy, we’d love to hear from you on comments. Big thanks , Mad Whale 🐋
📜Please make sure to do your own research before investing, and review the disclaimer provided at the end of each post.
XRP Eyes Explosive Growth: A Path to $10 and a 2025 "Euphoria PhThe cryptocurrency market is charged with renewed optimism, and much of the focus is now turning to established digital assets like XRP. After a prolonged period of consolidation, a powerful combination of bullish technical indicators, evolving market dynamics, and a compelling value proposition is fueling forecasts of a significant price surge. Market analysis now points to a potential future where XRP could trade in the $6 to $10 range, a move that hinges on Bitcoin achieving a landmark price of $144,000.
Adding to this momentum, detailed chart analysis suggests that XRP may be on the cusp of entering a "euphoria phase" between August and October of 2025, a window that could see unprecedented growth. As market leaders Bitcoin and Ethereum become increasingly expensive for the average investor, a strong argument is emerging that XRP currently offers a superior entry point, blending high potential with accessibility. This convergence of factors is positioning XRP as a token to watch, with many believing its next major bull run is not a matter of if, but when.
The Bitcoin Catalyst: Charting XRP's Trajectory to $10
A significant component of XRP's bullish outlook is directly tied to the performance of Bitcoin. The relationship between the two assets, often measured by the XRP/BTC trading pair, is showing signs of a historic shift. Technical analysis of the XRP/BTC monthly chart reveals that its price is coiling tightly just below a critical resistance level. A definitive monthly close above this threshold would represent a major technical breakout, signaling a powerful reversal of its long-term trend against Bitcoin. Such a move would be the first of its kind since 2018 and could unleash substantial upward momentum.
Should this breakout on the XRP/BTC chart materialize, technical projections indicate an initial move toward a higher valuation, with a primary target zone identified. If this rally in the trading pair coincides with Bitcoin’s price climbing to the projected $144,000 level, the math translates to a U.S. dollar valuation for XRP of between $6 and $10. The timing for such a move is projected for late 2025, assuming Bitcoin’s own bull run accelerates as anticipated.
The XRP/USD chart independently supports this constructive outlook. A recent weekly close above a key price level has flipped several long-term indicators to a bullish stance, generating a classic breakout signal. Using standard technical projection models, such as Fibonacci extensions, price objectives for XRP now stand at approximately $4.53, $6.31, and even as high as $9.22. The journey to these targets, however, remains heavily dependent on the broader market strength led by Bitcoin. A stall in Bitcoin's advance would likely moderate the upside potential for XRP.
The "Euphoria Phase": Why Late 2025 Could Be Explosive
Beyond its relationship with Bitcoin, XRP's own price chart is signaling immense latent potential. After trading within a defined range for years, the token is now exhibiting powerful bullish signals on its weekly chart, suggesting a breakout from a multi-year consolidation pattern is underway.
Several key technical indicators are aligning to confirm the start of a new, sustained uptrend. A clear bullish crossover on the weekly Moving Average Convergence Divergence (MACD) indicator—a trusted measure of market momentum—has already occurred. At the same time, the Relative Strength Index (RSI) is climbing steadily but has yet to enter the overbought territory that has historically marked the peak of major cycles. This indicates that there is still significant room for price appreciation before the rally becomes exhausted.
A critical psychological and technical price level now stands at $5. A firm weekly close above this mark would be a monumental event, likely triggering a wave of intense buying pressure and shifting market sentiment from simple optimism into full-blown euphoria. If this breakout is confirmed, the next macro price targets are projected to be in the $8 to $11 range, levels consistent with the price action seen in XRP's previous parabolic advances. Based on historical cycle patterns and the current technical structure, this explosive phase could unfold between August and October of 2025.
The Value Proposition: Why XRP Stands Out in a High-Priced Market
As Bitcoin and Ethereum command prices that put them out of reach for many new participants, a psychological barrier to entry has formed. It is in this environment that XRP’s unique market position becomes a powerful advantage. The investment case for XRP is straightforward and highly attractive to first-time crypto buyers who may be experiencing "sticker shock" from the market leaders.
With its high market capitalization and global recognition, combined with a low per-unit price, XRP presents an appealing proposition. This dynamic, often referred to as "unit bias," makes investors feel they are getting better value by being able to purchase a larger quantity of tokens. This behavioral pattern has historically driven significant retail inflows into assets perceived as more affordable.
This appeal is not merely psychological. XRP is underpinned by a clear and functional use case: facilitating fast, low-cost cross-border payments. The XRP Ledger’s ability to settle international transactions in seconds for a fraction of a penny provides a fundamental strength that distinguishes it from purely speculative assets. This utility, aimed at disrupting the enormous traditional finance market, offers a layer of long-term credibility. The broad distribution of XRP across millions of digital wallets highlights its widespread accessibility and deep retail base, a demographic that could be instrumental in fueling its next major run.
A Prudent Perspective
Despite the compelling bullish case, it is essential to approach these forecasts with a clear understanding of the risks involved. The cryptocurrency market is defined by its volatility, and price targets are speculative projections, not guarantees. XRP's path is still influenced by external factors, most notably the ongoing regulatory landscape, which could have a significant impact on its future.
Furthermore, the most optimistic scenarios for XRP are heavily reliant on Bitcoin maintaining its powerful upward trajectory. Any weakness in the flagship cryptocurrency would undoubtedly impact the entire altcoin market, including XRP. While the technical and fundamental outlook appears increasingly bright, a disciplined and well-researched approach remains the cornerstone of navigating this exciting but unpredictable market.
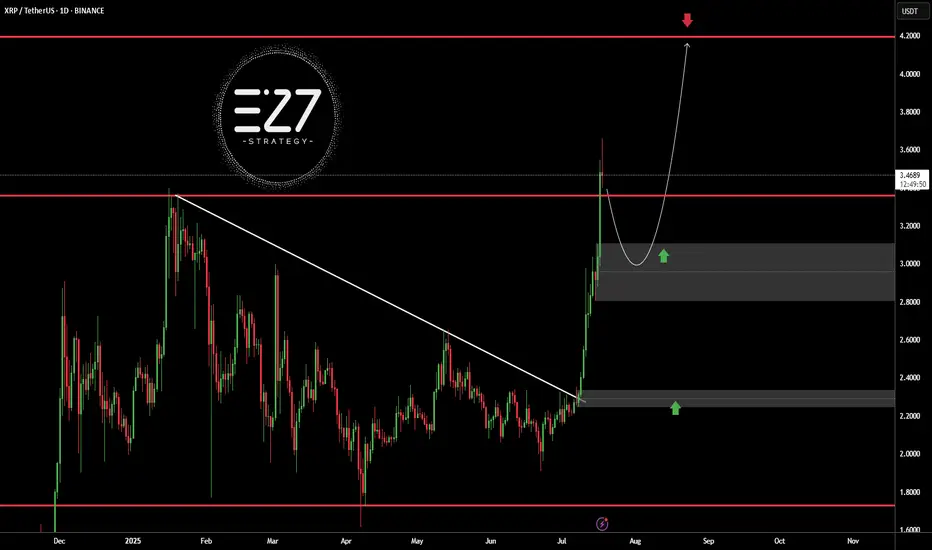
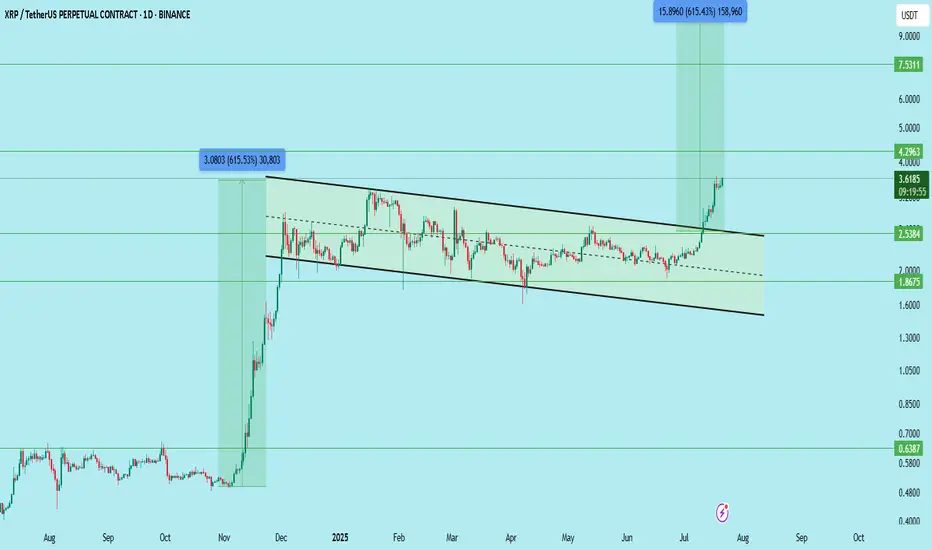
XRP Update | Long-Term Breakout In PlayCRYPTOCAP:XRP has successfully broken out of the descending channel and is currently approaching the key resistance zone at $4.29 — the first major long-term target shared earlier.
What’s next?
It’s now trading at a critical resistance, and a retest is highly likely. A clean pullback to the $3.51–$3.57 zone will offer the ideal entry opportunity for long-term positional traders.
Updated Trade Setup:
Entry: $3.51–$3.57 (wait for retest)
Stop Loss: Below $3.38
Support Zones: $2.53 / $3.51
Resistance Zones: $4.29 / $7.53 / $11.98 / $18.00
Targets:
TP1: $4.29 (nearly hit)
TP2: $7.53
TP3: $11.98
TP4: $18.00
This breakout structure remains highly bullish. Let price come to you — avoid chasing the move. A retest entry could offer better RR for the next leg.
DYOR | Not Financial Advice
Bullish XRP Setup: $7, $9, and $13 Main Price TargetsHello✌
Let’s analyze Ripple’s upcoming price potential 📈.
BINANCE:XRPUSDT , I expect a long-term upward bullish trend.
There are three main targets in this analysis: $7, $9, and a final target of $13, which could be reached within 2 to 6 years.
The price may form parallel channels at times, which are shown on the chart. I also expect the current bullish channel to remain valid and continue upward. Additionally, there is a strong trendline guiding the movement.
✨We put love into every post!
Your support inspires us 💛 Drop a comment we’d love to hear from you! Thanks , Mad Whale🐋
🐋Many of the points and levels shown on the chart are based on personal experience, feeling, and over 7 years of research and daily study of crypto charts.
Some of the lines, channels, and price zones are drawn to make the chart easier to understand and to help imagine possible future price movements.
I’ve also included one very big drop in price even bigger than the others because in the crypto market, it’s common for prices to suddenly fall hard and push out small investors and traders with positions.
The targets on the chart are not guaranteed; they might be reached, or they might not.📚
📜Please make sure to do your own research before investing, and review the disclaimer provided at the end of each post.

XRP - Probable Trade!!! Very Yet!This trade is very probable and very to your extend beyond your imagination! Wait and watch!
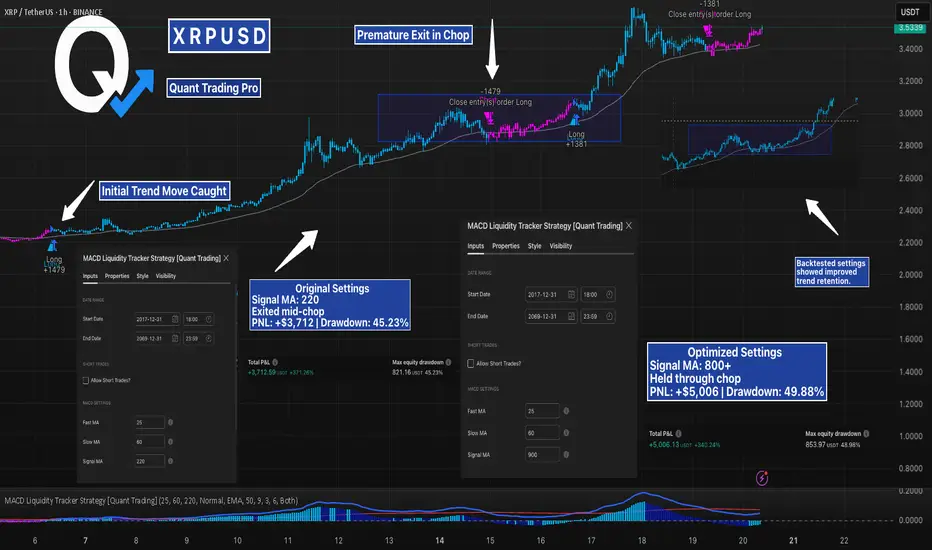
XRP- Caught The Move. Then Got Chopped. How Backtesting Fixed ItXRP printed a strong trend — and the strategy caught it early. But partway through the move, price stalled in a tight range and the position was exited early.
That’s where backtesting and tuning come in.
In the first test, the strategy used default settings with Signal MA = 220. It entered cleanly, but exited mid-chop.
After adjusting the Signal MA to over 800, the strategy started holding through the noise and stayed in the move — with higher PNL and a slightly increased drawdown. Ended on 900.
This is the power of understanding how your system behaves in different conditions.
By adjusting signal sensitivity, you can reduce premature exits without chasing every move. The goal isn’t perfection — it’s better retention of valid trends without overfitting.
This example shows how simple tweaks, backed by clear test results, can make a measurable difference.
—
#XRPUSD #Backtesting #MACDStrategy #LiquidityTracker #CryptoTrading #TradingView #QuantTradingPro #StrategyOptimization #TradingSystems
XRP | Great TP Zone is HERE for HODLERSXRP has seen a 62% increase since breaking out above the moving averages in the daily timeframe.
The previous time XRP broke out above the moving averages in the daily, the price increased around 440%:
However, with XRP being the ultimate pumper and dumper, I'll take my chances at 62%! Because this bull run has been anything but ordinary and it's best to avoid being too greedy. The price of XRP falls extremely quick, just as quick as it rises.. ( Maybe not overnight but you know, it has happened before ).
If you're one of few who bought around $1, or heck even later at $2, this is a solid increase and it should not be taken for granted. XRP has gone LONG periods without increases and often stayed behind making new ATH's when other cycles have come and gone (twice), as other alts make new ATH's. Over the years, I've made extensive posts on XRP; documented its use case, followed the SEC case closely and yet, XRP still remains one of the strangest and most unpredictable alts I have ever tried to analyze. Long term followers will remember that a I was bullish in 2018/2019 and then slowly became uninterested up until the point of negative towards XRP for probably the past 3-4 years.
This is not only because of the lagging price compared to other older alts that soared like ETH and even Litecoin. Sure we did not see the growth and the taco stand ( who remembers ) just kept dumping on the market... But the entire "scandal" of the actors marketing/pimping, the dumping behind the scenes by executives to fund Ripple in early days, the lawsuit etc. was just such a colossal mess that I even wonder how XRP is still alive and kicking today.
All I'm saying is that this is truly a spectacular moment - it's hard to even imagine cripple crossed $3 after years and years of waiting on XRP when other alts x1000% and beyond. Point being - Don't miss it! Trading only works when you take profits.
________________________
BINANCE:XRPUSDT