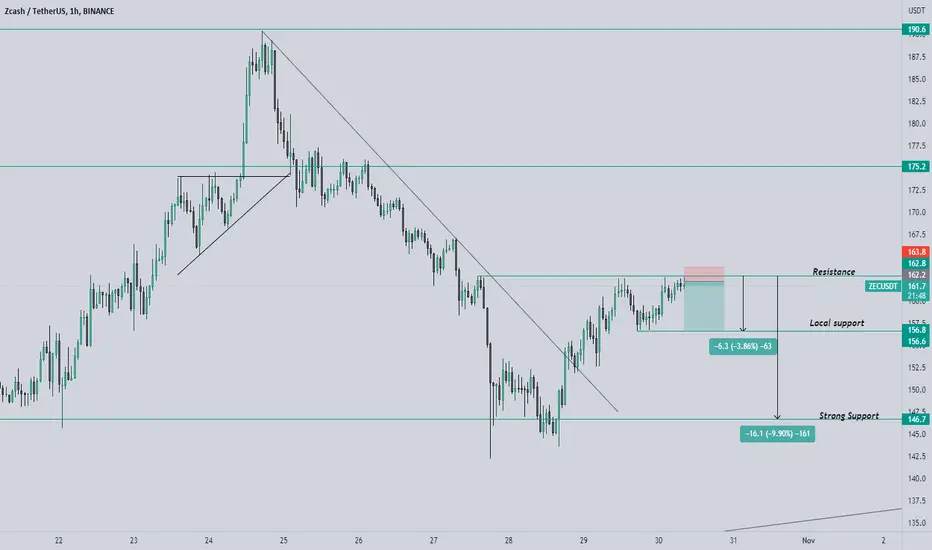
🔥ZEC is a short short with a short stop from the resistance zon#ZEC/USD
🔥ZEC is a short short with a short stop from the resistance zone.
Zec
$ZEC Looking extremely deliciousZECUSDT is looking extremely delicious on the daily chart, resistance has been tested and time to hit some green target lines


ZCASH PRO ANALYSIS...!Hello everybody...
This is my own analysis of Zcash. The targets are identified based on the RSI over-bought summits. So, be careful and don't forget to save your profit...
-Thanks-

ZEC On the way to 160$Hi every one
ZCASH / TETHERUS
ZCASH has been in a Inverse head and shoulder pattern. The Break out has happened recently. so we can say It is safe to open a Deal on ZEC! The Expected Movement for ZEC is as much as the measured Price movement(The length between the top of the head and the Neckline) which means the price can Increase up to 160$!
Summery:
-ZEC has broken a Inverse Head and Shoulder
-It can Increase up to 160$.
💎Traders, if you liked this idea or have your opinion on it, write in the comments, We will be glad.
Things can change...
The markets are always changing and even with all these signals, the market changes tend to be strong and fast!!
Thank you for seeing idea .
Have a nice day and Good luck

ZcashHi everyone,
This is my description:
Purple Lines: Support & Resistance (for a week) “VERY IMPORTANT”
Blue Lines: Support & Resistance (for a day) “IMPORTANT”
Orange Lines: Support & Resistance (for a 4H)
Thanks for your attention.

ZEC USDTThe ZEC currency came out of its smaller channel and made a good profit, and now it has come out of its larger channel and can grow well after the pullback. You can enter one step here and one step after pullback

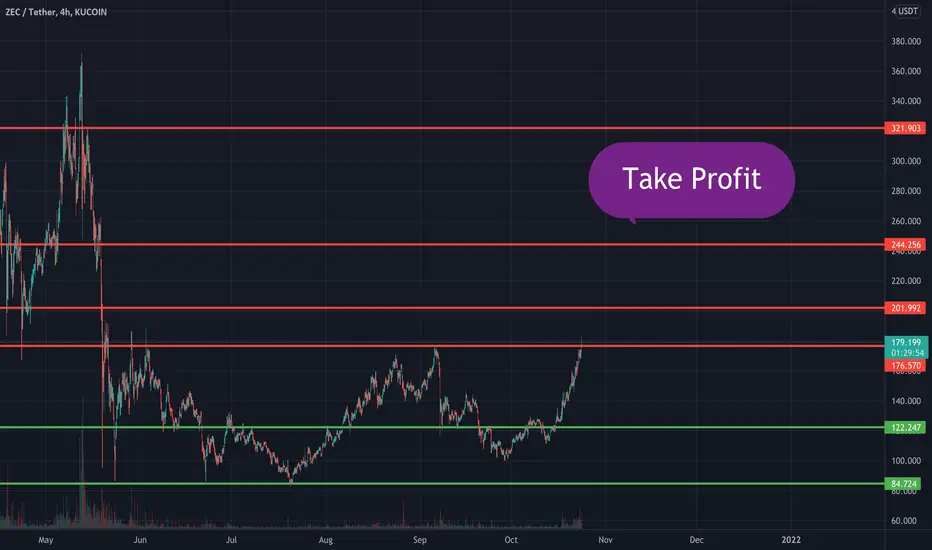
ZEC Cycle Top is the TP SignalZEC Cycle Top == Market Cycle Top
This essentially happened back in May. Of course it's the same story with most coins out there.
But if ZEC doesn't crash during the "Take Profit" bubble then there could be much higher highs.
Zcash Leaves No Room For Doubts...Very clear what is happening here with ZECBTC when we examine January of this year:
Zcash tends to move strongly after a low is finally hit.
Since the 12-Oct. we are witnessing strong bullish action; with 45% growth so far.
The trading volume is strong and growing towards the bulls and prices are moving above EMA100.
The main 2 bullish scenarios are depicted on the chart.
Targets and support levels are also available.
Enjoy.
Namaste.

ZECUSDT - Next Target?ZECUSDT(1D Chart) Technical analysis
ZECUSDT(1D Chart) Currently trading at $172
Buy level :Above $175(Buy after Breakout)
Stop loss: Below $1136
TP1: $206
TP2: $253
TP3: $306
TP4: $372
Max Leverage 2x
Always keep Stop loss
Follow Our Tradingview Account for More Technical Analysis Updates, | Like, Share and Comment Your thoughts.

Z CASH $1,000We are about to go crazy on ZEC
1 ZEC now = $1,000 later
TARGET $1,000
SL: none, seriously no stoploss

ZECUSDTHi everyone,
This is my description:
Purple Lines: Support & Resistance (for a week) “VERY IMPORTANT”
Blue Lines: Support & Resistance (for a day) “IMPORTANT”
Orange Lines: Support & Resistance (for a 4H)
Thanks for your attention.

ZECUSDTHello Crypto Lovers,
Mars Signals team wishes you high profits.
We are in a 4-hour time frame.
As you see, the price has been able to break its resistance line and move upwards. We expect the price to reach $137.
Warning: This is just a suggestion and we do not guarantee profits. We advise you analyze the chart before opening any position.
Wish you luck

ZECUSDT Technical Analysis⏳ Spot
💎 ZECUSDT has formed a symmetrical triangle. it has got several rejections from the resistance line and after the last rejection it is expected to go to the pullback zone. It is expected that it starts it's Bullish move from the Pullback zone
🌐 Tradingview
🏁 Short & Medium Term
💵 Invest Only 5% of your Portfolio
🎳 Entry at Market or at 117.0
☕️ TP1 129.0
🍺 TP2 135.0
🍻 TP3 145.0
🍾 TP4 155.0
🍷 TP5 170.0
🍸 TP6 _____
🍹 TP7 _____
🎁 TP8 _____
🚫 SL 110.0
Good Luck 🎲
Check the Links in Description and If you LIKE this analysis, Please support our page and Ideas by hitting the LIKE 👍 button. ❤️ Your Support is really appreciated! ❤️
Traders, if you have your own opinion about it, please write your own in the comment box. We will be glad for this.
Feel free to request any pair/instrument analysis or ask any questions in the comment section below.
We will have more FREE forecasts in TradingView soon
Have a Profitable Day

imagine ZCASH upside when it gets a decent run above 50 rsizcash seems to have always pumped wit the rsi low.
the last push up to 300+ popped momentarily above 50 before dropping back below and forming a mild bullish divergence on the monthly
the orange trend line heading up suggest this is just the start of a big run, and breaking up from the wedge would confirm that.
price currently stagnates on the 20ma mid bband, is it privacy coins time?

Zec slowly risingA long term trade could be taken on ZEC/USDT with huge 18 R/R
Trade could be triggered any day soon

ZECUSDTHi everyone,
This is my description:
Blue Lines: Resistance (Target for sell)
Orange Lines: Support (Step for buy)
Pink Rectangles: PRZ
Thanks for your attention.

🆓Zcash (ZEC) Oct-9 #ZEC $ZECZEC is heading to 140$, 160$ and 200$ zones in this October. But if it loses this 120$ zone, we will consider buying it back at 105$ and 95$ zones
📈RED PLAN
♻️Condition : If 1-Day closes ABOVE 120$ zone
🔴Buy : 120
🔴Sell : 140 - 160 - 200
📉BLUE PLAN
♻️Condition : If 1-Day closes BELOW 120$ zone
🔵Sell : 120
🔵Buy : 105 - 95
❓Details
🚫Stoploss for Long : 10%
🚫Stoploss for Short : 5%
📈Red Arrow : Main Direction as RED PLAN
📉Blue Arrow : Back-Up Direction as BLUE PLAN
🟩Green zone : Support zone as BUY section
🟥Red zone : Resistance zone as SELL section
🅰️A : The Close price of 1-day candlestick is Above the zone
🅱️B : The Close price of 1-day candlestick is Below the zone

ZECUSDTHi everyone,
This is my description:
Blue Lines: Resistance (Target for sell)
Orange Lines: Support (Step for buy)
Pink Rectangles: PRZ
Thanks for your attention.

preparing for liftoff2022 will be the year of ZCash if 2021 doesn't trick us first. Ever wanted to feel like you bought the absolute bottom of a mega super x1000 run? ya me too, LOL

ZECUSDTHi everyone,
This is my description:
Blue Lines: Resistance (Target for sell)
Orange Lines: Support (Step for buy)
Pink Rectangle: PRZ
Thanks for your attention.

ZECUSD Entry Price 125.03 Target Price 129.74ZECUSD (ZCASH)
High Price 126.44
Open Price 125.01
Close Price 125.03
EMA 10 Close Price 124.20
--------------------------------------
Low Price 123.80
EMA 20 Price 122.05
--------------------------------------
Set Your Stop Loss Below 123.80
Set Your Stop Loss Below 122.05
---------------------------------------
Enter Two Trades. Two Entries with the same target with two different stop losses.

