ZEC Sell/Short Setup (1H)Use this setup as a scalp, not a swing trade.
Since price has reacted to a major supply zone and has formed a CP pattern below the supply, a drop is expected.
Make sure to move your stop to breakeven at the first target.
The targets are clearly marked on the chart.
For risk management, please don't forget stop loss and capital management
When we reach the first target, save some profit and then change the stop to entry
Comment if you have any questions
Thank You
ZECBTC

ZEC Sell/Short Signal (1H)Given that price has reached a higher-timeframe supply zone and is currently ranging on the 1-hour timeframe, we can look for Sell/Short positions as price approaches the supply area.
Make sure to take partial profits at the first target, then move the stop-loss to breakeven.
Do not enter the position without capital management and stop setting
Comment if you have any questions
thank you

Zcash Whales Defy Price Dip Below $400, Holdings Surge By 21%Zcash trades near $396 at the time of writing, sitting below the $403 resistance. The Parabolic SAR remains above the candlesticks, indicating the downtrend is still active. This signal reflects lingering bearish pressure despite improving on-chain and momentum indicators.
Whale accumulation and strengthening momentum could counter the technical weakness. These factors may push ZEC toward the $442 resistance. Converting this level into support would be critical. A sustained breakout could open the path toward $500, restoring broader bullish confidence.
Risks remain if momentum fails to materialize or whale behavior shifts. Continued weakness could drag ZEC toward the $340 support. A deeper sell-off may extend losses to $300 or even $260. Such a move would invalidate the bullish thesis and confirm extended downside pressure.

ZEC Analysis (4H)The bullish and upward structure of ZEC appears to be completed, and from the point where we placed the red arrow on the chart, its bearish phase seems to have begun.
It now looks like we are in wave B of the bearish phase, and it is expected to drop from the red zone toward the targets marked on the chart.
The targets are clearly indicated on the chart.
A daily candle closing above the invalidation level will invalidate this analysis.
For risk management, please don't forget stop loss and capital management
When we reach the first target, save some profit and then change the stop to entry
Comment if you have any questions
Thank You

#ZEC/USDT – Potential Long Setup at Key Fibonacci Level#ZEC
The price is moving in a descending channel on the 1-hour timeframe. It has reached the lower boundary and is heading towards breaking above it, with a retest of the upper boundary expected.
We have a downtrend on the RSI indicator, which has reached near the lower boundary, and an upward rebound is expected.
There is a key support zone in green at 296. The price has bounced from this zone multiple times and is expected to bounce again.
We have a trend towards stability above the 100-period moving average, as we are moving close to it, which supports the upward move.
Entry price: 334
First target: 352
Second target: 386
Third target: 430
Don't forget a simple principle: money management.
Place your stop-loss below the support zone in green.
For any questions, please leave a comment.
Thank you.

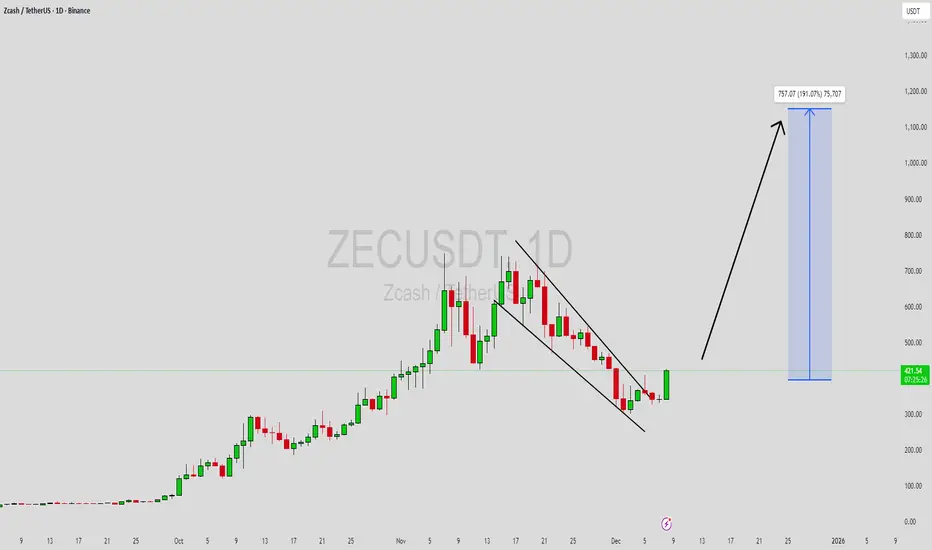
ZECUSDT Forming Falling WedgeZECUSDT is forming a clear falling wedge pattern, a classic bullish reversal signal that often indicates an upcoming breakout. The price has been consolidating within a narrowing range, suggesting that selling pressure is weakening while buyers are beginning to regain control. With consistent volume confirming accumulation at lower levels, the setup hints at a potential bullish breakout soon. The projected move could lead to an impressive gain of around 140% to 150% once the price breaks above the wedge resistance.
This falling wedge pattern is typically seen at the end of downtrends or corrective phases, and it represents a potential shift in market sentiment from bearish to bullish. Traders closely watching ZECUSDT are noting the strengthening momentum as it nears a breakout zone. The good trading volume adds confidence to this pattern, showing that market participants are positioning early in anticipation of a reversal.
Investors’ growing interest in ZECUSDT reflects rising confidence in the project’s long-term fundamentals and current technical strength. If the breakout confirms with sustained volume, this could mark the start of a fresh bullish leg. Traders might find this a valuable setup for medium-term gains, especially as the wedge pattern completes and buying momentum accelerates.
✅ Show your support by hitting the like button and
✅ Leaving a comment below! (What is your opinion about this Coin?)
Your feedback and engagement keep me inspired to share more insightful market analysis with you!
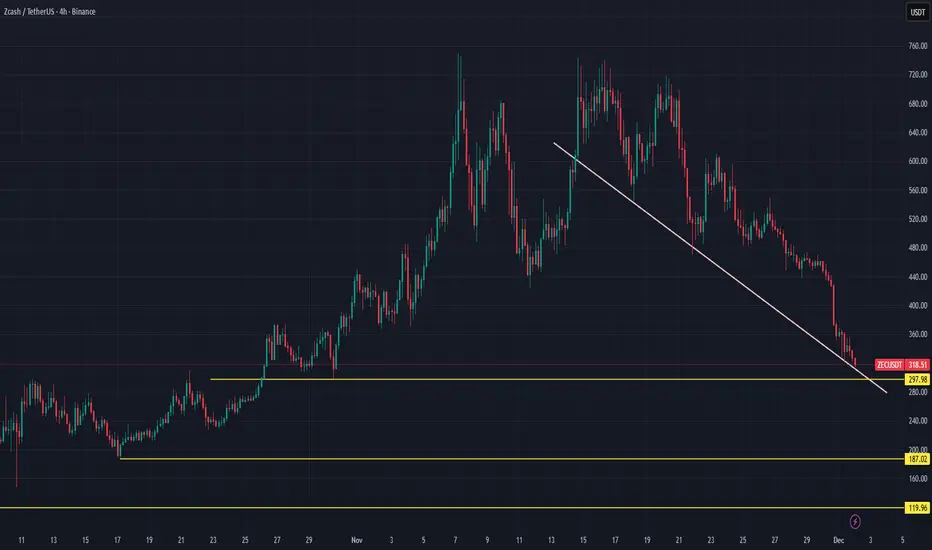
ZEC is dancing on thin support lineZec was not able to pass its yearly ATH level (750), with the market worries and privacy hype losing power dropped down below upper trendline and came to the downward trendline support, below the support price can retrace till to 220-230 usdt level. On the upside resistance zone will be around 400-410 level
ZECUSDT Forming Falling WedgeZECUSDT is forming a clear falling wedge pattern, a classic bullish reversal signal that often indicates an upcoming breakout. The price has been consolidating within a narrowing range, suggesting that selling pressure is weakening while buyers are beginning to regain control. With consistent volume confirming accumulation at lower levels, the setup hints at a potential bullish breakout soon. The projected move could lead to an impressive gain of around 90% to 100% once the price breaks above the wedge resistance.
This falling wedge pattern is typically seen at the end of downtrends or corrective phases, and it represents a potential shift in market sentiment from bearish to bullish. Traders closely watching ZECUSDT are noting the strengthening momentum as it nears a breakout zone. The good trading volume adds confidence to this pattern, showing that market participants are positioning early in anticipation of a reversal.
Investors’ growing interest in ZECUSDT reflects rising confidence in the project’s long-term fundamentals and current technical strength. If the breakout confirms with sustained volume, this could mark the start of a fresh bullish leg. Traders might find this a valuable setup for medium-term gains, especially as the wedge pattern completes and buying momentum accelerates.
✅ Show your support by hitting the like button and
✅ Leaving a comment below! (What is your opinion about this Coin?)
Your feedback and engagement keep me inspired to share more insightful market analysis with you!

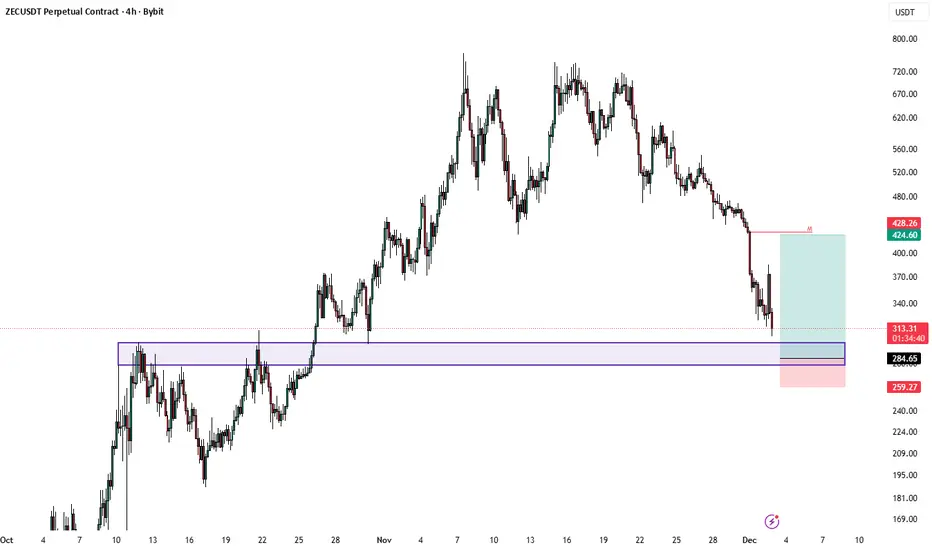
$ZEC planWill try a long here. I have set my bids in the purple box. Around $295-280 with SL $259. I think the previous high could act as a support.
ZEC Price Crashes 43% In A Week; Evokes This Critical QuestionZEC previously posted a massive 1,442% rally during the peak of the privacy-token narrative. That momentum faded at the start of November, and the altcoin has since crashed 56% from its highs.
A staggering 43% of that loss occurred in just the last week, pushing ZEC down to $323. If this trend continues, Zcash is likely to break below the $300 support level and fall toward $260, or even $204, erasing more of its earlier gains.
However, Arthur Hayes believes crypto markets follow distinct yearly narratives. According to him, 2025 revolved around AI-linked tokens and the rapid expansion of stablecoins, but 2026 will center on privacy. He says this pivot could spark renewed interest in privacy-driven cryptocurrencies and the underlying tech that supports them.
Thus if buyers return at these discounted levels, ZEC could attempt a bounce from the $344 area. A recovery toward $442 and eventually $520 would be needed to invalidate the current bearish outlook.

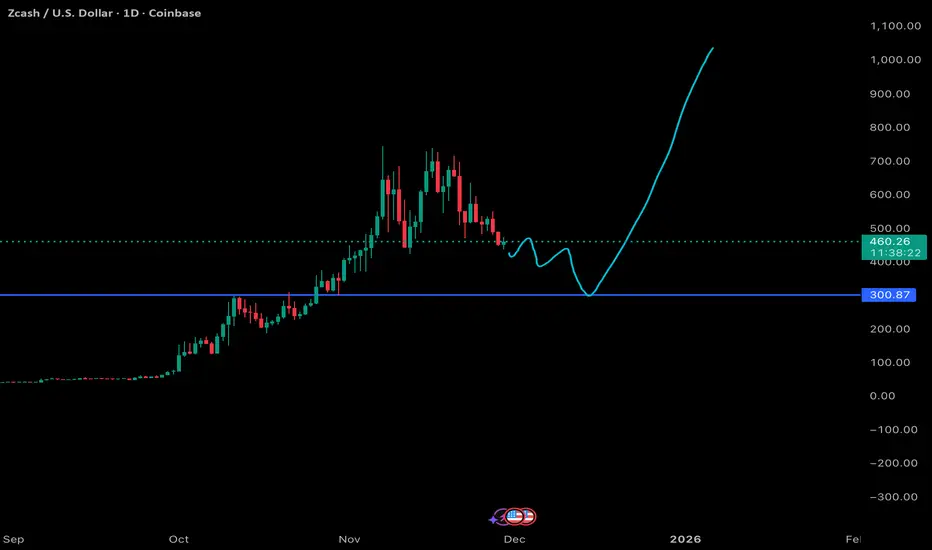
ZEC Update - My thoughts heading into Nov 29 2025 Weekend ZEC is grinding lower with momentum still favoring sellers. The structure is cleanly pointing toward the 300 zone, which lines up as the next high conviction support.
Until price tags that level, ZEC likely keeps lagging and chopping in a controlled bleed. A reaction or base is most probable only once that 300 level is tested, where a stronger bounce could finally develop.
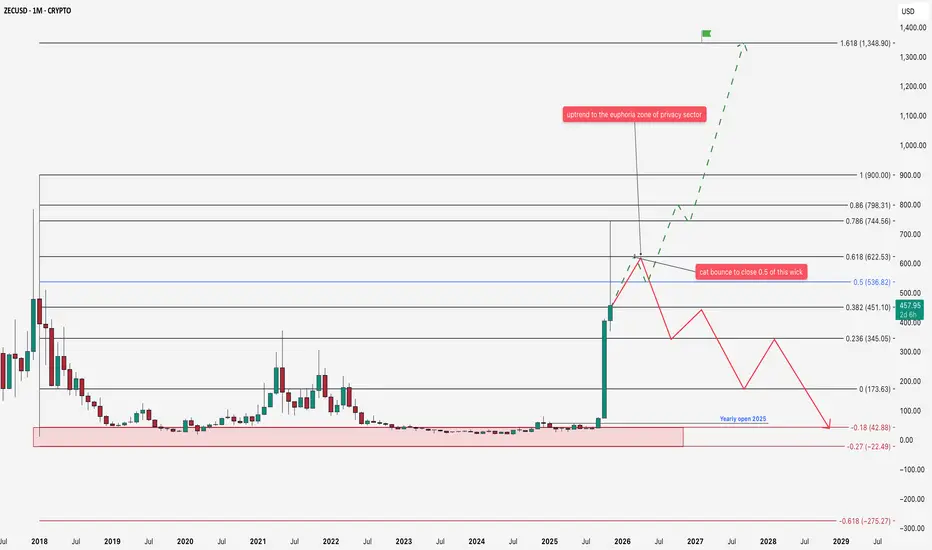
ZEC and point of decision As usual, retail investors and traders start hyping a trend only after the upward pump has already happened! Back in 2023, nobody gave a damn about CRYPTO:ZECUSD or privacy-sector tokens!
Now everyone's suddenly an expert, flooding charts with talk of insane potential and how this category's just getting started! But I think all these rumors are already baked into the price, like always!
The accumulation zone is marked down low—that zone has been, still is, and always will be the sweet spot for scooping up Zcash!
Right now, hitting exactly the 0.78 Fibonacci extension (yeah, this analysis is pretty basic), we're seeing a reaction, and it's totally normal after such a sharp rally!
Next up: a tricky decision zone! Even if Bitcoin dominance drops below 50%, no guarantee ZEC keeps climbing!
If it does push on and we hit that full-on euphoria phase in alts, I figure the target flagged here will mark the logical cycle top!
But if the pump's already done its thing and liquidity rotates to other sectors? Then we could see at least a retrace to wick out that 50% level before heading back down the long, painful road for the next 2-3 years straight to the accumulation zone again!
Thanks for support!
✅Disclaimer: Please be aware of the risks involved in trading. This idea was made for educational purposes only not for financial Investment Purposes.
FireHoseReel | ZEC: Multi-Timeframe Correction Overview🔥 Welcome FireHoseReel !
Let’s dive into the current ZEC structure.
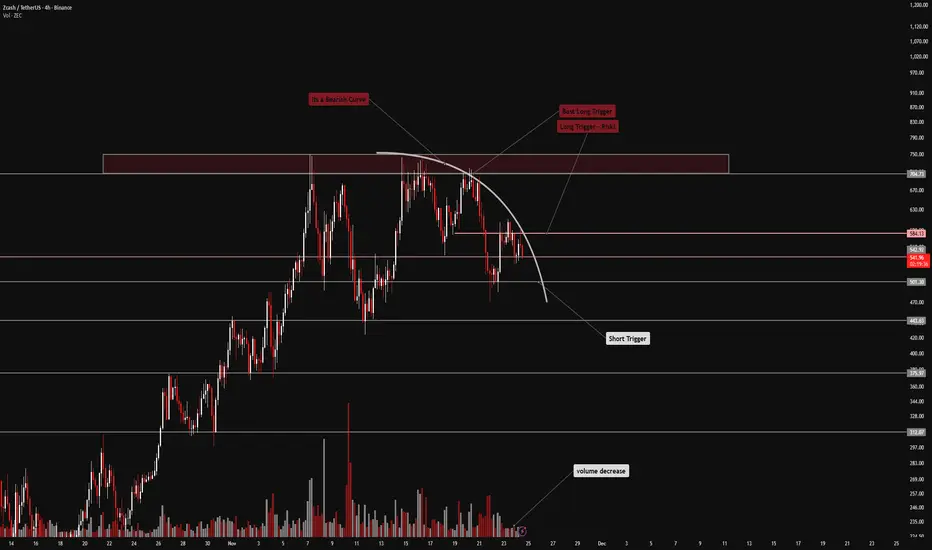
👀 ZEC – 4H Timeframe Analysis
Zcash has formed a strong rally recently and created a local ATH around $750. Since then, price has been consolidating below this level, moving through a multi-timeframe corrective range guided by a bearish curve-line.
Each time price touches this curve, it gets pushed downward—showing strong selling reaction.
We currently have three key triggers for potential ZEC trades, which can provide structured entry points.
📊 Volume Analysis
Volume must be monitored closely to understand the true behavior of ZEC.
During this corrective phase, volume has dropped significantly, indicating reduced participation.
This typically signals that a strong move is near, and once volume surges again, ZEC can give a clean entry opportunity.
🐋 A Different View On ZECBTC Looking at ZEC/BTC helps us better understand whale behavior and institutional positioning.
The ZECBTC chart has about 90% similarity with ZECUSDT.
The main differences appear in how the descending trendline and curve-line are drawn.
The triggers on ZECBTC match closely with the USDT pair, giving strong confirmation between both charts.
✍️ Trading Scenarios
Potential scenarios for ZEC are listed in the analysis and can be used depending on price reaction.
🔼 Long Scenario
A long setup becomes valid when:
Break of $584
• Strong increase in buy volume
• This activates a low-risk long trigger (~0.5% risk).
• Price can then move toward $705, where we expect reactions. If $705 breaks, we can add to • the position (position scaling) and follow ZEC toward a potential new ATH.
🛞 Risk Management & Disclaimer
Please remember to always use proper risk management and position sizing. Nothing in this analysis is financial advice. The market can change quickly, so always trade based on your own strategy, research, and risk tolerance. You are fully responsible for your own trades.
#ZECUSDT Privacy Narrative 2025-2026!ZEC is a privacy coin, and before we jump into numbers, you should ask yourself:
Why are privacy coins leading this cycle?
If you haven’t asked this yet, then it’s time to dive deeper —
because the narrative itself is part of the pump.
🔥 Main Question
Will ZEC hold momentum and continue bullish,
Or will $800 be the end of this wave?
Short Answer:
I see ZEC reaching $1,500 before or by Feb 2025.
We already caught it in the $4XX range days ago after making this TA:
🧭 Technical Foundation
This ZEC read is based on:
Elliott Wave (EW)
Gann Timing
Fibonacci Map
Harmonic structure confirmations
ZEC is currently at a crossroads, and the next monthly close will decide its fate.
🔑 What ZEC Needs for $1,500
1. Weekly Hold for now to keep things up:
$480 must hold weekly
No monthly close below this range
2. Bullish Monthly Close:
$560–$630 monthly close → excellent strength
Confirms buyers defending the trend
3. Breakout Key:
$800 → breakout
Opens runway to $1,200 → $1,500
New ATH window
Monthly close = the key factor for ZEC’s entire roadmap.
💼 Trade Plan (My Setup)
My Buy Levels:
$359.25
$419.13
$479.00 → now in profit
Stop-Loss:
$250
A monthly close below $ 230 invalidates the structure.
Risk Allocation:
3–5% max investment
Even with a 2× target, the risk remains controlled
→ You risk $1 to aim for $2+
Duration:
180+ days
Confidence Level: Medium
📌 Quick Recap
Key support: $480 weekly
Monthly range to watch: $560–$630
Breakout: $800 → $1,200 → $1,500
❌ Invalidation: Monthly below $260
🧩 Risk: 3–5%
⏱ Duration: 6 months+
⚓ Renzo Tip
“Privacy coins rise when the crowd starts whispering, smart captains listen before the storm arrives.”
Do your own research, as always.
Prayer
May Allah protect our trades from hidden risks, guide us toward clarity,
and give us wisdom to manage both fear and greed in every cycle.

ZEC - Is it over?Well, I think it's over for ZEC.
You see, it basically depends on whether ZEC can break that resistance line, the previous support of the whole pump.
It couldn't in it's first attempt.
I'm not sure there will be a second one. ZEC looks extremely overbought after a 22x run from $34 to $750.
Do you think it's over?

Privacy is Pricy Again — How Zcash Got Back in the GameA significant shift is recently observed in the cryptocurrency space, indicating a resurgence of interest in privacy. The sharp rise of Zcash (ZEC) — over 46% in the week following Galaxy Research's analysis — is a clear example of this trend, reflecting the market's demand for untraceable funds.
Zcash, after years on the sidelines, has returned to the forefront, confirming that the fundamental cypherpunk ideals of privacy hold high value in the modern financial system.
1. Technological Breakthroughs and Zcash’s Fundamental Growth
The Zcash rally is driven not only by speculation but also by major improvements that have made privacy both more accessible and more effective:
Removing Barriers (Zashi & NEAR Intents): The use of zk-SNARKs (zero-knowledge proofs) has become more user-friendly. Enhanced user experience (UX) in new wallets (like Zashi) and integration with cross-chain mechanisms like NEAR Intents have removed the technical friction associated with "shielding" transactions.
Strengthening Anonymity: The most crucial network metric for Zcash is the increase of shielded coins in the Orchard pool to over 30% of the total supply. The more coins are "hidden," the larger the anonymity set becomes, which mathematically increases the difficulty of tracing transactions.
Technological Edge: Zcash, unlike some competitors, offers quantum-resistant cryptography and a stronger privacy mechanism via zk-SNARKs, which allows transaction validation without revealing the amount, sender, or receiver.
2. Zcash as a Counter-Trend to Transparency
The sharp price increase of ZEC after years of stagnation reflects a broader market narrative:
Reaction to Institutionalization: Against the backdrop of Bitcoin's growing transparency and institutionalization (ETFs, centralized custodians), Zcash is positioning itself as “encrypted Bitcoin”—an asset that refocuses attention on the decentralized and private nature of crypto assets.
Regulatory Balance: Zcash utilizes optional privacy, which, according to analysts, may provide the project with greater regulatory resilience compared to coins where privacy is mandatory by default.
Repricing Privacy: The market has demonstrated that the demand for confidentiality has not disappeared. The Zcash rally has forced investors to re-evaluate all privacy-focused projects, proving that, amid increasing online surveillance, the ability to transact privately has once again become a highly valuable feature.
Summary: Zcash is back in the game, bolstered by strong technological improvements that have made its privacy accessible and effective. The sustained nature of this growth will depend on whether the project can convert this speculative momentum into stable growth in user and network activity.

ZECUSDTMy idea is bullish for BINANCE:ZECUSDT .
But keep 220$ support.
Next target is 290 - 370
Support: 220 - 1755 - 125 - 78
⚠️Please control risk management.

ZECUSDT - another leg up ahead!Keep your eyes on it — just like I told you before. Its target was $250–$280, and it actually hit $298 exactly. It then entered a temporary corrective phase, forming a falling wedge pattern.
This coin is an ideal pick for the current phase, and don’t worry — its bullish run isn’t over yet.
Next target: $360. I’ll keep posting updates about it regularly.
Best regards:
Ceciliones🎯

ZEC breakout of multi years resistance !ZEC / USDT
We noticed a Strong move this week
Price broke multi-years resistance line (2024/2022/2020) which is a huge breakout for this coin !
Simple thing , Holding above line = bullish
Invalidation: candle close below it

ZEC peakedZcash had a very good run but all good times come to an end.
It is breaking down. I dont want to be a buyer here or even higher.
All Info in the Chart.
No trading advice - my opinion

#ZECUSDT - Another leg up is aheadWe all saw a massive bullish in zec in previous days out of 260% instant bullish... and now it's in consolidation
it shows a symmetrical triangle pattern in hourly chart with 2 attempts of breakout ... third one must be work
the next station at ( 250 - 280$)
best Regards:
Ceciliones🎯

#ZEC/USDT Breakout Confirmed - Bullish Rally Loading!#ZEC
The price is moving within a descending channel on the 1-hour frame, adhering well to it, and is heading for a strong breakout and retest.
We have a bearish trend on the RSI indicator that is about to be broken and retested, which supports the upward breakout.
There is a major support area in green at 48.26, representing a strong support point.
For inquiries, please leave a comment.
We are in a consolidation trend above the 100 Moving Average.
Entry price: 52.70
First target: 53.70
Second target: 54.90
Third target: 56.85
Don't forget a simple matter: capital management.
When you reach the first target, save some money and then change your stop-loss order to an entry order.
For inquiries, please leave a comment.
Thank you.

XMR still in long term uptrend against DASH and ZECEven though XMR has shown short-term weakness against some coins in the privacy vertical they still have a way to go before they can challenge XMR's long-established upward channel against them.
I expect oscillation along the channel and would be surprised if they venture into the blue bands. Provided no fundamental change takes place any venture into the blue bands above or below should present a trading opportunity.
