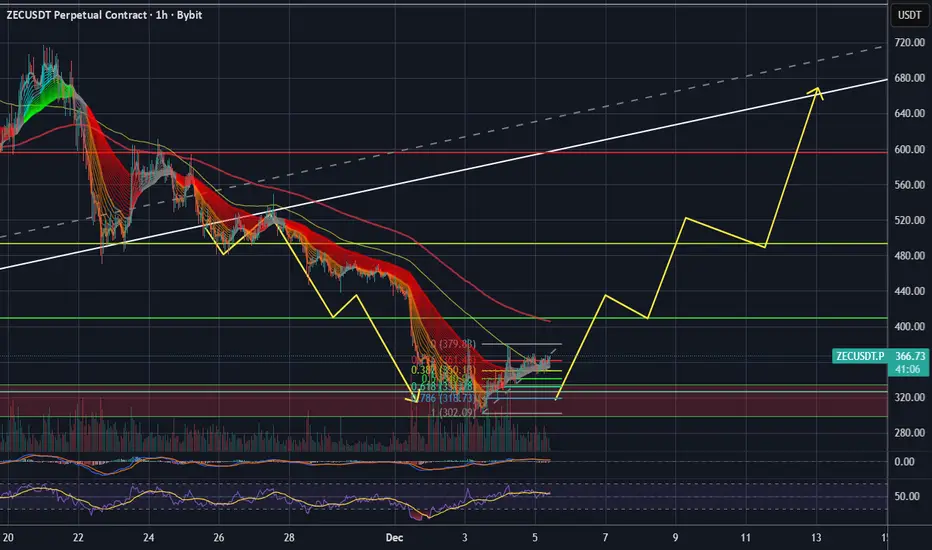
ZEC Sell/Short Setup (1H)Use this setup as a scalp, not a swing trade.
Since price has reacted to a major supply zone and has formed a CP pattern below the supply, a drop is expected.
Make sure to move your stop to breakeven at the first target.
The targets are clearly marked on the chart.
For risk management, please don't forget stop loss and capital management
When we reach the first target, save some profit and then change the stop to entry
Comment if you have any questions
Thank You
ZECUSD

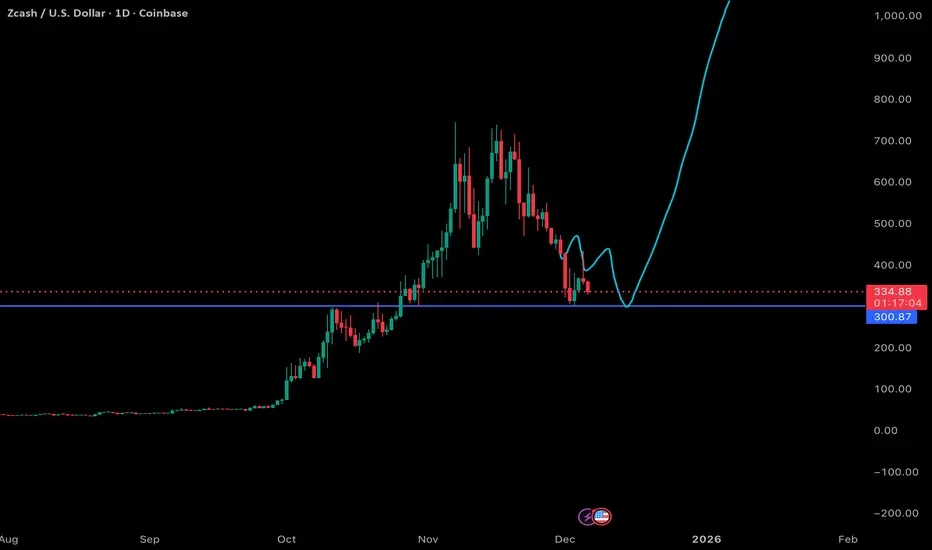
ZEC Update: Back into this uptrend zone ZEC Update: My prior downside thesis is now invalidated. ZEC has pushed back into the former rising channel and is showing acceptance inside the uptrend zone, which forces a reassessment of structure. The breakdown attempt failed, and instead of follow-through to the downside, price reclaimed key levels and held, shifting the short-term bias back to the upside.
Structurally, reclaiming the channel is important. Failed breakdowns often act as fuel in the opposite direction, especially when price can hold above the lower channel boundary and build higher lows. As long as ZEC remains inside this structure, the move off the ~300 region looks less like a dead cat bounce and more like a continuation attempt.
That said, this is still a reclaim phase, not confirmation of a full trend extension yet. The mid-to-upper channel and prior resistance around the mid-400s will be key areas to watch for acceptance versus rejection. Strong continuation would require follow-through and sustained closes inside the channel, while a loss of the lower boundary would quickly put the downside back in play.
For now, I’m respecting the invalidation and adjusting accordingly. Bias shifts bullish while price holds this uptrend structure, with risk clearly defined against the lower channel support. This is a good reminder to stay flexible and let price lead, not prior expectations.

ZEC minor pull back in playZEC had a nice run up from 18 December's $383 to today's $457, and I expect a cup and handle to form, with the most likely retrace to 426.50 followed by potential wicks or pressure at $417, and $412.

ZEC Update: Relief pump taking place, weary of further breakdownZEC is seeing a relief pump exactly as anticipated by the projected path (yellow), following the prior breakdown from the rising channel. This bounce so far looks reactive rather than impulsive, driven more by short-term positioning and broader market relief than any meaningful shift in structure. The key question now is whether price can reclaim and hold back inside the former channel.
At this stage, I remain skeptical. While price has pushed back toward the lower channel boundary, this area is still acting as resistance rather than support. Failed breakdowns typically require a strong, decisive reclaim with follow-through, and so far this move lacks the momentum and volume profile I’d want to see to confirm acceptance back inside the channel. As long as ZEC remains below that structure, this bounce should be treated as corrective.
Structurally, the broader picture still favors downside continuation. The rising channel itself formed after a sharp selloff, making it a counter-trend consolidation rather than a base. Breaking down from that pattern, even with a relief rally afterward, usually resolves with further downside once the bounce exhausts. In that context, this move looks more like a reset of short-term oversold conditions than the start of a sustained reversal.
Zooming out, this continues to align with the broader crypto environment, where markets are chopping and attempting relief rallies while higher timeframe trends work through distribution and leverage cleanup. In these phases, failed reclaims and lower highs are common, especially for higher beta assets like ZEC.
Unless price can cleanly reclaim the channel and hold above it, I expect this relief rally to fade and lead to another leg lower, with the ~300 area remaining the primary level of interest on the downside. That zone would represent a deeper structural test and likely determine whether ZEC can establish a more durable base or needs additional time to consolidate. For now, the bias remains cautious, treating strength as corrective until proven otherwise.

ZEC Sell/Short Signal (1H)Given that price has reached a higher-timeframe supply zone and is currently ranging on the 1-hour timeframe, we can look for Sell/Short positions as price approaches the supply area.
Make sure to take partial profits at the first target, then move the stop-loss to breakeven.
Do not enter the position without capital management and stop setting
Comment if you have any questions
thank you

Zcash Whales Defy Price Dip Below $400, Holdings Surge By 21%Zcash trades near $396 at the time of writing, sitting below the $403 resistance. The Parabolic SAR remains above the candlesticks, indicating the downtrend is still active. This signal reflects lingering bearish pressure despite improving on-chain and momentum indicators.
Whale accumulation and strengthening momentum could counter the technical weakness. These factors may push ZEC toward the $442 resistance. Converting this level into support would be critical. A sustained breakout could open the path toward $500, restoring broader bullish confidence.
Risks remain if momentum fails to materialize or whale behavior shifts. Continued weakness could drag ZEC toward the $340 support. A deeper sell-off may extend losses to $300 or even $260. Such a move would invalidate the bullish thesis and confirm extended downside pressure.

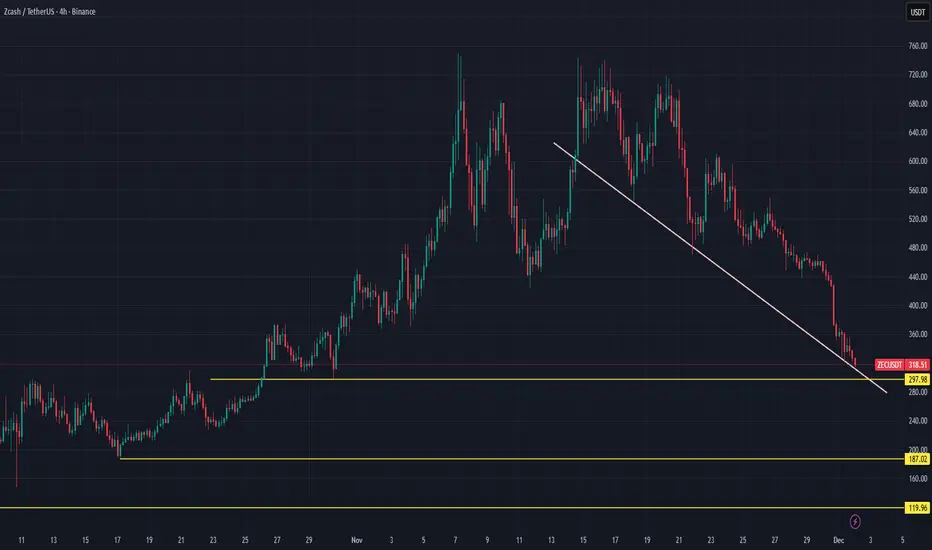
DeGRAM | ZECUSD fell below $400📊 Technical Analysis
● ZEC/USD trades within a broader descending structure, with price repeatedly rejected from the falling resistance line after forming a series of bearish continuation patterns (falling wedge breakdown, flags, and channels). Each rebound shows weaker momentum, confirming sellers’ control.
● The latest consolidation below the resistance line suggests distribution, with downside pressure building toward the horizontal support near 300–310. A clean breakdown would open room for continuation toward lower trendline support.
💡 Fundamental Analysis
● ZEC remains pressured by weak demand for privacy-focused coins and a risk-off tone across altcoins, keeping speculative flows limited.
✨ Summary
● Bearish structure intact. Key resistance: falling trendline near 420–440. Support target: 300–310, with further downside if support fails.
-------------------
Share your opinion in the comments and support the idea with a like. Thanks for your support!

ZEC Update: Appears to be breaking down The bounce off the ~300 support formed a rising channel, but structurally this looks like a corrective retracement within a broader down move rather than a new impulsive trend.
Price is now breaking below the lower channel boundary and failing to hold former support around the 390-400 area, which is starting to act as resistance.
Momentum is rolling over again, and the lack of follow-through on the bounce suggests weakening demand. With ZEC rolling over in sync with the broader market, the probability favors continuation back toward the 300-310 HTF support zone.
Unless price can quickly reclaim the channel and hold above it, this temporary uptrend appears complete. Key here is respecting the loss of structure and managing risk accordingly.

Crypto market review and potential trade opportunitiesAfter breaking those key macro support levels (check my October/November reviews), BTC has moved into a solid downtrend. Right now, any bounce we see should be first viewed as just a correction-phase retrace - not the start of a full-blown rally.
From the correction structure off October highs, a drop to the 75k–71k zone feels like the cleaner play. That would let us call the first wave of this correction done in classic 5-wave fashion from all-time highs.
BTC Chart:
Short-term, things are murkier - it all hinges on price action in the coming days.
• If we break convincingly above December highs around 94.6k, it opens the door to 102.5k–106k, with potential stretch to 112k.
• But if price slips below recent lows at 89k and 87.5k, that deeper correction to 75k–71k starts looking very likely.
For altcoin plays, short ZEC if it breaks below 445 (risk at 476, first profit targets 355–340) looks most compelling to me risk-reward wise
ZEC Chart:
Wishing everyone chill, sunny weekends ahead!

ZEC Update: Structure Still On Track Inside the Rising ChannelZEC continues to follow the projected plan nearly perfectly. Price is riding the ascending channel with clean reactions off the lower boundary and steady, controlled movement back toward the midline. This is exactly what you want to see in an early uptrend: higher lows, rising support, and consistent buyer interest on dips.
The latest pullback tapped the channel support and is already showing signs of holding. As long as ZEC maintains this structure, the overall bias remains bullish, and the path of least resistance continues upward.
This area is objectively one of the better spots to accumulate if the channel holds. The risk is well defined, the trend is forming, and the market is respecting the same technical rhythm over and over.
If the structure continues, ZEC can push toward the upper channel boundary and potentially break out into the next leg higher. All going to plan so far.

ZECUSD SMC Short Selling Hello traders,
ZEC has formed a corrective structure and as of right now, price is targeting the sell side liquidity zone.
This is a sell signal since we already broke structure to the down side on 1H timeframe.
Good Luck!
If you find this useful, consider a like and a comment

ZEC Analysis (4H)The bullish and upward structure of ZEC appears to be completed, and from the point where we placed the red arrow on the chart, its bearish phase seems to have begun.
It now looks like we are in wave B of the bearish phase, and it is expected to drop from the red zone toward the targets marked on the chart.
The targets are clearly indicated on the chart.
A daily candle closing above the invalidation level will invalidate this analysis.
For risk management, please don't forget stop loss and capital management
When we reach the first target, save some profit and then change the stop to entry
Comment if you have any questions
Thank You

ZEC Update: Early Uptrend Structure Taking ShapeZEC is starting to show the first clean signs of a new uptrend forming. After the sharp reversal off the 300 support, price has now begun to respect an ascending channel, consistently printing higher lows and pushing into higher highs inside the structure. This is exactly the type of behavior you want to see when a market transitions out of a capitulation leg and into a recovery phase.
The channel highlights the path ZEC is currently walking:
- steady grind upward
- controlled pullbacks that hold trend support
- higher lows forming in sequence
- buyers showing up reliably on each dip
Some chop inside this rising channel is completely expected. Early uptrends almost always develop with back-and-forth movement as the market tests support and flushes out weak hands. But the broader picture is shifting: momentum is pointing upward, structure is cleaner, and demand is starting to dominate.
If ZEC maintains this rhythm, the chart supports continuation into Q1. The setup suggests further upside as long as the lower boundary of the channel holds and we continue to see dips being bought with confidence.
Overall, ZEC looks constructive, trending, and quietly strengthening.

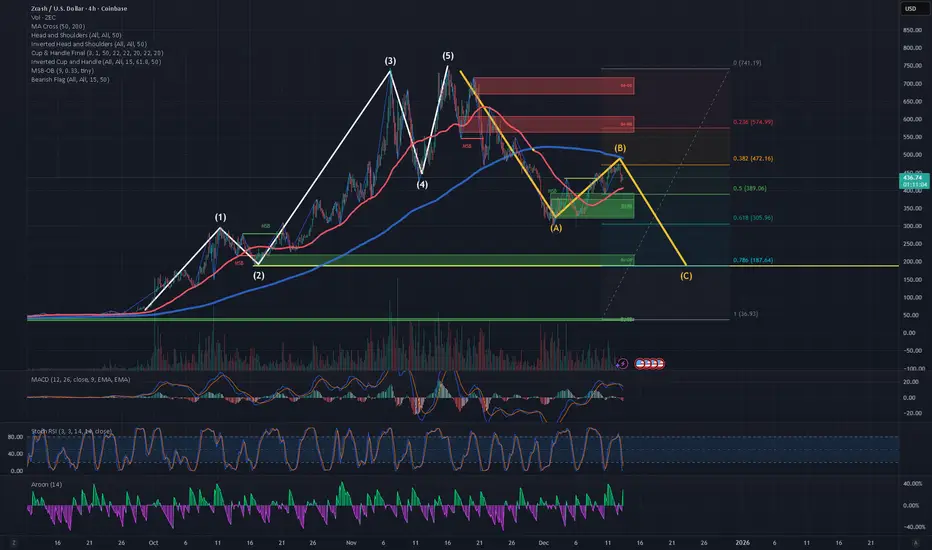
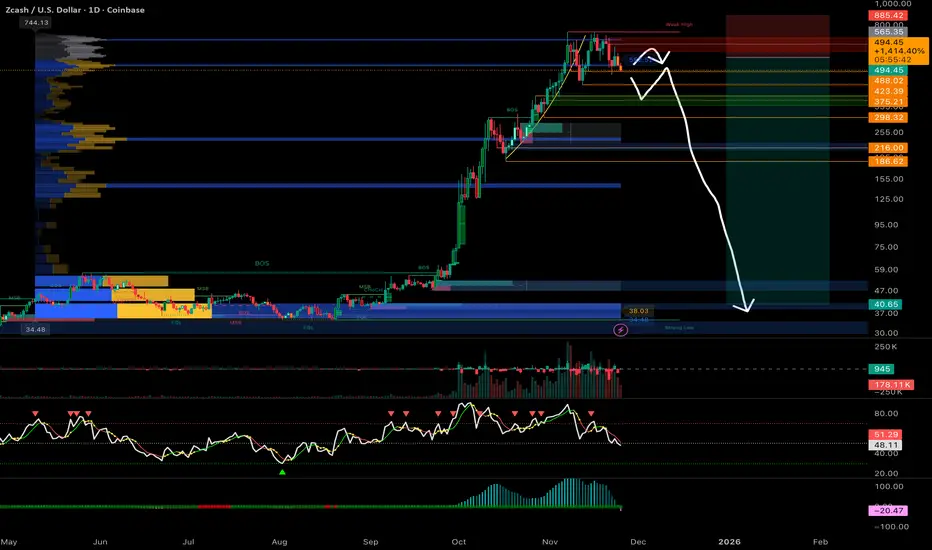
ZEC starting wave C of correctionOn the four-hour time frame, the Aroon indicator is positive and showing green because of the recent strong upward price movement. The Aroon is reflecting the impulsive advance that occurred between December 1st and December 12th, which I am interpreting as Wave B.
Prior to this, there was a clear five-wave impulsive move upward, and price now appears to be in a three-wave A–B–C corrective structure. I believe that Wave B of this corrective move is nearing completion, and that price is now beginning the decline associated with Wave C.
I believe the likelihood of further downard movement to fullfil wave C of the current three wave A-B-C structure is high, like 60 to70% based on the following reasons:
Four-hour and twelve-hour structure is corrective / weakening
Momentum (MACD) has rolled over
RSI is not resetting bullishly
Aroon suggests trend strength is fading, not expanding
Elliott interpretation of Wave B nearing completion is plausible
In theory, the chart says "down to $200", but the reality is that buyers have been very active, both humans and algorithims. It seems like any price below $400 is good buy for ZEC.
$200 represents a tail-risk scenario
$330 - 350 represents a behaviorally supported zone
In my view buyers will defend the $330 to 350 price point.
This analysis represents a probabilistic scenario rather than a guarantee, and invalidation would occur if price reclaims key resistance with expanding momentum.
This post is Not Financial Advice.
ZEC Ready for the Next Leg Up: Targets Raised to 540!Hey friends!
Even though my previous idea on ZCash was invalidated due to the breakdown of my invalidation zone, ZCash continues to demonstrate its strong intention to maintain the uptrend.
Moreover, the recent decline turned out to be a perfect bounce from the support zone, which confirms that we can expect ZEC to push even higher than my previous targets.
In my last post, I was confident we’d see ZCash at 480 (with a stretch target of 510), but I had some doubts about the higher one.
Now those doubts are completely gone — I’m convinced we’ll hit 510 and likely go beyond.
I’m raising my targets!📈
🎯Targets:
• Target 1: 480
• Target 2: 510
• Target 3: 540
❌Invalidation zone: 430
If price breaks below this level, the bullish scenario is invalidated.
⚠️Always trade with proper stop-losses and manage your risk!
What do you think — ready for the next leg up? 🚀

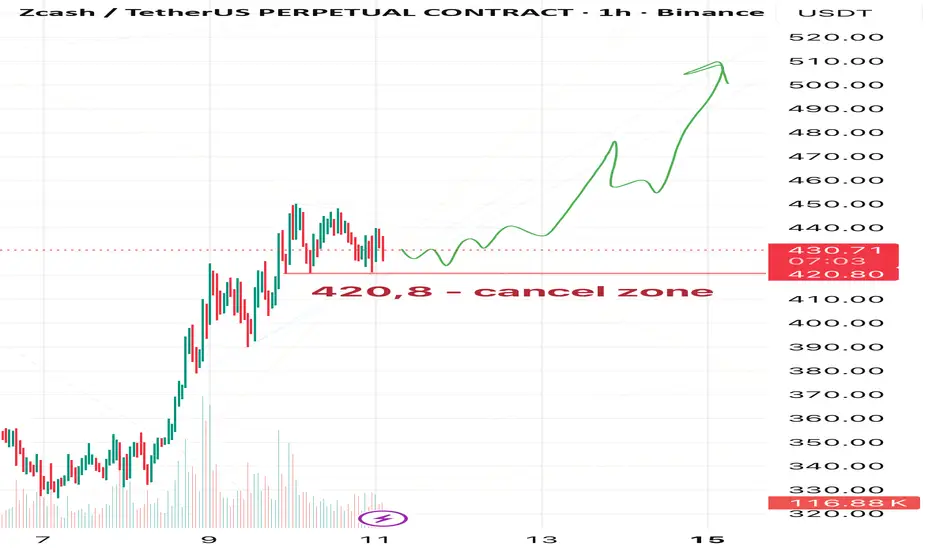
ZEC Breakout in Progress? Hey friends! How’s your trading going? Hope it’s going well and profitably! 🚀
Today I’m taking a look at Zcash (ZEC).
In my opinion, it looks pretty optimistic right now. I’m expecting upside from current levels.
🎯First target around 460,
🎯then 480,
and potentially 510 — but my main goal is 480 (I’ll keep 510 in parentheses for now).
❌Invalidation zone: 420.8 — if price touches this level, the plan gets canceled.
⚠️As always, this is just my personal view and not a trading signal. Trade responsibly, always use stops, and manage your risk!
Like, comment, and subscribe if you’d like to see more reviews on ZEC or other coins.
Let’s discuss in the comments — what do you think about ZEC? 📈
ZEC: Showing Strong Money FlowHey guys, ZEC is consolidating after an explosive +17.32% rally that took price from $332 to $425 in 24 hours. Now trading at $407.75, we're watching to see if bulls can digest these gains and push for another leg or if we're due for a retracement.
The technical setup leans bullish with strong trend confirmation. ADX at 69.4 signals legitimate momentum, MACD shows a bullish crossover, and price sits above all major EMAs (EMA20 $388, EMA50 $369, EMA200 $378). RSI at 69.1 approaches overbought but still has room, while MFI at 76.9 shows strong money flow despite current volume sitting below average.
Key levels to watch: immediate support at EMA20 $388.31 backed by BB middle band $384.02, with critical support at EMA50 $369.27. Resistance comes in at the 24h high $425.00, then BB upper band $432.08. The 52.6% upper wick signals rejection near $425, making that our key breakout level.
Trading setup: entries $400-$410 zone, stop below EMA20 at $388, targets $425/$445/$465 offering 2.1:1 to 4.2:1 risk/reward. The trend structure shows higher lows (bullish) but also lower highs (bearish), creating compression that typically resolves with a strong move. With 80% confidence and strong buy signals, this looks like a solid momentum continuation play if $388 support holds. How are you playing this move?

#ZEC/USDT – Potential Long Setup at Key Fibonacci Level#ZEC
The price is moving in a descending channel on the 1-hour timeframe. It has reached the lower boundary and is heading towards breaking above it, with a retest of the upper boundary expected.
We have a downtrend on the RSI indicator, which has reached near the lower boundary, and an upward rebound is expected.
There is a key support zone in green at 296. The price has bounced from this zone multiple times and is expected to bounce again.
We have a trend towards stability above the 100-period moving average, as we are moving close to it, which supports the upward move.
Entry price: 334
First target: 352
Second target: 386
Third target: 430
Don't forget a simple principle: money management.
Place your stop-loss below the support zone in green.
For any questions, please leave a comment.
Thank you.

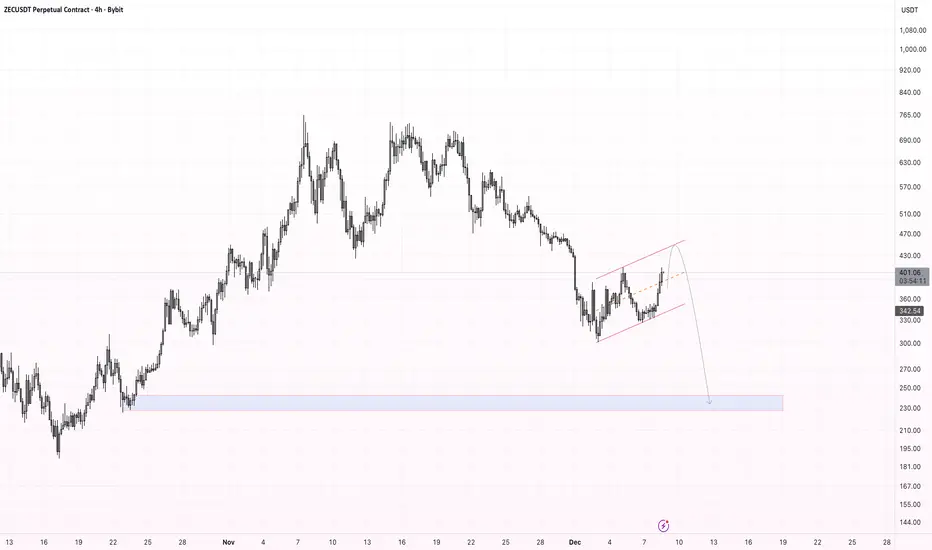
ZEC - forming a clear bearish flag on the 4H timeframe.After a strong impulsive sell-off, the price is consolidating inside an ascending channel, which typically acts as a continuation pattern in a downtrend.
There is still a chance that the market may retest the upper boundary of the flag, but as long as the structure remains intact, the bearish scenario is more likely to play out.
My main target for the next leg down is the $ 240–$230 demand zone, where previous liquidity and support levels are located.
Summary:
Structure: Bearish flag (continuation pattern)
Possible move: Retest of upper channel resistance before reversal
Bearish target: $240–$230
If the flag breaks downward with momentum, continuation of the larger downtrend becomes highly probable.
ZEC Update: The Expected Chop Is Finally Showing UpZEC Update: The Expected Chop Is Finally Showing Up
ZEC is now giving us the slower, choppier price action that I originally expected before the clean tag of 300. After that sharp bounce, price is rotating back down toward the same support zone, and this controlled drift is completely normal when a market is trying to build a base.
What I’m watching now is simple:
- ideally we form a higher low somewhere above the previous wick (around the 300 region)
- a bounce from roughly 310ish would signal strengthening structure
- then a push into a higher high would confirm the reversal forming on the daily chart
This kind of back-and-forth is exactly how an accumulation zone builds. The violent reaction at 300 showed strong demand, but a trending reversal usually takes time and multiple attempts. As long as ZEC keeps defending the 300 level and begins carving out higher lows, the structure continues to lean bullish.
Monitoring closely for the next leg of the reversal.
ZEC is dancing on thin support lineZec was not able to pass its yearly ATH level (750), with the market worries and privacy hype losing power dropped down below upper trendline and came to the downward trendline support, below the support price can retrace till to 220-230 usdt level. On the upside resistance zone will be around 400-410 level
Is ZEC in big trouble ? (part. 2)Update and continuation of my last idea.
A new dawn on that ZEC short im building
we are witnessing the biggest exhaustion since this run and more down should follow
note that, as I did for the last idea, I'll update often the post and my bias can change from bearish to bullish if ZEC give me the opportunity to do so
I opened the first short yesterday at 567 and wanted to wait the next days to post to be sure it was a good one, also was waiting for a last higher high but im not sure it will come. More positions should follow if bears stay presents.
Right now BTC is pumping with no volume (bearish) and ZEC can't follow (even more bearish), it was really tempting to publish that post
For now : if 470 fails we should just go to 380
Cheers
ZEC Golden Zone Reversal⚡ ZEC/USDT – The Golden 0.618 Reversal Zone?
BYBIT:ZECUSDT.P just tapped the 0.618 Fib around $326, right inside a strong support zone — classic golden pocket territory. 👀
The setup’s screaming potential reversal:
- RSI: Bullish divergence forming.
- MACD: Losing bearish momentum.
- EMA Ribbon: Flattening on 4H = trend shift brewing.
If bulls can reclaim $410–$490, I’m eyeing a push toward $650+.
Below $320, though — game over, next stop $207.
“Golden pocket bounces are where legends are born… or wrecked.” 💀➡️🚀