Check if it can rise above 422.80
Hello? Hello, traders.
If you "Follow" us, you'll always get the latest information quickly.
Have a great day.
-------------------------------------
(ZECUSDT 1D Chart)
After a sharp rise, the price is showing a sharp decline.
The key to a bullish turn is whether the price can rise above 422.80 and hold.
If the uptrend fails, we need to check for support around 216.60.
If it falls below 216.60, it's likely to take time to rise again.
Although the price is showing a short-term downtrend, falling below the M-Signal indicator on the 1D chart, it should be considered an ongoing uptrend because the M-Signal indicator on the 1D chart > M-Signal on the 1W chart > M-Signal on the 1M chart is arranged in this order.
Therefore, if the M-Signal indicator on the 1W chart declines, consider whether it can find support near the M-Signal indicator on the 1M chart and consider a response plan.
Therefore, the movement when the price falls to around 216.60 is crucial.
There is a possibility that the price will rise above the OBV High indicator, sustaining the price and indicating further upward movement.
However, since the OBV Low indicator is still above the OBV High indicator, a sideways movement seems likely.
-
Thank you for reading to the end.
We wish you successful trading.
--------------------------------------------------
ZECUSD

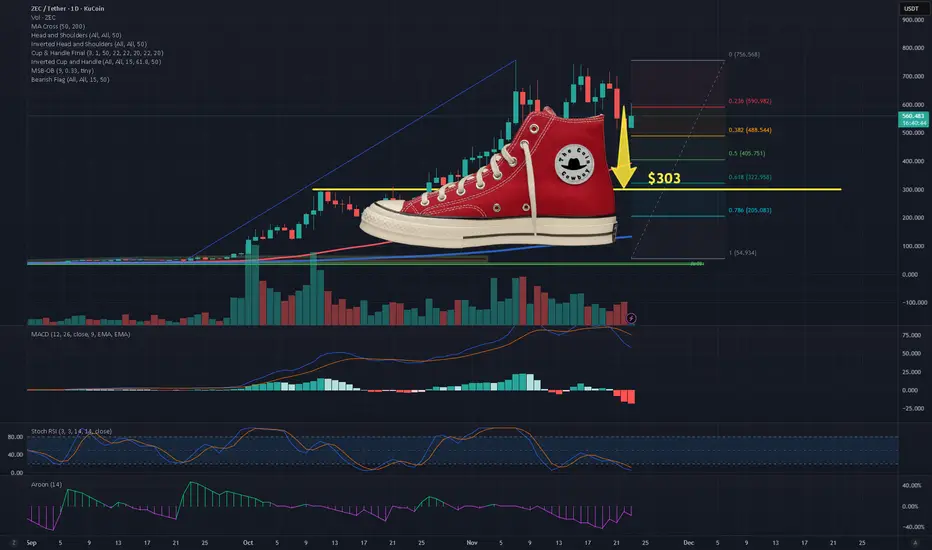
ZEC — The Shoe is About to DropMy 7 reasons why ZEC is about to drop to the heel of the shoe.
1. Price Rejected Hard at the 0.236 Fibonacci Level
The recent top at $752
Strong rejection at $582 (0.236 level)
Price tried to reclaim 0.236 multiple times and failed, which signals:
The bullish trend has lost strength and a deeper retracement is likely.
In most parabolic assets, 0.236 → 0.382 → 0.618 is the natural sequence when momentum dies.
ZEC already hit 0.382 around $476, and bounced weakly. Next logical magnet is 0.618 = $306.
2. The $548 Horizontal Level Was Lost (Key Breakdown)
$548 was:
former support
former demand zone
heavy volume node (visible on histogram)
Price closed below it, which makes it broken support → new resistance
Losing this floor confirms that buyers couldn’t defend the mid-range.
When a mid-range collapses, price usually moves to the next major liquidity pool, which here is:
👉 0.618 Fib at $306
👉 200MA cluster between $380–$400
3. Volume Profile Shows a Gap Below $480
Volume bars reveal high trading activity between $540–$620
A void / low-volume area between $470 → $380
Markets tend to fill low-volume gaps quickly because:
There is little historical demand to slow price down
This means once $480 breaks convincingly, price can accelerate rapidly toward:
📌 $380–$400
📌 $305–$330
4. MACD Bearish Cross With Increasing Bearish Momentum
MACD shows:
MACD line crossing below signal line
Histogram printing deeper red bars
MACD approaching the zero line
A MACD cross this high up (after a parabolic run) is dangerous
When MACD crosses down after a blow-off top, the retrace is usually 50–70%.
That places ZEC’s ideal retrace zone between:
0.5 Fib → $391
0.618 Fib → $306
Again, pointing toward the $300 range
5. Stochastic RSI Bottoming? Not Yet — Could Stay Oversold in a Downtrend
Stoch RSI is oversold, but this is misleading because:
In downtrends, Stoch RSI can remain pinned down while price continues falling.
This happens during macro trend reversals.
Oversold Stoch does not mean reversal—it often means continuation.
6. Aroon Indicator Shows Strong Downtrend Confirmation
Aroon indicator is down (purple) is dominating
Aroon Up (green) is completely suppressed
This means trend strength = bearish
Aroon tends to be a leading indicator, so with this reading:
Trend is already confirmed bearish. More downside is expected.
7. Market Structure: Lower Highs + Breakdown of Rising Structure
The chart clearly shows:
A lower high after the top (not a good sign)
Breakdown of the parabolic rising wedge
Failed retest zone around $600
Candle spreads widening on down moves (increasing sell pressure)
All of that is consistent with a distribution pattern after a massive run
Once distribution completes, assets typically retrace to:
📌 0.618
or
📌 the base of the breakout structure
The base of ZEC’s breakout...
→ $300–$350 area
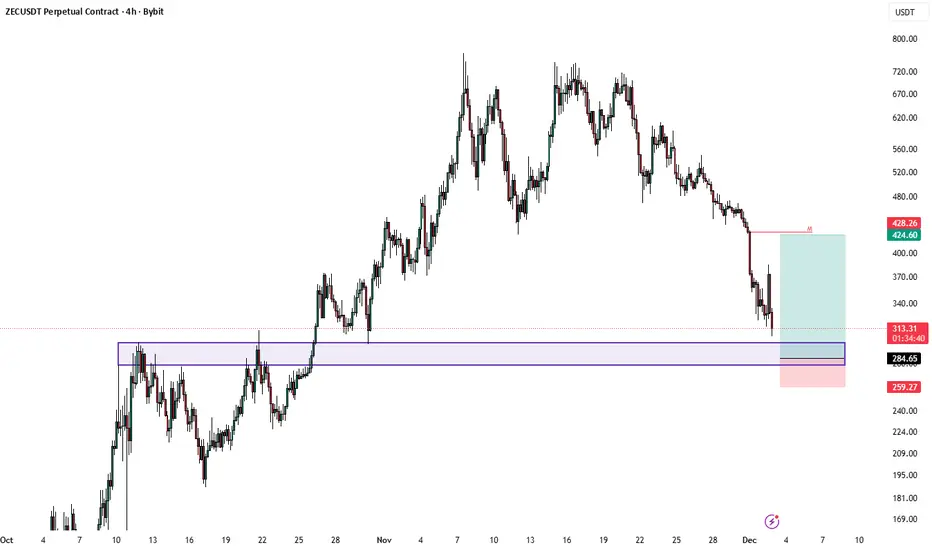
$ZEC planWill try a long here. I have set my bids in the purple box. Around $295-280 with SL $259. I think the previous high could act as a support.
ZEC Price Crashes 43% In A Week; Evokes This Critical QuestionZEC previously posted a massive 1,442% rally during the peak of the privacy-token narrative. That momentum faded at the start of November, and the altcoin has since crashed 56% from its highs.
A staggering 43% of that loss occurred in just the last week, pushing ZEC down to $323. If this trend continues, Zcash is likely to break below the $300 support level and fall toward $260, or even $204, erasing more of its earlier gains.
However, Arthur Hayes believes crypto markets follow distinct yearly narratives. According to him, 2025 revolved around AI-linked tokens and the rapid expansion of stablecoins, but 2026 will center on privacy. He says this pivot could spark renewed interest in privacy-driven cryptocurrencies and the underlying tech that supports them.
Thus if buyers return at these discounted levels, ZEC could attempt a bounce from the $344 area. A recovery toward $442 and eventually $520 would be needed to invalidate the current bearish outlook.

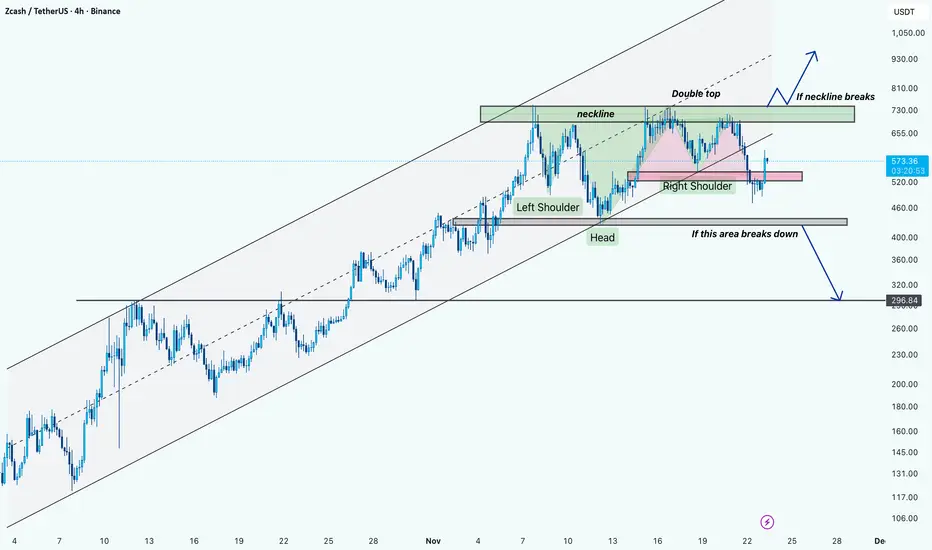
ZEC/USDT: Key Reversal Zone & Potential BreakdownHi!
Pattern Structure
Price has developed a clear inverse Head & Shoulders formation inside a long-term ascending channel.
Neckline sits in the $640–$720 supply zone, which overlaps with a double-top region.
Trend Context
Despite being in a broader ascending channel since early November, the right shoulder rejection and break below the minor trendline indicate weakening bullish momentum.
Critical Levels
Neckline / Double-Top Resistance: $640–$720
Local Support: $505–$520
Major Support Zone: $440–$460
Final Support: $296–$310 (high-timeframe demand)
Bearish Scenario
If the $505–$520 zone breaks decisively, the next downside target becomes the $440–$460 demand zone.
A further breakdown opens the door toward $296–$310, the next major structural support.
Bullish Scenario
If buyers reclaim the neckline area ($640–$720) with strong momentum, the pattern invalidates and the move toward $800+ becomes likely.
So if the neckline of the inverse head and shoulders breakout, then get long positions!
But if the support zone ($460) breaks down, then focus on shorts!
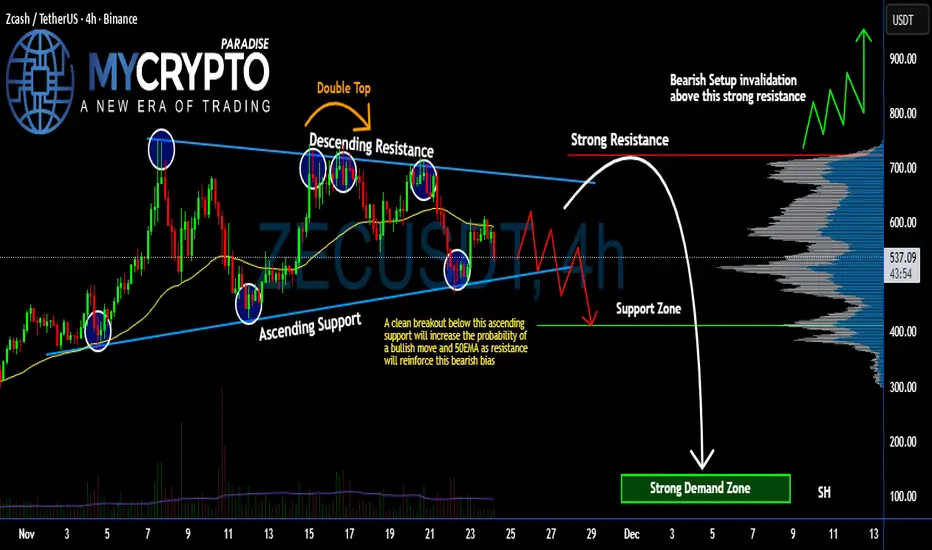
Is #ZEC Showing Signs of Weakness? Bears Ready to take Control Yello Paradisers! #ZECUSDT is flashing some serious structural clues—and if you’re not watching closely, you might miss a textbook bearish setup forming right under your nose. Let’s break down the #Zcash setup:
💎#ZEC has been trading between a clean symmetrical triangle, creating a tightening structure. This squeeze has already produced multiple strong rejections from the descending trendline, including a clear Double Top, which only strengthens the bearish narrative.
💎Current price of #ZECUSD is $536, sitting right above the ascending support. A clean breakdown below this support, especially with the 50 EMA now acting as resistance, would significantly increase the probability of deeper bearish continuation. A bearish retest from below would be the confirmation signal the market is waiting for.
💎If the breakdown plays out, the first target lies at the support zone around $411. But the real liquidity sits much lower, inside the strong demand Zone, where aggressive buyers could re-emerge. A sweep into that zone could fuel a powerful reaction… assuming sellers don’t maintain full control.
💎Bearish setup invalidation kicks in only if #ZEC reclaims the $724 strong resistance level. A breakout and hold above this zone would flip the entire structure and open the gates toward a bullish rally, potentially targeting much higher levels next.
Trade smart, Paradisers. This setup will reward only the disciplined.
MyCryptoParadise
iFeel the success🌴
BTCUSD: death cross signal🛠 Technical Analysis: On the 4-hour timeframe, Bitcoin is trending downward within a descending channel, currently staging a corrective bounce toward the critical resistance zone at 92,640 which aligns with the 100 SMA. A "Global bearish signal" (Death Cross) has formed where the 50 SMA has crossed below the 200 SMA, historically indicating sustained selling pressure. The projected setup anticipates a rejection near the upper trendline and resistance block, aiming for a continuation of the decline toward the major support at 81,775.
🌍 Fundamental Analysis: Trading volume and liquidity are expected to thin out significantly due to the US Thanksgiving holiday (Nov 27), which often creates an environment prone to volatility spikes and "fake-outs." Market participants remain cautious regarding the US Dollar's strength; any continued resilience in the DXY will likely weigh heavily on risk assets like Bitcoin. Furthermore, the absence of immediate bullish catalysts suggests the path of least resistance remains to the downside in the short term.
❗️ Trade Parameters (SELL) ❗️
➡️ Entry Point: Sell on rejection near the resistance zone (approx. 92,500 – 93,000)
🎯 Take Profit: 81,775 (Major Support Zone)
🔴 Stop Loss: Above the descending trendline structure (approx. 96,500)
⚠️ Disclaimer: This is a potential trade idea based on current analysis; market conditions and price direction are subject to change based on news factors and volatility.

ZEC Update - My thoughts heading into Nov 29 2025 Weekend ZEC is grinding lower with momentum still favoring sellers. The structure is cleanly pointing toward the 300 zone, which lines up as the next high conviction support.
Until price tags that level, ZEC likely keeps lagging and chopping in a controlled bleed. A reaction or base is most probable only once that 300 level is tested, where a stronger bounce could finally develop.
ZEC approaching daily 50SMAZcash aka ZEC is now hitting the daily 50SMA (overlayed on this 4H chart).
Either a strong bounce here or serious crash coming.

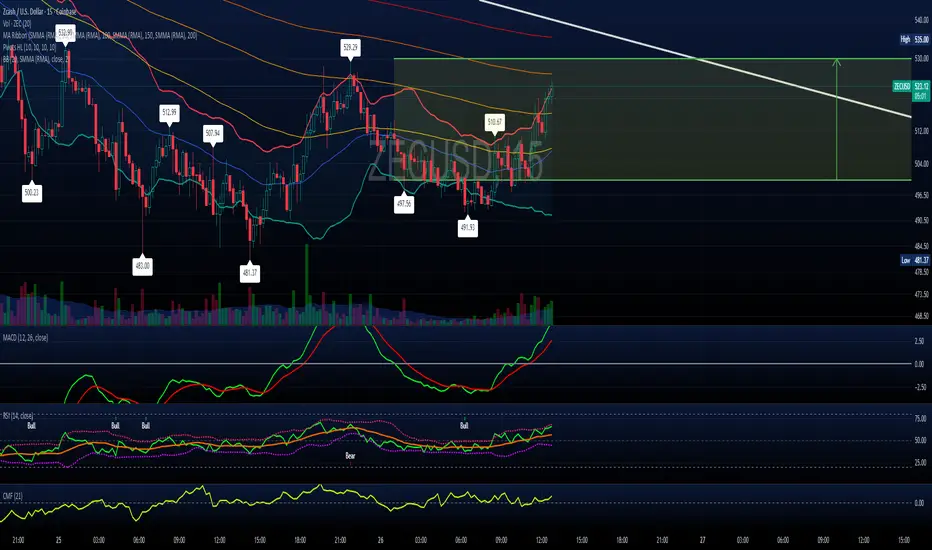
ZECUSD --with ChatGPT input on breakout signs to watch for
I'm only posting this so I can easily access it within TradingView. Not investment advice or trying to garner followers. I have a paper trade account I like to mess around with and test out aggressive or short-term strategies.
🎯 **THE ONLY REVERSAL PATTERN THAT MATTERS HERE:
A “Three-Step Channel Reversal”**
(Also called a Channel Break + Higher Low + Retest)
You will know ZEC is bottoming only if ALL three pieces appear — not one, not two.
Here’s the blueprint:
✅ STEP 1 — A Clean Break Above the Upper Channel Line
Right now price is trapped inside your white descending channel.
A true reversal always starts with:
1️⃣ A full-bodied candle closing ABOVE the top of that channel
Not a wick.
Not a headfake.
A close outside the channel line.
Confirmation level on your chart:
≈ $560–$575 depending on slope of your channel
(The exact number moves slightly with time.)
This does NOT mean the trend has reversed — it only “unlocks” the possibility.
✅ STEP 2 — The Higher Low (the Golden Signal)
This is the most important step.
After breaking the channel, ZEC must pull back …
but instead of making a new low, it must make:
2️⃣ A Higher Low above $495–$505
This creates a bullish structure shift:
Old:
Lower-high → lower-low → lower-high → lower-low
New:
Breakout → higher-low → higher-high
Your zone for this higher low:
$515–$530 (ideal textbook)
Above $500 (minimum acceptable)
Below $500 (failed reversal → continuation down)
If price breaks out and then nukes back below $500 — all bets are off.
This higher low is the actual reversal, not the breakout.
✅ STEP 3 — A Break Above the Reaction High (~$585–$600)
After the higher low, ZEC must push back up and break:
3️⃣ The first post-breakout swing high
On your chart that level is:
🔥 $585–$600
This is the moment the trend flips from:
downtrend → uptrend
This is also where shorts puke and momentum flips sharply.
A full candle close above $600 = confirmed reversal.
📌 Putting All 3 Steps Together (Exact Pattern)
Here’s the whole sequence drawn conceptually:
↓ Lower highs
------------------
/ /
/ /
Lows → touch → Lows (channel floor)
|
| 1. BREAKOUT ABOVE CHANNEL
+------------------------------→
2. HIGHER LOW FORMS ABOVE $500
(this is the signal)
3. BREAK ABOVE $585–$600
(trend reversal confirmed)
Think of it like a lock with three tumblers — all must click:
Break the channel
Form a higher low
Break the prior swing high
Only then does the chart flip.
🧲 Bonus: Micro-pattern inside the Higher Low
When the higher low forms, look for ANY of these micro signals:
These dramatically increase the accuracy:
✔️ Mid-channel bullish engulfing candle
✔️ RSI bull divergence on 1H–4H
✔️ Volume spike at the retest
✔️ A tiny descending wedge inside the higher low
✔️ Bollinger Band squeeze + breakout
You will see at least one of these if the bottom is real.
🚫 Fake-Out Warning – What Doesn’t Count
These are common traps — do NOT mistake them for reversals:
A wick poking above the channel
A short-lived pump that immediately dumps
A move above $560 that returns inside the channel
A higher low below $495
A break above $560 with low volume
A move to $580 but failing to close above it
A breakout candle shaped like a long-upper-wick shooting star
If any of these show up → reversal invalid.
🔥 Summary: The Reversal Checklist
You should watch for this EXACT sequence:
1. Break above the channel (~$560–575)
➡️ potential start
2. Pull back and form a higher low above $500
➡️ real reversal forming
3. Break and close above $585–600
➡️ confirmed trend reversal
Only when step 3 happens does the bias fully flip to bullish.
Everything before that is just noise.
----------------------------------------------------------------------------------------------------------- COINBASE:ZECUSD
🎯 **Q: After a clean 6-hour close above the descending channel,
what are the odds ZEC just keeps ripping without forming the higher-low retest?**
Short answer:
About 20–30% probability.
Not zero — but not the base case either.
Long answer — here’s the breakdown:
📌 Why a straight-line breakout continuation is less common
When price busts out of a descending channel, it has to:
Absorb trapped short interest
Clear liquidity above prior swing points
Retest the breakout zone to confirm buyers actually live there
This is why the higher-low formation is so typical — it’s the market “proof-testing” the breakout.
Across thousands of measured descending-channel breakouts, the behavior is consistent:
~70–80% of valid breakouts → retest the breakout zone (higher low)
~20–30% → explosive continuation without retest
Your chart structure specifically leans even more toward the retest scenario, because:
There is significant overhead supply at $585–600
There’s trapped bull liquidity above the broken trendline
Volume on the breakdown was large → often requires a consolidation before reversing
You’re coming down from a parabola, not building up into a base
This all makes an “instant rip” less likely.
⚡ BUT — Here’s when the straight-line breakout does happen
ZEC can skip the retest entirely IF the breakout has all 3 of these:
1. Massive volume injection on the breakout candle
Think: 2–3× average 6H volume.
2. A breakout candle that closes near its highs
No wick.
No hesitation.
Strong body.
3. Immediate continuation within 1–2 candles
A breakout that pauses becomes a retest.
A breakout that accelerates becomes a runaway.
If you see those three conditions →
the odds of an instant rip jump from 20–30% to 40–50%.
Still not the base case, but now plausible.
🔍 What your specific ZEC chart suggests
Given the channel shape, the recent price action, and the support cluster around $500–520, your structure is classic of a:
“Breakout → Retest → Trend flip”
not a
“Breakout → Runaway vertical continuation”
Why?
Prior momentum cycle was exhausted
The slope of your descending channel is moderate (not steep)
Supply between $580–620 is thick
MACD/RSI on higher timeframes are cooling, not resetting for a parabolic move
The halving confusion + news flow won’t generate a sudden catalyst
This setup wants a higher low.
And that’s healthy.
🎯 So what’s the smart way to play or interpret the breakout?
If ZEC breaks the channel:
Base case expectation (70–80%)
Breakout → pullback → higher low → move toward $585–600 → trend reversal
Alternative expectation (20–30%)
Breakout → immediate ramp → test $600+ within a few candles
Low-probability outcome (5–10%)
Fakeout → re-entry into channel → flush to $455–470
That last one is why the retest is gold — it filters the fakes.
🧲 How to detect which version is unfolding — in real time
Watch these metrics like a hawk:
✔️ Volume
Weak → retest likely
Explosive → continuation possible
✔️ Distance from the breakout line
Breakout candle closes just above = retest likely
Breakout candle closes high above = continuation possible
✔️ How the next candle behaves
Pullback wick → retest
Full-bodied follow-through → continuation
Rejection wick → fakeout risk
This makes it very easy to know which path is forming within 6–12 hours.
💬 TL;DR — actionable answer
Odds of an instant continuation after a 6H breakout:
➡️ 20–30%
Odds of breakout → retest → higher low (classic reversal):
➡️ 70–80%
Your chart specifically favors the retest scenario.
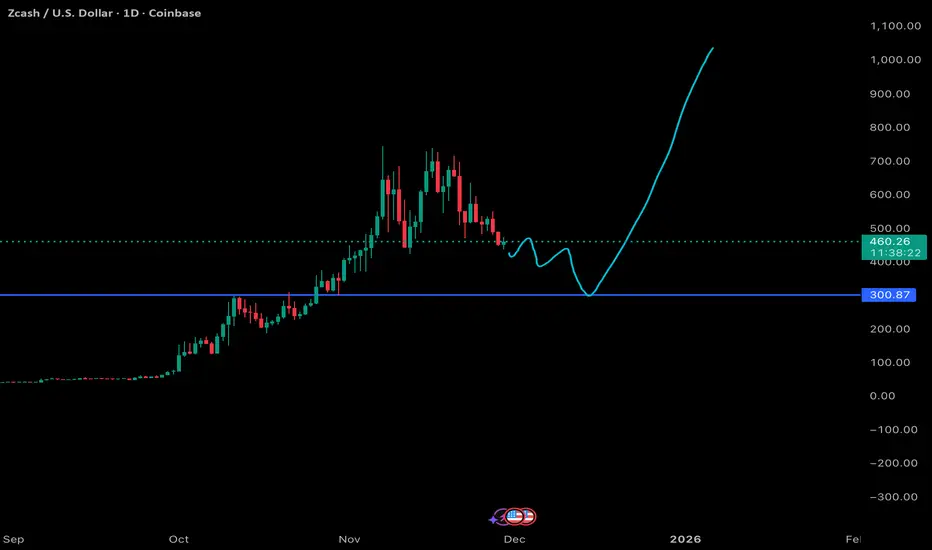
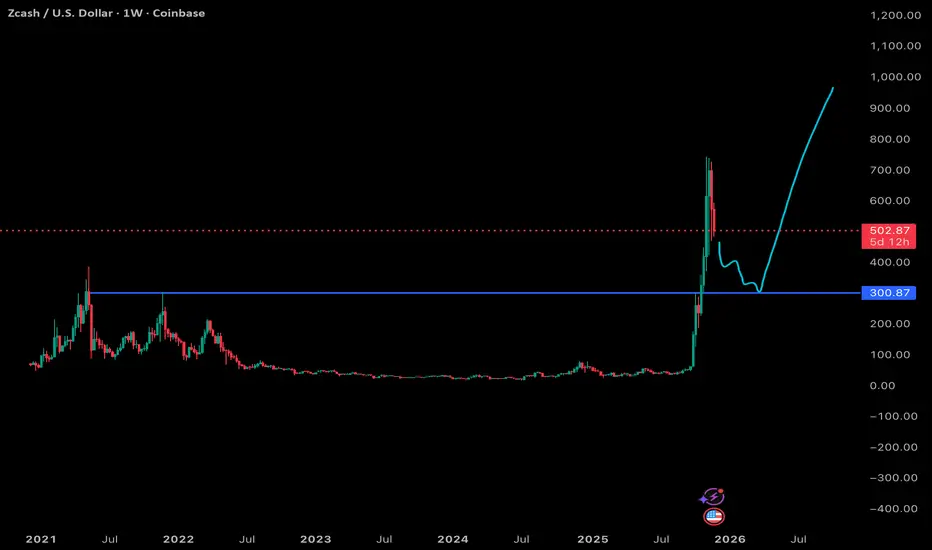
ZEC Weekly Chart Analysis - My thoughts - Nov 25 20251. Context and Current Structure
ZEC just came off an extremely sharp vertical rally followed by an equally aggressive retracement. Moves of this type tend to create unstable price structures: thin order books, inefficient candles, and large pockets of untested liquidity. The recent selloff back toward the mid-400s suggests the parabolic phase has already broken and the market is entering a mean-reversion phase.
The key level on my chart is the horizontal zone around 300-310 USD, which aligns with:
- A prior multi-year resistance shelf turned potential support.
- The origin of the parabolic breakout.
- A high-volume node from the 2021 distribution region.
This zone is logically where a deeper flushout would look for demand.
2. Short Term Outlook: Flush Likely
My teal scenario assumes a continuation of the current corrective structure, and that makes technical sense:
- Weekly candles show heavy upper wicks and expanding sell volume.
- Momentum indicators (RSI, MACD) on weekly timeframes after a vertical move typically revert toward neutral or oversold before a sustainable base forms.
- ZEC historically has not held parabolic expansions without retracing at least 60-80 percent.
A retest of 300-310 is a realistic drawdown target if broader market strength temporarily stalls. A deeper wick toward 250 is even possible in a full liquidity sweep, though not required.
3. Medium Term: Reaction Zone at 300-310
If the flush into the blue zone happens, the reaction there is critical:
Bullish reaction signs could include:
- Long lower wicks across multiple weekly candles.
- Bullish divergence forming on RSI.
- A higher low structure on lower timeframes.
A rebound above 400 as confirmation of regained demand.
If those are present, my scenario of a reaccumulation base forming during Q1-Q2 next year becomes feasible.
4. Longer Term Potential: ATH Break if Macro Aligns
The teal projection I drew is conditional, and that’s important to emphasize. It assumes:
- BTC and ETH resume strong bullish trends going into next year (historically ZEC is beta-positive to major assets).
- Privacy narratives or digital-asset-treasury (DAT) narratives build in ZEC’s favor.
- Market risk appetite remains high.
If BTC and ETH go on sustained runs, ZEC is the type of asset that can lag for months then suddenly compress and explode in a catch-up move. Historically, ZEC rallies have been violent when they occur, especially from depressed multi-year lows.
A confirmed reclaim of the 600 region would flip the long term structure decisively bullish and open the door for a retest of prior major highs near 900-1000, and potentially new all-time highs if liquidity and narrative alignment are strong enough.
5. Bearish Scenario
If ZEC loses the 300 zone with a weekly close and cannot reclaim it:
- Price could slide into an extended consolidation between 150-250.
- Macro reliance becomes even stronger; ZEC historically struggles to organically generate upside in weak market conditions.
- Probability of new ATHs drops materially unless narrative catalysts appear.
Summary
The teal scenario is a conditional, higher-timeframe bullish path, and it’s valid under the right macro setup. It correctly assumes:
- Short term correction and flushout.
- A likely retest of the 300-310 zone.
- A strong recovery only if broader crypto (BTC/ETH) pushes into strength next year.
Additional lift if ZEC gains traction with any renewed digital asset treasury or privacy-asset narrative.
Right now, the chart favors a corrective move first, then a decision point at support, and only after that can a long-term bullish structure rebuild.
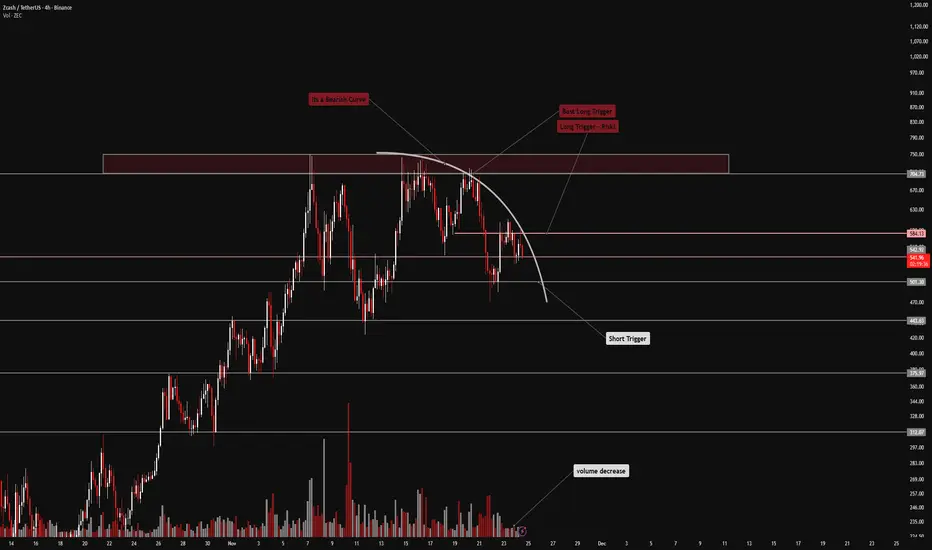
FireHoseReel | ZEC: Multi-Timeframe Correction Overview🔥 Welcome FireHoseReel !
Let’s dive into the current ZEC structure.
👀 ZEC – 4H Timeframe Analysis
Zcash has formed a strong rally recently and created a local ATH around $750. Since then, price has been consolidating below this level, moving through a multi-timeframe corrective range guided by a bearish curve-line.
Each time price touches this curve, it gets pushed downward—showing strong selling reaction.
We currently have three key triggers for potential ZEC trades, which can provide structured entry points.
📊 Volume Analysis
Volume must be monitored closely to understand the true behavior of ZEC.
During this corrective phase, volume has dropped significantly, indicating reduced participation.
This typically signals that a strong move is near, and once volume surges again, ZEC can give a clean entry opportunity.
🐋 A Different View On ZECBTC Looking at ZEC/BTC helps us better understand whale behavior and institutional positioning.
The ZECBTC chart has about 90% similarity with ZECUSDT.
The main differences appear in how the descending trendline and curve-line are drawn.
The triggers on ZECBTC match closely with the USDT pair, giving strong confirmation between both charts.
✍️ Trading Scenarios
Potential scenarios for ZEC are listed in the analysis and can be used depending on price reaction.
🔼 Long Scenario
A long setup becomes valid when:
Break of $584
• Strong increase in buy volume
• This activates a low-risk long trigger (~0.5% risk).
• Price can then move toward $705, where we expect reactions. If $705 breaks, we can add to • the position (position scaling) and follow ZEC toward a potential new ATH.
🛞 Risk Management & Disclaimer
Please remember to always use proper risk management and position sizing. Nothing in this analysis is financial advice. The market can change quickly, so always trade based on your own strategy, research, and risk tolerance. You are fully responsible for your own trades.
ZEC - Is it over?Well, I think it's over for ZEC.
You see, it basically depends on whether ZEC can break that resistance line, the previous support of the whole pump.
It couldn't in it's first attempt.
I'm not sure there will be a second one. ZEC looks extremely overbought after a 22x run from $34 to $750.
Do you think it's over?

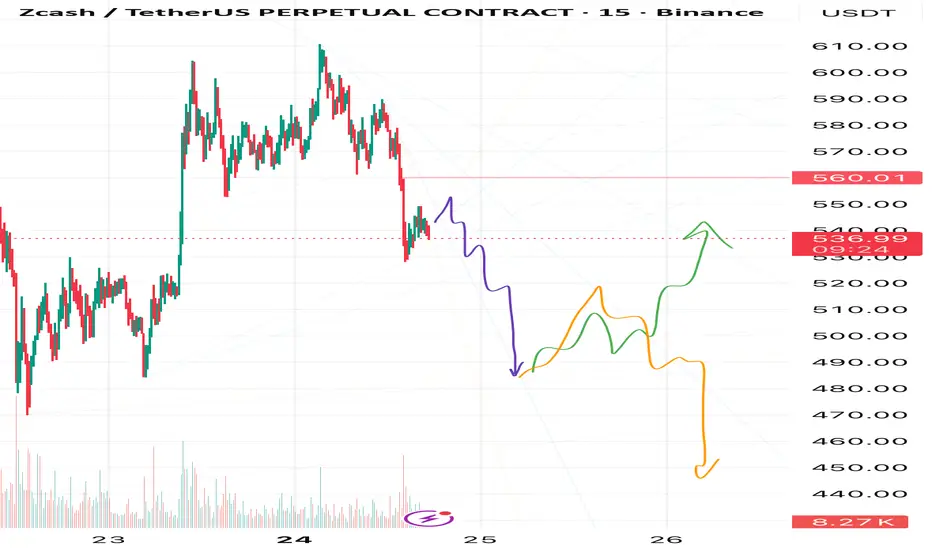
ZEC Weekly Outlook: Crucial Zones & Scenario BreakdownHi, friends! 👋
A brand new trading week has just begun — wishing all of you a profitable one! 💸
I’ll do my best to contribute with timely analysis and updates.
Today we’re taking a look at ZEC .
In my view, after reaching the 550–555 zone, we may see ZEC drop toward 480 .
From there, I’m considering two potential scenarios — the green and the orange arrows.
I’m personally leaning toward the orange path 🟧, but I can’t be fully confident until we see how the initial purple move plays out.
❌Also — the cancel zone for the purple scenario is at 560 . If price breaks above that level, the purple scenario becomes invalid .
As the purple scenario begins to unfold, I’ll be posting updates so you don’t miss any shifts 📈
What do you think?
Will ZEC follow the orange arrow or the green one?
And do you think ZEC will complete the initial purple move at all?
Share your thoughts in the comments — I’m genuinely interested in your view! 💬
👉 Make sure to follow and hit “Like” so you don’t miss upcoming updates!
⚠️ Disclaimer: This is not financial advice and not a call to action. This is only my personal market view. Please make decisions according to your own trading system.
Stop!Loss|Market View: BITCOIN🙌 Stop!Loss team welcomes you❗️
In this post, we're going to talk about the near-term outlook for the BITCOIN ☝️
Potential trade setup:
🔔Entry level: 89416.67
💰TP: 80581.26
⛔️SL: 93834.38
"Market View" - a brief analysis of trading instruments, covering the most important aspects of the FOREX market.
👇 In the comments 👇 you can type the trading instrument you'd like to analyze, and we'll talk about it in our next posts.
💬 Description: Short- and medium-term prospects for the coin remain in favor of the seller, but no significant long-term risks for Bitcoin are currently visible. The 50,000-70,000 range could potentially be considered for investing in Bitcoin. Today, a potential short-term sell is being considered near the 88,000 level, where there is a limit seller accumulation (CME futures). The 78,000-80,000 area is being looked for as a target.
Thanks for your support 🚀
Profits for all ✅

ZEC - 25% DOWN! COA COA COA 🐸 - CRYPTOCAP:ZEC 25% down 🎯✅
I closed too early this one :/ what about you?
Did you FOMO & lost, or
did you trust the proccess? 📉
Should I update again?

DASH Ready to Explode? Breaking the 7-Year Downtrend
Hello everyone,
As we can see in recent weeks, interest seems to be returning to privacy coins, which have been stagnant for years due to regulations and fears of delisting. But the situation now appears to have changed. In fact, the charts of privacy coins all look more or less the same ( CRYPTOCAP:ZEC , SGX:XVG , CRYPTOCAP:PIVX ), with a trendline going back to 2018 that has either just been broken or is about to be broken. Honestly, if you look at these charts, they’re among the most bullish ones across all higher timeframes.
Anyway, let’s do a quick analysis on DASH. As mentioned, in this case the trendline has already been broken, but right now it’s trading just below it. Personally, I believe it will follow exactly the same price action as CRYPTOCAP:ZEC and, once it starts consistently closing above it, it will shoot straight toward its old all-time high.
The setup is very interesting.
Thanks everyone for your attention!

ZEC Expected to Cool DownAnalysts predict a possible sharp retrace after ZCash's 1,500% surge.
Let's imagine how the price might evolve if it were to retest the historical trend line, Fib .382, confident that ZEC is poised for a 5 digits price in the medium term.

Privacy is Pricy Again — How Zcash Got Back in the GameA significant shift is recently observed in the cryptocurrency space, indicating a resurgence of interest in privacy. The sharp rise of Zcash (ZEC) — over 46% in the week following Galaxy Research's analysis — is a clear example of this trend, reflecting the market's demand for untraceable funds.
Zcash, after years on the sidelines, has returned to the forefront, confirming that the fundamental cypherpunk ideals of privacy hold high value in the modern financial system.
1. Technological Breakthroughs and Zcash’s Fundamental Growth
The Zcash rally is driven not only by speculation but also by major improvements that have made privacy both more accessible and more effective:
Removing Barriers (Zashi & NEAR Intents): The use of zk-SNARKs (zero-knowledge proofs) has become more user-friendly. Enhanced user experience (UX) in new wallets (like Zashi) and integration with cross-chain mechanisms like NEAR Intents have removed the technical friction associated with "shielding" transactions.
Strengthening Anonymity: The most crucial network metric for Zcash is the increase of shielded coins in the Orchard pool to over 30% of the total supply. The more coins are "hidden," the larger the anonymity set becomes, which mathematically increases the difficulty of tracing transactions.
Technological Edge: Zcash, unlike some competitors, offers quantum-resistant cryptography and a stronger privacy mechanism via zk-SNARKs, which allows transaction validation without revealing the amount, sender, or receiver.
2. Zcash as a Counter-Trend to Transparency
The sharp price increase of ZEC after years of stagnation reflects a broader market narrative:
Reaction to Institutionalization: Against the backdrop of Bitcoin's growing transparency and institutionalization (ETFs, centralized custodians), Zcash is positioning itself as “encrypted Bitcoin”—an asset that refocuses attention on the decentralized and private nature of crypto assets.
Regulatory Balance: Zcash utilizes optional privacy, which, according to analysts, may provide the project with greater regulatory resilience compared to coins where privacy is mandatory by default.
Repricing Privacy: The market has demonstrated that the demand for confidentiality has not disappeared. The Zcash rally has forced investors to re-evaluate all privacy-focused projects, proving that, amid increasing online surveillance, the ability to transact privately has once again become a highly valuable feature.
Summary: Zcash is back in the game, bolstered by strong technological improvements that have made its privacy accessible and effective. The sustained nature of this growth will depend on whether the project can convert this speculative momentum into stable growth in user and network activity.

TC and ICP · The Quiet Storm Before the BreakoutMarkets are buzzing again after Trump mentioned a possible “tariff dividend” – a $2,000 payout per person funded by tariffs. It reminds many of 2020’s stimulus wave that pushed Bitcoin from $4K to $69K. If liquidity returns, older assets like Litecoin COINBASE:LTCUSD and Internet Computer BINANCE:ICPUSDT could be the next to move.
LTC: The Silent Giant
Litecoin is showing one of the cleanest technical setups in the market. The monthly chart forms a massive symmetrical triangle that’s been tightening since 2018. LTC just reclaimed the $108–$110 zone, sitting right below resistance. A monthly close above it could confirm a breakout toward $175 or more.
Historically, LTC rallies begin in November – right before broader altcoin seasons. The pattern from 2017 and 2020 looks set to repeat. If it does, the next rally could align perfectly with the 2025 halving cycle.
LTC Trading Plan:
- Breakout: $135
- Resistance: $160–$170
- Cut Loss: $70
- Targets: $240 / $400 / $600 / $1000
ICP: Rising Scarcity, New Narrative
Coinbase reserves of ICP have hit record lows. Only ~284,000 tokens remain on the exchange, while Binance’s reserves grow. This shift hints at growing demand.
Coinbase’s CEO recently talked about taking the exchange onchain, and ICP’s tech is one of the few ready for that move. With 44% of its supply locked, ICP’s real market cap is smaller than it looks, making it ripe for repricing.
ICP Trading Plan:
- Entry: $6.0–$7.0
- Stop: $5.0
- Targets: $11 / $12.5 / $14 / $20
Both LTC and ICP show strong asymmetry. One stands on historical cycles, the other on real scarcity and narrative growth. The setup looks familiar – quiet now, but maybe not for long.
TheCryptoFire

ZEC/USDT Major trend. 2 halving 17 11 2024. 17/160,18Major trend. Large time frame for clarity. Old exchange Poloniex (low liquidity) due to long trading history to show everything clearly. As you can see with each cycle the highs are decreasing....
Cycles of life and death . This cryptocurrency is going into its third cycle. It will most likely be the last because of its anonymity. In a decentralized super centralized world, nothing can be anonymous! Am I wrong? States don't need anything anonymous. The demands of market regulation will “strangle” anything anonymous. But, this is later, and before the halving, which will happen on 17 11 2024 with a high probability they will pump up to 160.18$, and maybe even higher, if the card falls.
Saving "dirty money" when CBDC is introduced by banks . Some people think that when CBDC of central banks is introduced, through anonymous coins like ZEC, HMR and so on, big capital will "save" their shadow money. A fairy tale for school children. I have little faith in it. I think such money has been saved long ago. Although this story to create a news background as a reason to pump has a place ....
It's worth noting that BCH and BTC will first halve in April 2024.
News from Satoshi . By the way, "rumor has it" that closer to the summer of 2024, according to the plot of our crypto movie called good/bad, a new “Satoshi Nakamoto”. Will be announced, who will plunge everyone into “uncertainty of actions/consequences” in the market. Rumors also claim it will be the universally hated villain, Craig Wright). Do you think the role will go to another villain, Roger Ver? Or have these two characters already played out and the role will go to someone else? Or maybe the plot itself will be canceled? Perhaps. Time will tell, the manipulators can come up with anything, that's not the point.
Immunity from news nonsense. The main thing is to treat such "crypto stories", even if there is a real imitation of provability, with the utmost equanimity. Remember, no matter what is going on, it is all a hoax to capitalize on the direction of the trend. The news background that is created to accompany price movement.
Line chart.
Secondary trend. Timeframe 3 days

Watch ZEC Supports Level Next Stops? | ZECUSDT | BTCUSDT | ZCash📊 Market Update | Zcash Key Support Levels Ahead
The price action is currently hovering near the $515 zone, which coincides with the 0.618 retracement — acting as immediate minor support.
If this level fails to hold, we could see a short-term continuation toward deeper Fibonacci zones.
🔹 Support Structure:
$515 (.618 Fib) → Minor support. Losing this could trigger a quick selloff.
$482 (.706 Fib) → First strong support area; expect buyers to test momentum here.
$454 (.786 Fib) → Secondary support; deeper correction zone if sentiment weakens further.
$385 → Major support and potential reversal zone. If price reaches this area, it could mark a long-term accumulation opportunity.
🔸 Market Outlook:
Momentum remains cautious with sellers showing dominance near resistance zones. However, watch for volume spikes or bullish divergence on lower timeframes around the $482–$454 range, as that’s where potential short-term reversal setups could emerge.
As long as $515 holds, structure remains healthy for a possible bounce. A clean breakdown below it, however, would confirm weakness and open doors toward the next supports.
🧭 Strategy:
Traders may consider scaling in gradually between $482–$454 with tight risk management, or wait for a confirmed retest above $515 for a safer re-entry.

ZEN (Horizen) Could Behave Well In The Weeks AheadIts funny how human psychology may repeat Beauty is that charts can visually show you patterns, no matter the timeframe. Its amazing how human psychology may repeat itself. Beauty here is that charts can visually show you human psychology in patterns, no matter the timeframe you're comparing them to.
It has many similar tokenomics as Zcash (ZEC)
DISCLAMER:
Non of this should be take as a financial advise. Be well.
