$ZEC: From Rebound to Breakout?ZEC’s fundamentals continue to strengthen. Its integration with Router Protocol enhances cross-chain interoperability — a step that bolsters Zcash’s long-term outlook even as privacy adoption remains niche.
Following a sharp pullback, Zcash has rebounded 37% from the $187 demand zone. The move reaffirmed support above the anchored VWAP and marked a breakout from diagonal resistance, signaling improving momentum.
Technically, the $270 zone stands as the next major resistance. A rejection there could lead to a retest of $230 but maintaining price action above $200 — where a short-term consolidation previously formed — the overall structure remains healthy.
ZECUSDT
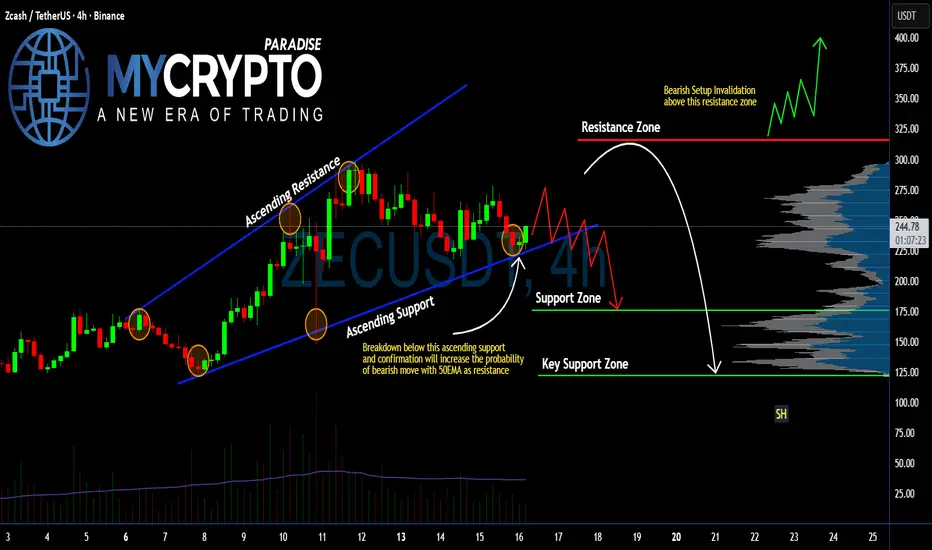
#ZEC Ready to Collapse? Breakdown Here Could Trigger Panic Sell Yello Paradisers! Are you really paying attention to what’s brewing on #ZECUSDT? Because if not, you might be blindsided by what could be a brutal move down. Let's get into the #ZEC setup:
💎#Zcash has been trading inside an Ascending channel, but the momentum is clearly fading. The last bounce off the ascending support was weak, and now we are testing that same ascending support again, but this time, with growing selling pressure.
💎Current price of #ZEC is around $242, and the situation is getting critical. A confirmed breakdown below this ascending support will flip the structure bearish and open up a clean setup toward significantly lower levels. The 50 EMA, which is now acting as dynamic support, will act as resistance. It will only accelerate the downside if this breaks.
💎If this breakdown plays out and is followed by a failed retest of the broken trendline, we could easily see price dump into the Support Zone around $175, and possibly even fall into the Key Support Zone near $121, where stronger buyers may finally step in.
💎On the flip side, the bearish setup is invalidated only if #ZECUSD breaks back above the Resistance Zone at $316. That would shift momentum in favor of the bulls and could spark a sharp rally.
Trade smart, Paradisers. This setup will reward only the disciplined.
MyCryptoParadise
iFeel the success🌴
ZEC breakout of multi years resistance !ZEC / USDT
We noticed a Strong move this week
Price broke multi-years resistance line (2024/2022/2020) which is a huge breakout for this coin !
Simple thing , Holding above line = bullish
Invalidation: candle close below it

DASH and other privacy coins are back?During the recent flash crash, privacy-focused cryptocurrencies were among the least affected. ZEC reached a new high, and DASH followed suit. In light of government plans to restrict financial privacy, demand for privacy coins is making a comeback. Could this be the beginning of a privacy season?
DASH recently broke out of a year-long accumulation phase. From the perspective of Elliott Wave Theory, the bottom formed in mid-2025 appears to mark the end of wave C in an ABC zigzag correction (at important Fib retracements). It looks like we are heading into a powerful bull market.
How best to play it?
The optimal strategy is to wait for the full development of the initial five-wave impulse (wave 1) and then enter on the nearest correction (wave 2).

ZEC peakedZcash had a very good run but all good times come to an end.
It is breaking down. I dont want to be a buyer here or even higher.
All Info in the Chart.
No trading advice - my opinion

ZECUSDT – Bullish Flag Pattern: Consolidation Before Breakout?Overview
After a powerful rally that pushed ZEC from around $100 to nearly $300, the market has entered a healthy consolidation phase — forming a clean Bullish Flag Pattern on the 4H timeframe.
This pattern often represents a pause within a strong uptrend, where smart money accumulates positions quietly before the next major breakout.
As long as price remains within this downward-sloping channel (yellow zone), the structure still reflects controlled consolidation inside a broader bullish context.
---
Pattern Identification
Primary Pattern: Bullish Flag
Characteristics: A downward-sloping parallel channel following a sharp upward impulse
Technical Implication: Typically signals a continuation pattern, suggesting that the uptrend is not yet over
Confirmation: A 4H candle close above the upper boundary of the flag, supported by rising volume
---
Key Technical Levels
Upper Flag Resistance: $289 – $298
→ A breakout and 4H close above this zone confirms bullish continuation
Mid-Zone Support: $271
→ Serves as a balance level within the consolidation range
Lower Flag Support: $261
→ Acts as invalidation for the flag; a breakdown below could trigger short-term correction
---
Bullish Scenario
If ZEC breaks out above the flag and closes firmly above $298, the next leg of the rally could begin.
Confirmation: 4H close > $298 with strong bullish volume
Target 1: $320 – $340
Target 2 (Measured Move): $480 – $490, based on the length of the previous flagpole
Invalidation: 4H close back below $261
💡 Bullish Flags often lead to explosive continuation moves — once confirmed, momentum can accelerate rapidly.
---
Bearish Scenario
If price fails to hold support and breaks down below $261, it could shift into a short-term correction phase.
Confirmation: 4H close < $261
Target 1: $220 (previous demand area)
Target 2: $190
Invalidation: Close back above $289 cancels the bearish bias
---
Conclusion
ZEC is currently in a calm but critical stage — consolidating after a major impulse, with a textbook Bullish Flag forming at the top of the move.
A confirmed breakout above $289 – $298 would strongly suggest that the next bullish leg is about to unfold.
Patience and confirmation are key: true breakouts are often preceded by quiet compression like this one.
---
#ZEC #ZECUSDT #BullishFlag #CryptoAnalysis #TechnicalAnalysis #ZECBreakout #PriceAction #CryptoTrading #MarketStructure #SwingTrade #ChartPattern

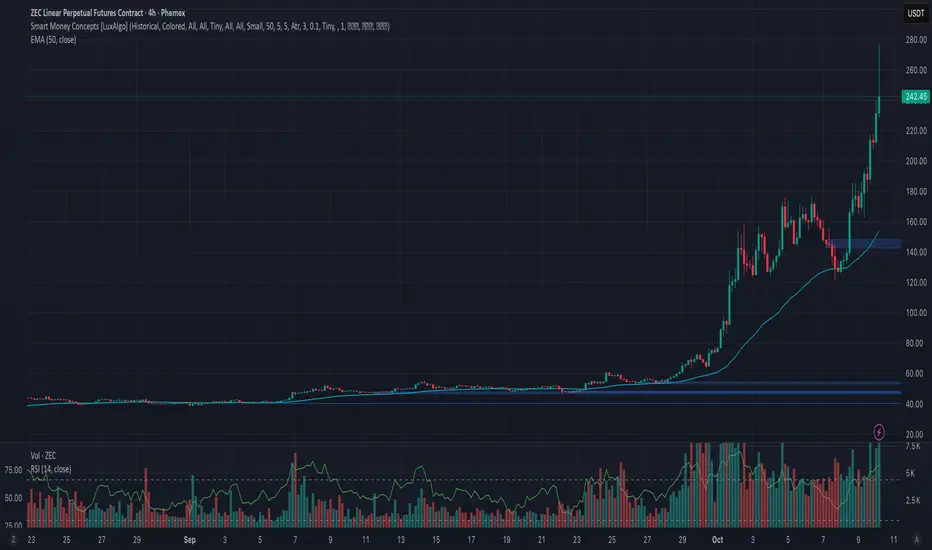
Phemex Analysis #108: ZCash (ZEC) Went Parabolic—Is $300 Next?In a matter of weeks, PHEMEX:ZECUSDT.P ripped from the double-digits into the mid-$200s, putting privacy coins squarely back in focus. As of now, ZEC hovers near $245–$260, with an intraday range that’s stretched as high as the upper-$270s—the kind of wide tape that rewards disciplined plans and punishes hesitation.
With momentum heated and volatility elevated, here’s a clear if/then map for the next leg.
Possible Scenarios
1) Bullish Continuation — squeeze through the high-$260s, eyes on $277 → $300
What to watch: A decisive push back through $260–$270 with rising volume. That reclaims the top of today’s range and puts the $277 spike back in play; above there, round-number gravity favors a $300 test.
Pro Tips:
Entry: Add on a strong 1H/4H close > $268–$270, or a break-and-retest that holds.
Risk: Initial stop just below the reclaimed zone (e.g., $255–$258).
Targets: $277 (recent peak), then stagger into $295–$305 if momentum persists.
2) Retest & Accumulation — cool off into $210–$230, rebuild for another run
What to watch: A controlled pullback (shrinking candles, softer volume) into $230 or as deep as $210–$215. This lets funding reset and late longs get flushed without breaking market structure.
Pro Tips:
Entry: Scale bids near $230 → $215 only if selling pressure is waning.
Risk: Place protective stops a tier below your lowest ladder (e.g., $204–$206).
Re-trigger: Re-add on a reclaim of $240–$245 with volume.
3) Bearish Reversal — lose $210 on heavy sell volume, open a slide to $185 → $168
What to watch: A daily close under $210 with expanding volume, turning today’s lower bound into resistance. That exposes $185 (prior congestion) and even the mid-$160s (today’s intraday low region) in a sharper unwind.
Pro Tips:
Defense first: Cut risk on a decisive break < $210.
Patience: Don’t knife-catch; look for capitulation (wide wick + volume spike) then base-building before re-entries.
Invalidation to flip long: Strong reclaim of $210–$215 after the flush, with momentum divergences.
Conclusion
ZEC’s tape is hot, the ranges are wide, and the levels are clean. Trade what the market gives you:
If the high-$260s break and hold → ride the $277 retest, then stalk $300.
If we cool into $230–$215 on light volume → consider accumulation for the next push.
If $210 snaps on heavy selling → stand aside and wait for $185 → $168 stabilization.
Stay nimble, size sanely, and let the levels—not the adrenaline—drive your decisions.
🔥 Tips:
Armed Your Trading Arsenal with advanced tools like multiple watchlists, basket orders, and real-time strategy adjustments at Phemex. Our USDT-based scaled orders give you precise control over your risk, while iceberg orders provide stealthy execution.
Disclaimer: This is NOT financial or investment advice. Please conduct your own research (DYOR). Phemex is not responsible, directly or indirectly, for any damage or loss incurred or claimed to be caused by or in association with the use of or reliance on any content, goods, or services mentioned in this article.
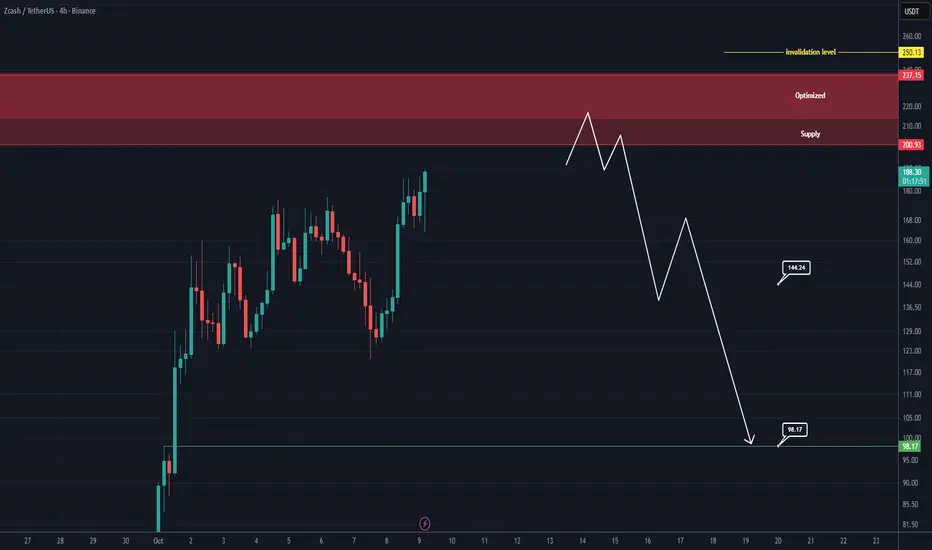
ZEC Analysis (4H)This coin has grown significantly and is now approaching a very strong resistance zone.
The supply zone contains an optimized sub-zone that we’ve labeled as optimized. The closer the candles are to this area, the safer it is to take a sell/short position without a trigger However, if you are risk-averse, wait for the candles to touch this zone, observe the price reaction, and only enter the position after receiving proper confirmation and a trigger signal.
The main targets are marked on the chart.
A daily candle close above the invalidation level will invalidate this analysis.
For risk management, please don't forget stop loss and capital management
When we reach the first target, save some profit and then change the stop to entry
Comment if you have any questions
Thank You
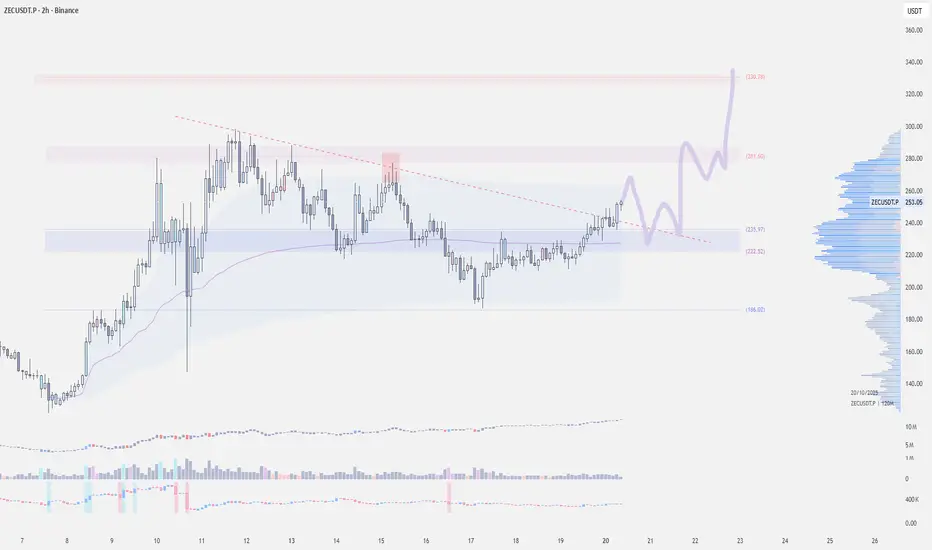
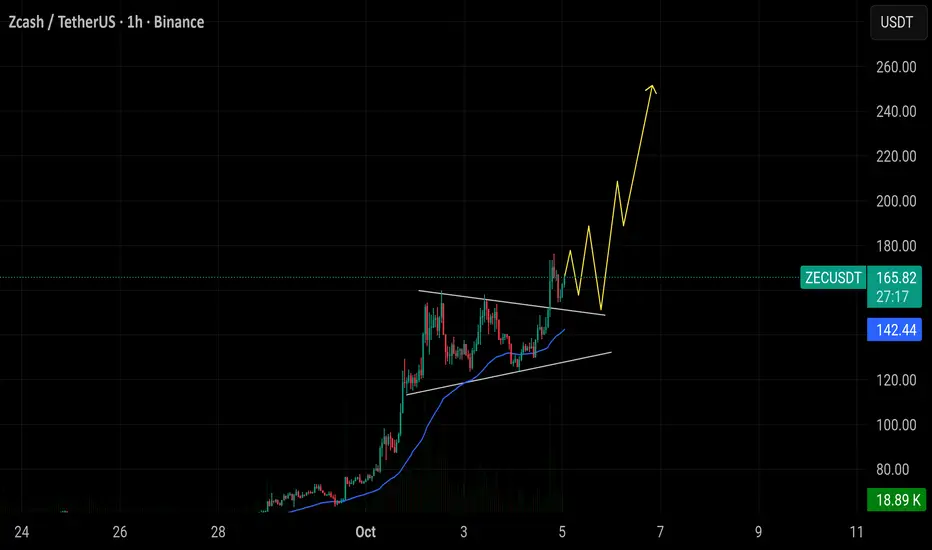
#ZECUSDT - Another leg up is aheadWe all saw a massive bullish in zec in previous days out of 260% instant bullish... and now it's in consolidation
it shows a symmetrical triangle pattern in hourly chart with 2 attempts of breakout ... third one must be work
the next station at ( 250 - 280$)
best Regards:
Ceciliones🎯

Zcash Breaks 2018 Downtrend: Confirming a Multi-Year Bull Run Zcash has just broken a trendline that had been in place since 2018. Even though the movement of the last few days might seem exaggeratedly wide, in reality, it's just the confirmation of the start of a bullish trend that will likely last for years. From both a technical and fundamental analysis perspective, it's one of the 5 most interesting coins in absolute terms. It has been undervalued for years due to fears of delisting and FUD, but institutional investors have bet heavily on it while retail investors were discouraged. That said, I wouldn't enter a position at this price, but possibly around $80-100. Personally, I've accumulated for years below $40, but on this confirmation, I'd definitely add capital. The next important resistance is the last reversal point from the previous cycle, so around $300. Dips around $100 are to be bought if they are granted. Thanks to everyone for the attention.

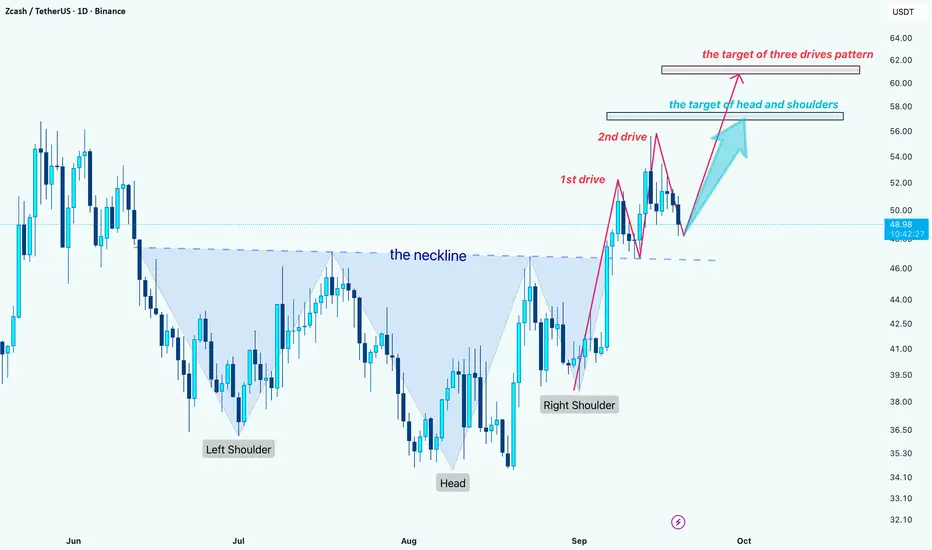
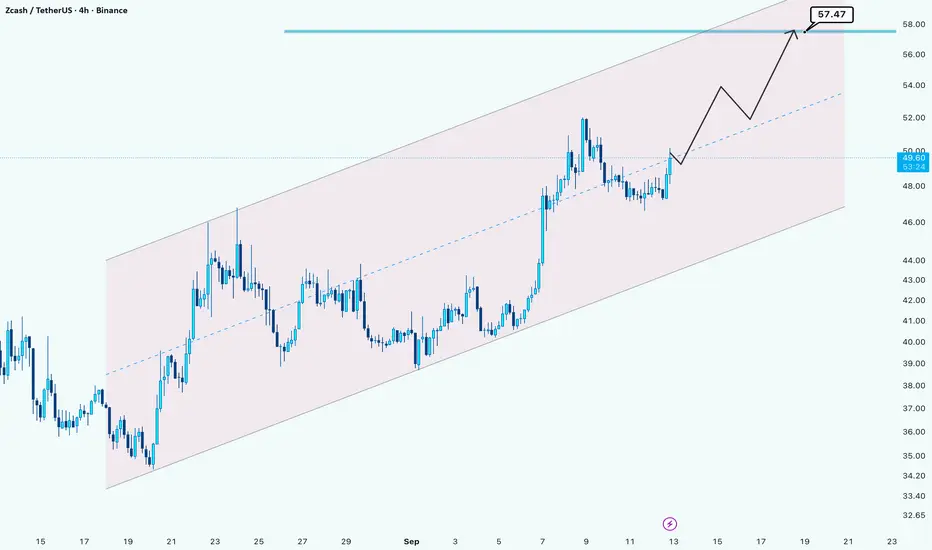
ZEC: Bullish Breakout with $57 and $61 Targets AheadHello guys!
ZEC is showing some interesting technical setups right now:
First, the chart has completed a Head & Shoulders reversal and successfully broken above the neckline. Based on this structure, the next potential upside target sits around $57.
On a lower level, the price is also shaping a Three Drives pattern. If this plays out, the extension could take ZEC higher toward the $61 zone.
Overall, the technical picture looks bullish as long as the price holds above the neckline. A breakout confirmation with momentum could push ZEC step by step toward those targets.
$ZEC/USDT has broken out of its wedge pattern and is currently $ZEC/USDT has broken out of its wedge pattern and is currently trading near 164. If price holds above 150, momentum could continue toward the 200–240 zone. The lower trendline support around 130 remains the key level to maintain the overall bullish structure.
ZEC wedgie ideaA wedgie is the act of forcibly pulling someone's crypto up their buttocks. It can be a form of bullying a victim or a prank among friends. There are various types of wedgies, such as an "atomic wedgie," where the crypto is pulled over the victim's head, or a "hanging wedgie," where the person is suspended by their crypto coin.

#ZEC/USDT Breakout Confirmed - Bullish Rally Loading!#ZEC
The price is moving within a descending channel on the 1-hour frame, adhering well to it, and is heading for a strong breakout and retest.
We have a bearish trend on the RSI indicator that is about to be broken and retested, which supports the upward breakout.
There is a major support area in green at 48.26, representing a strong support point.
For inquiries, please leave a comment.
We are in a consolidation trend above the 100 Moving Average.
Entry price: 52.70
First target: 53.70
Second target: 54.90
Third target: 56.85
Don't forget a simple matter: capital management.
When you reach the first target, save some money and then change your stop-loss order to an entry order.
For inquiries, please leave a comment.
Thank you.

ZEC Market Update📊 SEED_DONKEYDAN_MARKET_CAP:ZEC Market Update
SEED_DONKEYDAN_MARKET_CAP:ZEC has successfully broken out of the red resistance zone 🔴✅
It is now approaching the first target at the blue line level 🎯

ZECUSDT UPDATE#ZEC
UPDATE
ZEC Technical Setup
Pattern: Bullish Falling Wedge Pattern
Current Price: $23.45
Target Price: $37.60
Target % Gain: 60.49%
SEED_DONKEYDAN_MARKET_CAP:ZEC is breaking out of a falling wedge on the 1D timeframe. The breakout confirms bullish momentum with structure favoring continuation toward $37.60, showing over 60% potential upside. Always use proper risk management.
Time Frame: 1D
Risk Management Tip: Always use proper risk management.

ZECUSDT Forming Falling WedgeZECUSDT has recently broken out of a falling wedge formation, a classic bullish reversal pattern that often signals strong upside potential. After weeks of consolidation, the breakout has been confirmed with solid price action and growing volume, showing that buyers are stepping in with confidence. The market structure now favors bulls, and momentum is building toward higher levels.
The projected upside suggests a potential gain of around 40% to 50%+, making ZEC one of the more attractive opportunities in the current market. As the breakout continues to unfold, traders should keep an eye on key resistance levels, as a strong push beyond them could trigger an extended rally.
Investor sentiment around Zcash is improving, and renewed interest in this project is likely to fuel further momentum. The current chart setup highlights a shift in trend that could drive price into a new bullish phase, making this pair worth watching closely.
✅ Show your support by hitting the like button and
✅ Leaving a comment below! (What is You opinion about this Coin)
Your feedback and engagement keep me inspired to share more insightful market analysis with you!
ZEC Market Update📊 SEED_DONKEYDAN_MARKET_CAP:ZEC Market Update
After an uptrend, SEED_DONKEYDAN_MARKET_CAP:ZEC is now retracing 🔄
👉 Watching the green support zone around $49.55 🟢
👉 Potential bounce area for long entry if buyers step in 🚀
⚡ Trade smarter, not hope 🔑

ZEC/USDT –> Climbing the Channel Toward $57.5Hello guys!
ZEC/USDT is trading inside an ascending channel and has recently bounced off the midline support. As long as the price holds above the $48–$49 zone, the bullish structure remains intact. The next key target sits near $57.5, which coincides with the channel’s upper boundary.
also in daily time frame it formed a head and shoulders pattern so it confirmed the bullish trend!
ZEC ANALYSIS📊 #ZEC Analysis
✅There is a formation of Falling Wedge Pattern on daily chart with a breakout and currently pullback around its major support zone🧐
Pattern signals potential bullish movement incoming after sustain above the major support zone.
👀Current Price: $40.36
🚀 Target Price: $54.41
⚡️What to do ?
👀Keep an eye on #ZEC price action and volume. We can trade according to the chart and make some profits⚡️⚡️
#ZEC #Cryptocurrency #TechnicalAnalysis #DYOR

ZECUSDT 12% PROFIT DONE.ZECUSDT was shared few days ago with proper entry zone, price exactly dropped into it and pumped 12% so far.
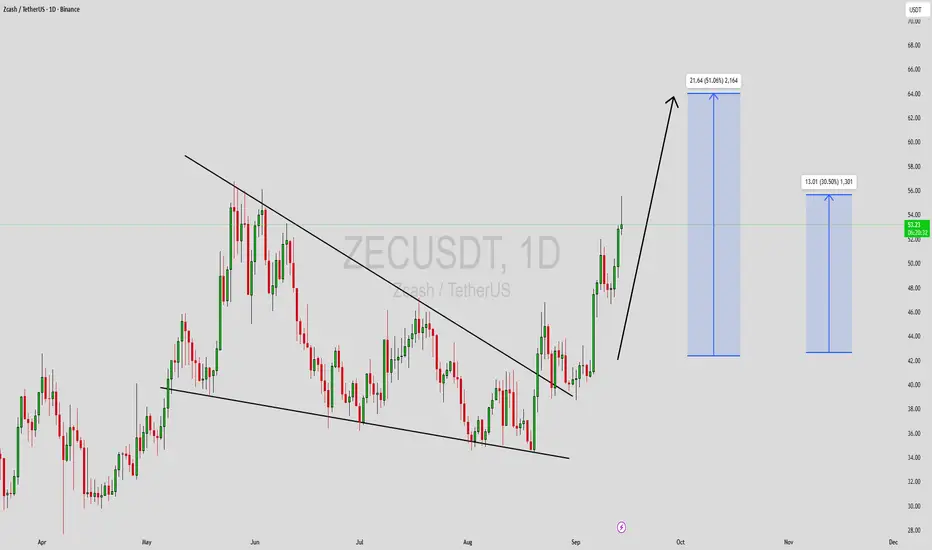
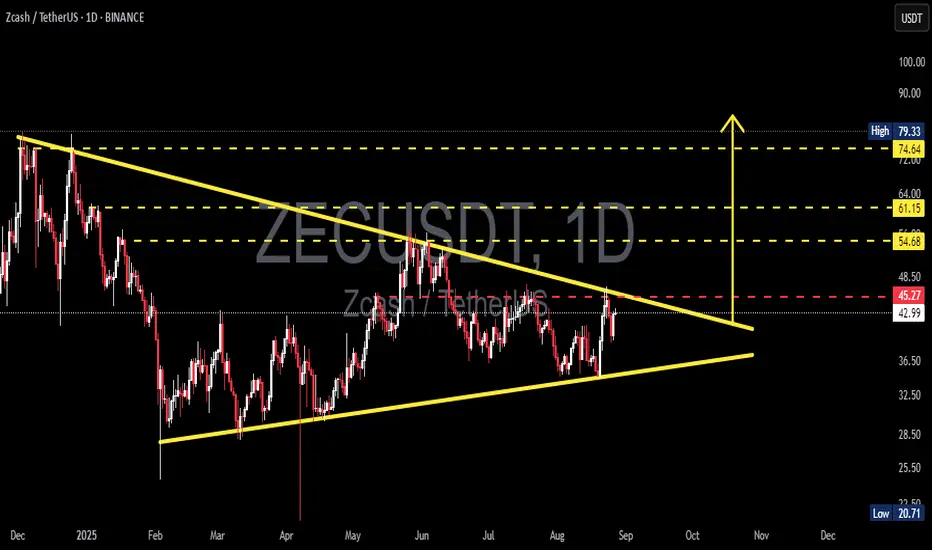
ZEC/USDT — Symmetrical Triangle: A Big Breakout?🔎 Pattern Analysis
On the daily chart, ZEC/USDT is forming a symmetrical triangle. This structure is characterized by:
Lower Highs → sellers continue to defend lower levels (descending resistance).
Higher Lows → buyers step in earlier each time (ascending support).
Both lines are converging, compressing volatility, and signaling that a major move is imminent. The apex of this triangle is projected around late September to early October 2025, meaning a breakout (up or down) is likely to occur before then.
---
📈 Bullish Scenario (Upside Breakout)
If ZEC manages to break and close above 45–48 (red dashed line + descending resistance), especially with rising volume, it would confirm a bullish breakout.
➡️ Potential upside targets:
🎯 Target 1: 54.68 (+27%)
🎯 Target 2: 61.15 (+42%)
🎯 Target 3: 74.64 (+73%)
Such a breakout often sparks sustained rallies, especially if the broader crypto market sentiment aligns.
---
📉 Bearish Scenario (Downside Breakdown)
If ZEC fails to break resistance and instead closes below ~36.50 (ascending support), downside momentum could accelerate.
➡️ Potential downside targets:
🎯 Target 1: 36.50 (first support, −15%)
🎯 Target 2: 32.50 (major support, −24%)
🎯 Target 3: 20.71 (historical low, −52%)
This would indicate weakness and could open the door for deeper declines toward multi-month lows.
---
⚖️ Key Takeaways
The symmetrical triangle is a neutral but powerful pattern → direction will depend on the breakout.
Always wait for confirmation (daily close + volume spike) before committing.
Beware of false breakouts — a retest of the breakout zone is often a safer entry.
Risk management is crucial: protect capital with stop-loss and proper position sizing.
👉 In short: ZEC is approaching a make-or-break moment. Breakout to the upside could fuel a strong rally, while a breakdown could trigger heavy selling pressure.
#ZECUSDT #Zcash #CryptoAnalysis #Breakout #SymmetricalTriangle #Altcoins #TechnicalAnalysis #PriceAction
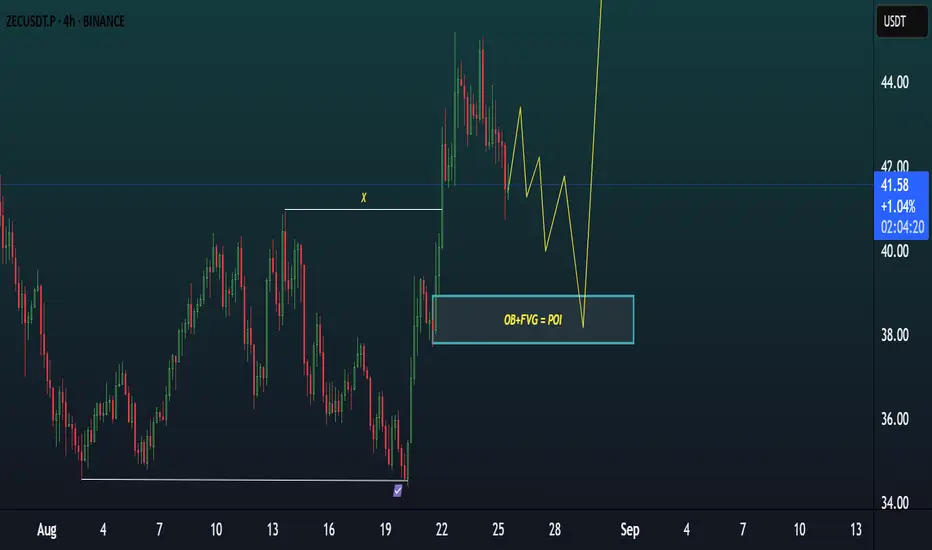
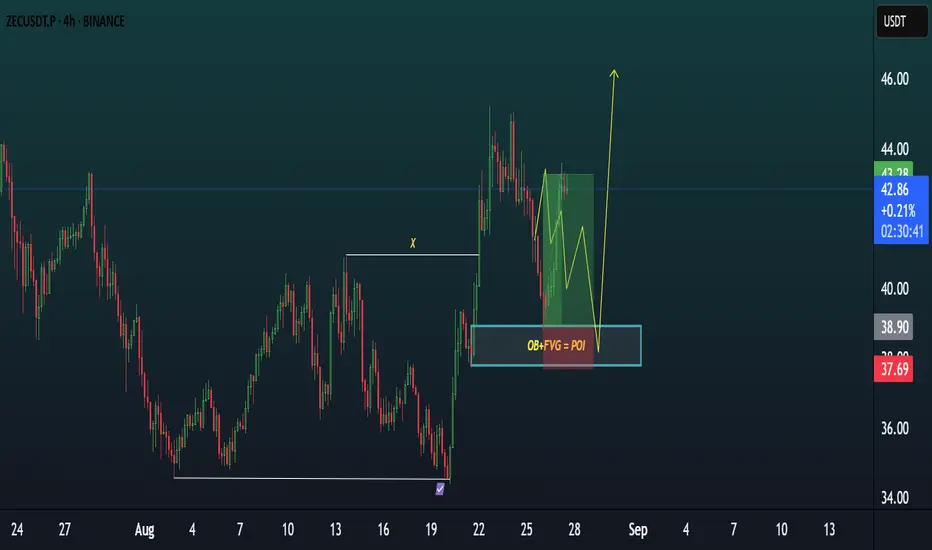
ZECUSDT TRADE IDEA.ZECUSDT | 4H Bullish Setup
🔑 Key Structure: Bullish BOS confirmed, liquidity sweep done.
🟦 POI Level: OB + FVG confluence around $38–39 (strong demand zone).
📉 Current Price: 41.5 — pulling back after recent rally.
📊 Trade Plan: Expect retrace into demand zone before bullish continuation. Watch for confirmation entry.
🎯 Targets: $44 – $46 (short-term), higher if momentum sustains.
❌ Invalidation: Clean 4H close below $37.8 demand zone.