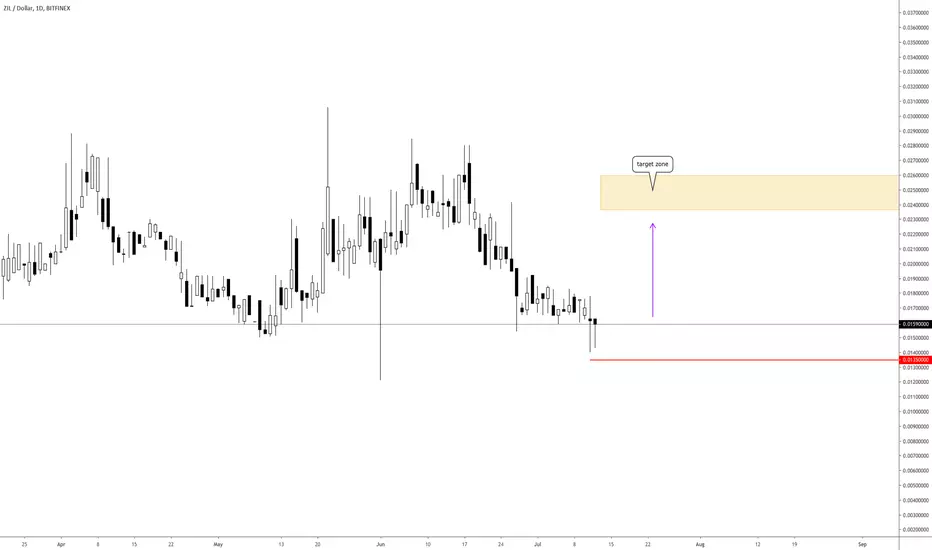
ZILUSD Elliot wave count Lovely move from ZILUSD thus far .. following what appears to be a completed WXY leg down. I am looking for a pullback after we complete the A wave, which could stretch up to the resistance zone at 0.027 - 0.030.
Zilusd

Zilliqa Over sold Zilbtc UrgentHi Guys,
Zilliqa in massive resistance Please be careful and sell around 207 to 210
Next traget to buy again 170 and 160.
Good luck don't forget support us by : like and share

ZILLIQA / TETHERUS (ZilUsdt) my short-term work.I determined 3 trend lines. I will especially focus on the second trend line.
My target is to move the gfrafik between the first and second trend lines. It is not difficult to break the resistance of 0.01296 if it falls between these two trend lines. My target zone is between 0,01296 and 0,01462.
In short, everything depends on not breaking the second trendline down.
Ps: It should not be forgotten that there is a mainnet between the 1st and 3rd of June.
It is my personal work. It is not investment advice.
It is a special work for Dündar. =))

ZIL/BTC (Strong Bullish Breakout)ZIL/BTC
-a strong breakout above resistance at 96s
-new higher high is made
-new immediate support at 96s
-breakout is followed with huge volume
-upside potential is up to 200s
-cross ultimate indicator signal Long priority
-market structure is a strong uptrend

$ZILUSD | Possible $0.05/0.10 long term.$ZILUSD | Possible $0.05/0.10 long term.
Last days, weeks we see a huge increase at Zilliqa. I think this can continue for a while because there is a lot of volume flowing in. We may go back to Zilliqa in the old world and maybe even up there.
For a long term forecast, I estimate zilliqa between 0.05 / 0.10 cents. That would be a nice area to gain.
Goodluck.


ZIL/BTC (Bullish Breakout?)ZIL/BTC
-strong breakout with volume
-broke local resistance line
-if the candle closes bullish
-new immediate support at 78s
-next upside target is swing high at 96s

ZIL/BTC (Potential bottom?: up to 30% profit)ZIL/BTC
ZIL may have found the same support at 47 sats area which was also the previous consolidation area last Jan 2020 trading action.
If ZIL can break outside the downward trendline resistance, we could expect more upside scenarios up to the 80 sats region.
And place our stop-loss below 56 sats.

ZIL/BTC TA Update (Broke Daily Resistance?)ZIL/BTC
ZIL broke the resistance, made new Higher High and Higher Low. If he can hold above this resistance for a Day or two,
There is a high probability to continue the uptrend up to 200 Day MA resistance level.

ZILUSDT[Watchlist] : How to trade resistance breakout #2The price action for BINANCE:ZILUSDT is currently making an attempt to cross-up the resistance area which would results in a triple bottom formation . Depending on whether the price action will succeed in this attempt or not would provide traders a good opportunity to take a long position .
Overview : since the Sept 26th the price action has reached the bottom area (i.e green rectangle) three times (i.e. Sept 26th, Oct 23th, Nov 26th) on before initiating an upward move to the current resistance (i.e red rectangle) around 0.00558-0.00572. Another sign of strength is the higher lows formation made by the price action since the end of November.
Risk management : Traders should be cautious and not anticipate the breakout since it is the first time the price action is testing this resistance since the breakdown of the support around 0.00558-0.00572. Therefore, traders might wait a clear breakup followed by a pullback to take a long position. If the price closes above the top of the resistance, it will be a bullish sign since buyers would have been able to push the price above the resistance. In that case, entry price would be placed on the same level of support to anticipate a potential pullback.
Profit targets and stop loss would later be set based on the entry price.
My Trading Principles :
- Risk/Reward ratio : since it is difficult to predict every market movement, it is suggested for traders to only look for trades with a R/R ratio of at least 1:3.
- Stop loss : in addition of the initial stop loss, if the price actually goes as predicted, traders should keep a trailing stop to keep some profit.
- Position Sizing : it is suggested for traders to stick to their position sizing strategy. As a rule of thumb, most retail investors risk no more than 2% of their investment capital on any one trade.
"Remember, plan the trade, trade the plan. Build that discipline."
I will keep updating this trade according to the future price action.
Please support this idea with your likes and comments, thanks.
Best regards,
You can also follow me on :
=> Telegram : t.me
=> Twitter : twitter.com
=> Instagram : www.instagram.com
=> LinkedIn : www.linkedin.com

ZIL/BTC TA Update (Bulls are back?)ZIL/BTC
Zilliqa is starting to make a move again, it is visible as the candle yesterday closed Bullish.
The fact it has been trading above 50 & 100 Day MAs, short term momentum is to the up.
If ZIL can break above 82 sats, expect the price to continue strong to the upside.

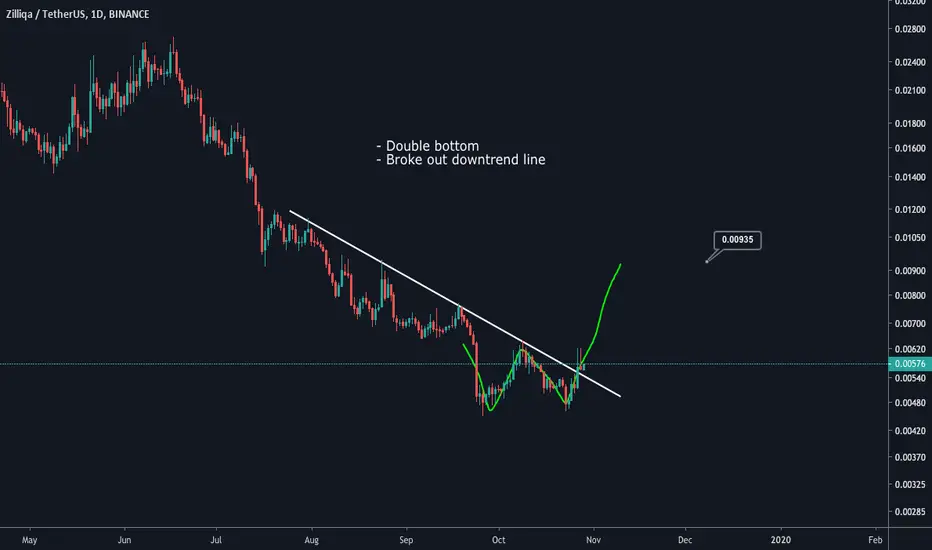
ZILUSD - Minimal Chart AnalysisHey guys!
Looks like another ALT that has some some space to move is ZIL / Zilliqa. We have:
Massive RSI Divergence
Smaller RSI Divergence
Huge Falling wedge (ABCDE on the chart)
Double Bottom
I want to keep my analysis with as few indicators as possible. Too many indicators were confusing me in past times.
Happy trading!


Dead coinDon't buy this shit we got first sell monthly signal Dead coin
16 Months of down trend they need 16 years for recovery hhhhh


ZILLIQA UP TREND CHANNEL HOLDING $ZIL $ZILUSDTUptrend channel holding for quite many times, expect bounce this time too, nice R/R for long, stop loss will be below the uptrend line after candle close confirmation.
TP 1 will be in the middle line of the uptrend channel, TP 2 aim for the high of the channel.

ZIL POSITIVE TREND DEVELOPMENTSnew trading patterns suggest that ZIL may be ready to swing to the upside

ZIL USD IHS and C&S ROCKET is COMING?Hello folks
ZIL have some good moves these days. A clear IHS and C&S can be seen on ZIL USD. If we breakout red line on the chart it is higly possible to see our target
Wish you the best...
