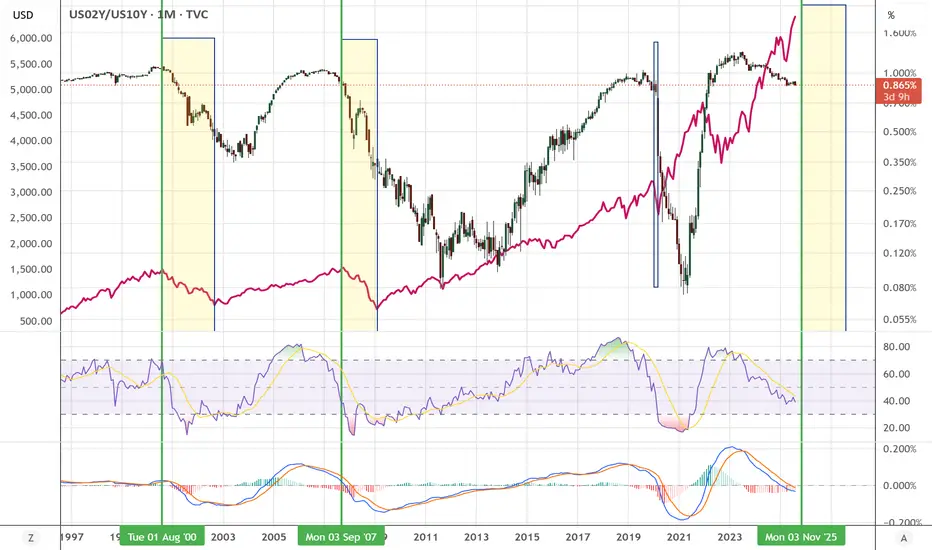
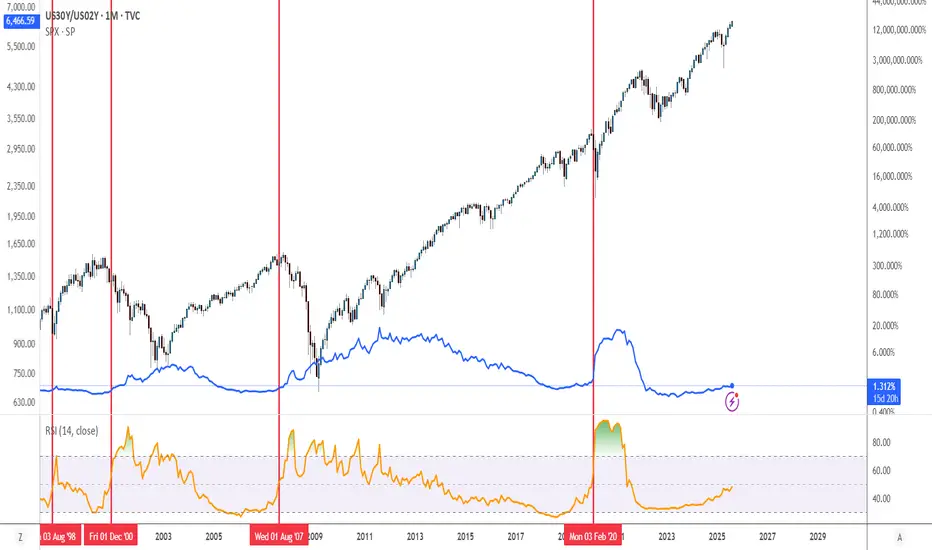
US02Y / US10Y - Look at history! Crash incoming?Look at 2000-2002 and 2007-2009.
What happened when the US02Y / US10Y went down?
MEGA CRASH!
Do you really think history will not repeat itself this time?
The question is, how long do we have?
Nov 2025 might be the top?
Could we go up until early 2026?
Government bonds
Daily Updates 8/25/25 UCHFHello Traders! I am neutral on UCHF. The signs are not super clear for me currently. This pair was moving as primed as I wanted. No trend has really picked up this month. No quarterly shift.

UST 10Y Technical Outlook for the week Aug 25-29 (updated dailyUST 10Y Technical Outlook for the week Aug 25-29 (updated daily)
Overnight
Overnight, the yield on the 10-year US Treasury note dropped to 4.28%, a decline of nearly 10 basis points from its session highs, following Federal Reserve Chairman Jerome Powell’s keynote speech. Powell indicated that the balance of risks between inflationary pressures and a softening labor market has shifted, paving the way for a 25-basis-point rate cut at the Federal Reserve’s September meeting, with markets increasing expectations for further policy easing in the fourth quarter. Rate futures reflect a consensus for two total rate cuts in 2025, though 40% of the market anticipates three cuts. However, a steepening yield curve suggests ongoing inflation concerns, fueled by a strong Producer Price Index release and rising prices in ISM and S&P PMI data, highlighting a divergence between short- and long-term interest rate expectations. This development signals a shift toward looser monetary policy to support the labor market, but persistent inflationary pressures warrant caution. Stakeholders should closely monitor upcoming Federal Reserve communications and economic indicators, such as CPI and employment reports, to gauge the trajectory of interest rates and their broader market implications.
Economic Release for the week www.myfxbook.com
Weekly Outlook
With US Treasury yield, at 4.28% as of Friday, yield may trend lower this week (August 25–29) after Federal Reserve Chairman Jerome Powell signaled a 25-basis-point rate cut in September due to a softening labor market. Markets expect yields could dip further if upcoming data like durable goods orders and consumer confidence signal economic cooling, though persistent inflation concerns may limit declines. Monitor key economic releases for yield direction.
**Disclaimer:** The technical analyses provided herein are based solely on my personal analysis and are intended for my own study and reference. They do not constitute a recommendation or solicitation to buy or sell any financial instruments. Any decision made by individuals based on this analysis is their own responsibility, and I assume no liability for any losses or damages incurred as a result of using this information. It is advisable to conduct thorough research and consult with a qualified financial advisor before making any investment decisions.

US 10Y TREASURY: the Jackson Hole effectDuring the week markets were moving in a mixed mode, however, Friday brought the change, after the Fed Chair Powell's speech at Jackson Hole Symposium. The significant market reaction occurred when Chair Powell noted the possibility of further monetary policy easing in the coming period, implying a possible rate cut. Market is estimating, currently with 83% odds, that the next rate cut might occur at September's FOMC meeting. The 10Y US benchmark yields were moving around the level of 4,3% during the week, with a major move toward the 4,25% level at Friday's trading session.
Friday's move increased the probability that the currently major support level at 4,2% might be tested again in the coming period. Possibility during the week ahead. Still, it should be kept in mind that the Fed's major inflation gauge, the PCE index, is set for a release on Friday. Considering current sensitivity of markets on inflation figures, any deviation of the PCE indicator from market expectations might trigger higher market reaction.

Powell Delivers at Jackson Hole - NVDA and PCE Up NextNearly a 200% ATR move today in the S&P
SPY didn't close beyond all-time highs
QQQ didn't close beyond all-time highs
DIA did close above all-time highs
IWM continues its strong rally for August
I'm noticing some serious rotation into small cap, mid cap, and seeing the markets allocate
outside of Mag7, Tech, and AI
Powell all but guaranteed a September rate cut and the market loved it - yet prices aren't necessarily higher (yet). I still think the Aug-Oct window is ripe for a small correction and pullback to offer up better positioning for end of year
NVDA Earnings next week Wednesday
US PCE and Core PCE Friday to close out the month
I'm curious if the SPX 6500 resistance level will continue to hold firm - let's see
Thanks for watching!!!

Tariffs Effect on InflationIn April, inflation was at its lowest point. It was also the month when the 'Liberation Day' tariffs were introduced, applying a 10% baseline tariff to most countries.
But it wasn’t until August—when the July Core CPI rose to 3.1% from its April low of 2.8%— and now investors began to question whether inflation will be trending higher in the near future with now higher tariffs set in after 1st August.
10 Year Yield Futures
Ticker: 10Y
Minimum fluctuation:
0.001 Index points (1/10th basis point per annum) = $1.00
Disclaimer:
• What presented here is not a recommendation, please consult your licensed broker.
• Our mission is to create lateral thinking skills for every investor and trader, knowing when to take a calculated risk with market uncertainty and a bolder risk when opportunity arises.
CME Real-time Market Data help identify trading set-ups in real-time and express my market views. If you have futures in your trading portfolio, you can check out on CME Group data plans available that suit your trading needs www.tradingview.com

US20Y distribution coming to an end here?As the title says, been eying this one for quite some time. Looks like a steeper drop is coming into play here. Aligns with NASDAQ:TLT finishing an accumulation pattern.
US 10Y TREASURY: yields rise on mixed signalsPosted US macro data during the previous week show resilience of the US economy on pressures coming from implemented trade tariffs. The July inflation stood at 0,2% for the month, in line with market expectations. The ability of the US economy to absorb inflationary pressures is increasing expectations among investors that the Fed might cut interest rates in September. However, on the opposite side, July retail sales at 0,5% m/m came higher from market estimate. At the same time, University of Michigan consumer inflation expectations both for this year and for the period of next five years, were also increased compared to previous post. The market reacted to such expectations by increased yields. The US 10Y benchmark yields turned to the upside and the level of 4,32%, where they are closing the week.
After a strong push of yields to the upside, some relaxation might be possible in the week ahead, where levels modestly below the 4,3% might be tested. It should be taken into account that the Jackson Hole Economic Policy Symposium will be held 21-23 August, where Fed Chair Powell is expected to hold a speech. Any new information, not previously shared with the market, might trigger higher volatility in US Treasury yields.

UST 10Y Technical Outlook for the week Aug 18-22 (updated daily)UST 10Y Technical Outlook for the week Aug 18-22 (updated daily)
Overnight
The yield on the 10-year US Treasury note stabilized at approximately 4.3% on Friday, following a rebound from 4.2% in the prior session, driven by economic data that tempered expectations for aggressive Federal Reserve rate cuts. Strong July retail sales growth, both in headline and control group figures, alongside an unexpected surge in import prices—the largest in 15 months despite new tariffs—fueled concerns about persistent inflationary pressures. These developments, combined with expansionary fiscal policies and higher deficit spending, have raised doubts about inflation aligning with the Fed’s target, despite earlier subdued CPI data. Market sentiment continues to favor a 25-basis-point rate cut at the Fed’s September meeting, but confidence in three total cuts for 2025 has diminished, as reflected in rate futures. Additionally, the latest 10-year note auction saw reduced participation from indirect bidders, influenced by tariffs and fiscal policy concerns.
Economic Release for the week Aug 18-22 www.myfxbook.com
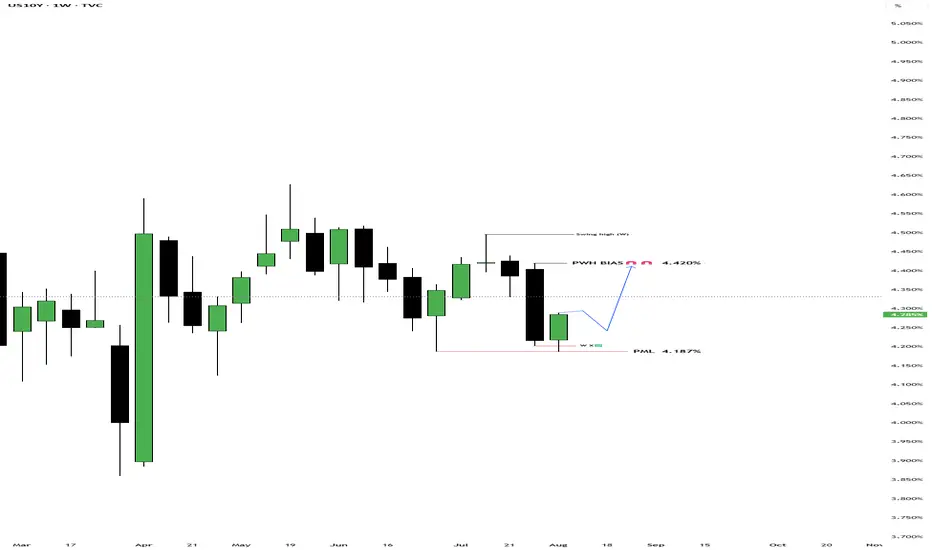
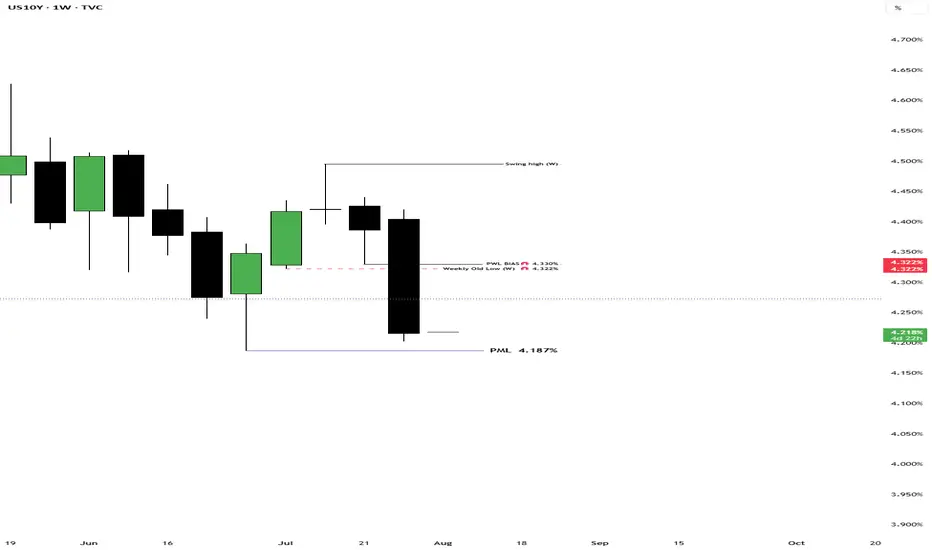
Weekly bias
Lets start the week with a long-term look. On the monthly chart () we can see that we are just trading within the previous month’s range. We almost broke the previous month low of 4.187% but aggressively bounced back up. We need to see an aggressive break above or below to define a new direction otherwise we are sideways within the range. On the weekly chart, ( ) after the market grabbed the liquidity at 4.202% the yield has bounced back and for the week I am anticipating previous week high, 4.332%, as a target.
**Disclaimer:**
The technical analyses provided herein are based solely on my personal analysis and are intended for my own study and reference. They do not constitute a recommendation or solicitation to buy or sell any financial instruments. Any decision made by individuals based on this analysis is their own responsibility, and I assume no liability for any losses or damages incurred as a result of using this information. It is advisable to conduct thorough research and consult with a qualified financial advisor before making any investment decisions.
US30Y/US02Y Ratio Chart Crash PreditionAnytime the RSI hits 50% on the US30Y/US02Y ratio a crash soon proceeds when on a monthly timeframe. This only works on the monthly timeframe, it will not work on other timeframes.
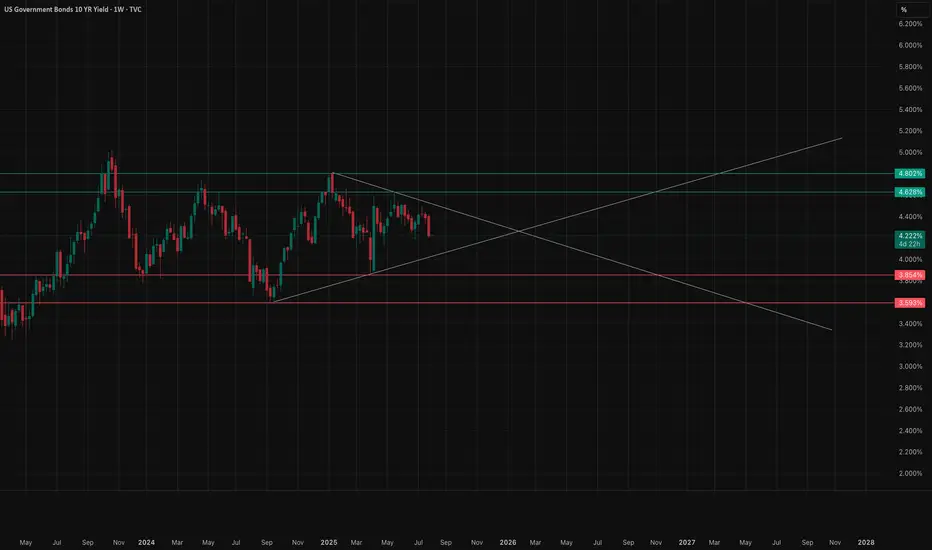
10yr yield rangesSupport Zones (Bounce Potential):
First Support: Around 4.16% (the lower boundary of the channel and the 0.786 Fib level). If yields drop toward here, watch for a reaction or bounce.
Major Support: Near 3.96% (1.618 Fibonacci extension)—historically, such extensions offer strong bounce candidates if tested.
Resistance Zones (pullback potential):
Immediate Resistance: 4.42%–4.45% (upper channel and multiple EMA clusters). This is the first hurdle for upward moves.
Previous Top Target: Yields could rally toward 5.20% if resistance zones are cleared (marked by the big, bold orange arrow). That’s the previous cycle high where sellers may reappear.
Price Structure: The moving averages are tightly grouped, suggesting indecision. A breakout from this cluster—especially upward—could spark momentum toward 5%.
Channel Guide: The descending channel (yellow lines) acts like a garden fence; a move above the top suggests a break in trend and potential for a run higher.
Fibonacci Extensions: Not just mystical numbers! They help map out calculated support and resistance. See chart's blue/red lines for reference levels—each marks a potential turning point.
Bullish Scenarios: Two orange arrows show possible rally paths, indicating upward bias if supports hold.

DE30 LONG TREND CHANCESWe set to allow rgis to hit the support level before any entry due to chances with high volume

US 10Y TREASURY: a bit of correction Two weeks ago U.S. Treasury yields were under a strong impact of weaker-than-expected non-farm payrolls data. The market reacted with a strong move toward the level of 4,2%. However, during the previous week some corrections in the level of yields occurred, as expected. The market digested the data and moved yields toward the 4,3%. The 10Y yields are ending the week at 4,28%.
The week ahead is also going to be an interesting one from the perspective of data. The inflation rate for July and the producers price index for July are scheduled for a release. The market will wage this data in a sense of its potential impact on the Fed's decision to cut or postpone rate cuts in September. Inflation data are especially relevant for market participants as it will provide an overview of the spillover effect of implemented tariffs on both inflation and the U.S. real economy.

UST 10Y Technical Outlook for the week Aug 11-15 (updated daily)UST 10Y Technical Outlook for the week Aug 11-15 (updated daily)
Overnight
The yield on the US 10-year Treasury note climbed to 4.27% on Friday, marking a fourth consecutive session of increases from a three-month low earlier in the week. This uptick follows market reactions to proposed tariffs on gold bars, President Trump’s nomination of Stephen Miran to the Federal Reserve’s Board of Governors, and concerns over potential politicization of the Fed. Weak economic indicators, including a lackluster jobs report, a subdued ISM Services PMI, and rising jobless claims, have heightened expectations for an interest rate cut next month. Additionally, recent Treasury auctions for 10-year and 30-year notes suggest declining demand for US debt. Investors are now focused on the upcoming CPI report and other economic data for further clarity on the US economy’s trajectory.
Economic Release for the week www.myfxbook.com
Weekly Bias
Based on last week's market activity, the market tested the prior week's low and the previous month's low before rallying strongly to close within the prior week's range. For the upcoming week, I anticipate the market may target last week's high of 4.42%. Key economic data, including CPI and inflation figures, are scheduled for release on Tuesday. These figures are likely to introduce significant volatility, so close monitoring is advised.
**Disclaimer:**
The technical analyses provided herein are based solely on my personal analysis and are intended for my own study and reference. They do not constitute a recommendation or solicitation to buy or sell any financial instruments. Any decision made by individuals based on this analysis is their own responsibility, and I assume no liability for any losses or damages incurred as a result of using this information. It is advisable to conduct thorough research and consult with a qualified financial advisor before making any investment decisions.
US10Y & T-Bond Future - Weekly AnalysisBias For The Week:
US10Y - Bullish Up to 4.341%
T-Bond - Bearish Down To 113.25

TLT bull puternweak data for 2 months non farm payrols says us that fed probably will lower the interest rate so it will get us upside in us treasuries


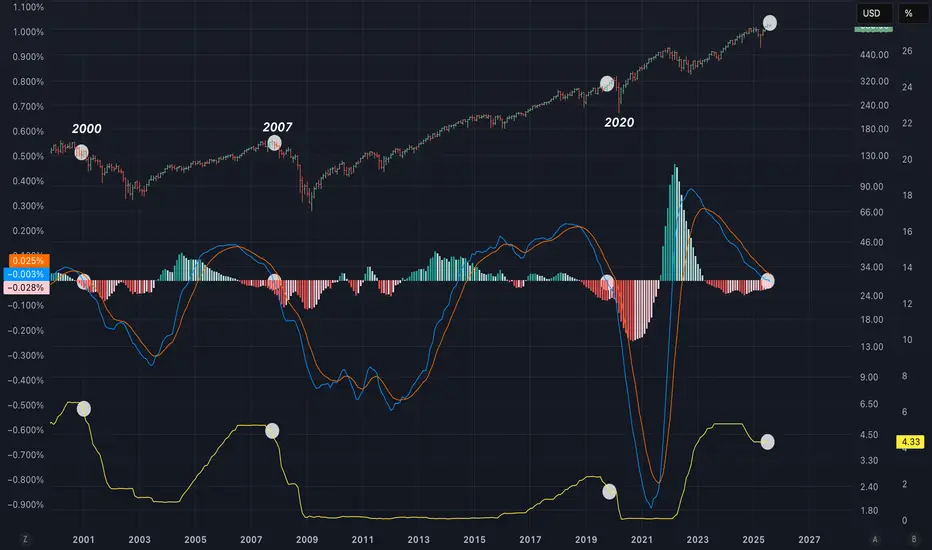
LMACD of the US02Y has just dipped bellow 0!In the past while rates have been elevated for a period of time things have gone bad for risk markets once the LMACD dipped bellow 0. Could be this time different?
US 10-year yield threatening to breach key supportAfter Friday’s US jobs report, US Treasury yields fell across the curve. This caused the benchmark 10-year yield to retest the area below the 6M resistance level at 4.417% and settle at the 3M support from 4.211%. The mentioned support level has acted as a familiar floor since May this year. Therefore, a rejection of this base could refocus attention on 4.417% as an upside target, while a breakout might open the possibility for price to decline towards a 1Y support at 4.038%.
Written by the FP Markets Research Team

US 10Y TREASURY: NFP sank yields Although the previous week was full of important US macroeconomic data, including the FOMC meeting, still the weaker than expected NFP data impacted significantly the US Treasuries market. The 10Y US benchmark yields were holding around the 4,3% level during the week, however, weak NFP data pushed yields strongly to the downside, closing the week at the level of 4,22%. The support line at 4,2% was also tested at Friday's trading session. As per current sentiment, investors are now anticipating two rate cuts till the end of this year, one in September and another one in December by 25bps. Odds for September rate cut stand at 85% since Friday.
The week ahead will be a reflective one on financial markets, as there are no important data to be released. In this sense, markets will digest both this week's posted economic data as well as macro projections from the latest FOMC meeting. Some upward corrections are possible, at least till the level of 4,3%.

US10Y Technical Analysis & Mortgage Rate Outlook Weekly. Aug. 4US10Y Technical Analysis & Mortgage Rate Outlook
(Based on Weekly Chart & Current Economic Context)
Technical View (Weekly Timeframe)
The US10Y yield is sitting around 4.21%, in the middle of a wide consolidation range that’s been developing since late 2023. This range is bounded by strong resistance near 4.62%–4.80% (purple supply zone) and support near 3.86%–4.00%.
* Trend Structure:
* We are still in a macro uptrend from the 2020 lows, but recent action has been sideways-to-lower since late 2023.
* Yields remain above the long-term uptrend line but have failed to sustain breakouts above 4.80% multiple times — showing sellers are defending that zone heavily.
* Support Levels:
* 4.00%–4.10% → First key demand zone.
* 3.86% → Major floor; losing this could trigger a larger downside move toward 3.50%–3.60%.
* Resistance Levels:
* 4.50% → First overhead supply.
* 4.62%–4.80% → Strong long-term resistance. A breakout here could signal a push toward 5.0%+ yields.
Economic & Labor Market Context
The latest labor market report showed slowing job growth but still relatively low unemployment. Wage pressures have eased slightly, hinting that labor-driven inflation is cooling. However:
* Inflation remains above the Fed’s 2% target, making the central bank reluctant to cut rates aggressively.
* The bond market is pricing in fewer rate cuts in 2025 than previously expected, keeping yields elevated.
* The Fed’s tone remains “higher for longer” until inflation shows more decisive softening.
Mortgage Rate Implications
Mortgage rates tend to follow the 10-year Treasury yield plus a spread of roughly 1.8%–2.0%.
* If 10Y Stays Near 4.20% → 30-year fixed mortgage rates likely hover around 6.0%–6.2%.
* If 10Y Tests 4.80% Resistance → Mortgage rates could climb toward 6.8%–7.0%.
* If 10Y Breaks Below 4.0% → Mortgage rates could fall into the 5.8%–5.9% range.
Given the Fed’s cautious stance and sticky inflation, a sustained drop below 6% mortgage rates in the near term looks unlikely unless we get a meaningful deterioration in economic growth.
My Thoughts
* Short-term (1–2 months): Likely range-bound between 4.0% and 4.62% until a major macro catalyst (CPI, Fed policy shift) forces a breakout.
* Medium-term (3–6 months): If economic data continues to soften, yields could drift toward 4.0% and help mortgage rates ease modestly. If data surprises to the upside, a retest of 4.80% is likely.
* Mortgage Rate Forecast: Expect 30-year fixed rates to stay between 6.0% and 6.6% for the rest of summer, with downside limited unless the Fed signals an earlier pivot.
UST 10Y Technical Outlook for the week Aug 4-8 updated dailyUS Treasury 10Y Technical Outlook for the week Aug 4-8 (updated daily)
Overnight
The yield on the US 10-year Treasury note dropped sharply by nearly 20 basis points to 4.25% on Friday, hitting a three-month low, driven by revised labor market data indicating significant weakness. Nonfarm payrolls for July increased by only 73,000, far below the expected 110,000, with prior data revised downward by 258,000 jobs for the previous two months. These figures highlighted the adverse effects of tariff threats and economic policy uncertainty, challenging earlier perceptions of a strong US labor market. As a result, market expectations shifted, reducing the likelihood of a Federal Reserve rate cut in September and limiting anticipated cuts to two for the year. Additionally, President Trump’s imposition of 39% tariffs on Switzerland, effective next week, and new tariffs on the EU, Japan, and Korea, effective immediately, further pressured yields. The Treasury’s announcement of increased buybacks for notes, bonds, and TIPS also contributed to the decline in yields.
Economic Release Aug 4 to 8 www.myfxbook.com
Weekly Outlook
Last week’s market has been very volatile. Yield has closed below prior week’s low and may continue to reach the previous month’s low of 4.187% . There are lots of noise in Trump’s administration from firing of the National statistician to fed governor Adriana Kuger resignation and Nuclear talks. These might affect the market in the coming days.
**Disclaimer:**
The technical analyses provided herein are based solely on my personal analysis and are intended for my own study and reference. They do not constitute a recommendation or solicitation to buy or sell any financial instruments. Any decision made by individuals based on this analysis is their own responsibility, and I assume no liability for any losses or damages incurred as a result of using this information. It is advisable to conduct thorough research and consult with a qualified financial advisor before making any investment decisions.
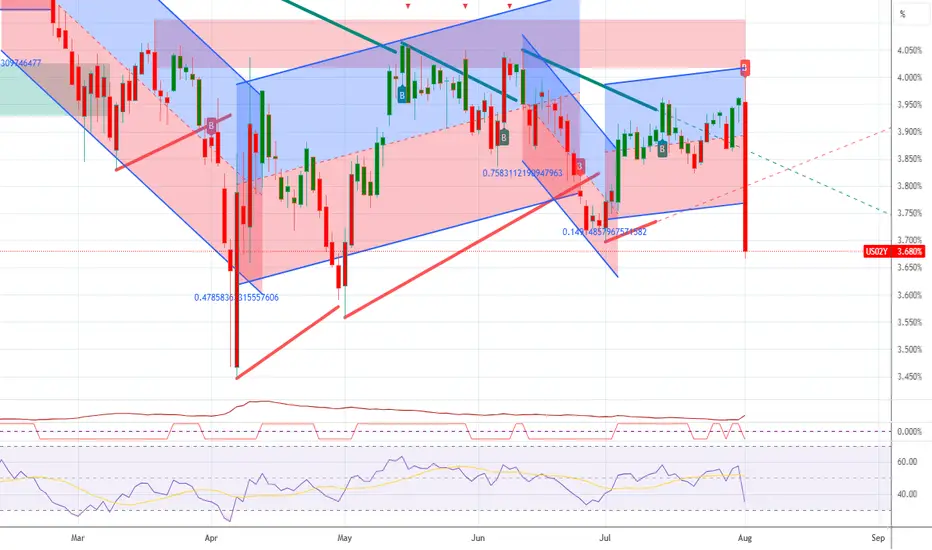
US02Y LongUS02Y Long on the regression break.
I am considering the other bond markets as this has already moved a long way.