Bitcoin - Downtrend will continue to 109,000! Alt-season OctoberBitcoin and altcoins have been crashing in the past 2 weeks! Is there any hope for a bull market, or has the bullish cycle ended? In this analysis I will tell you my personal opinion, and if you haven't seen my previous very successful analysis on Bitcoin, you can do it right now! Because it's highl
Crypto market

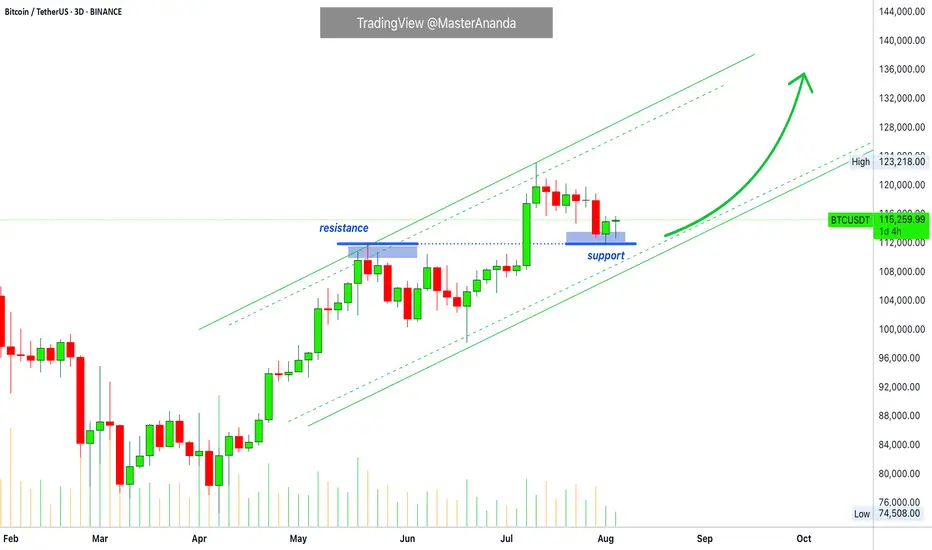
Bitcoin Update • Resistance Turned Support · TOP Altcoins ChoiceTraders hedge for a Bitcoin drop below $100,000?
Meanwhile, Bitcoin is rising trading above 115K. Resistance turned support.
The last all-time high turned out to work as support this time.
The retrace from 123,000 to 115,000 amounts to a 6.5% decline, which simply means that Bitcoin is trading at
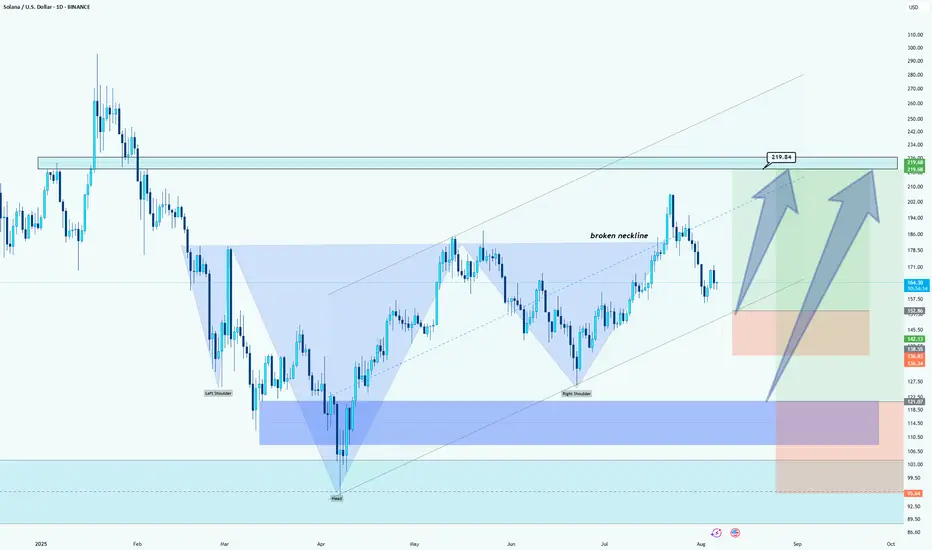
Solana (SOL): Bullish Continuation after Neckline BreakoutWhat I see:
Chart Patterns (Head and Shoulders): The chart illustrates a classic "Head and Shoulders" pattern. The left shoulder, head, and right shoulder are formed, and the neckline (the blue dashed line) has been broken, which suggests that the price could rise towards the target zone above
TradeCityPro | Bitcoin Daily Analysis #146👋 Welcome to TradeCity Pro!
Let’s dive into Bitcoin analysis. In this analysis, I want to take a look at the higher timeframes since conditions in the lower timeframes haven't changed much compared to yesterday, and it’s a good idea to review the broader picture.
📅 Daily Timeframe
In this timeframe

Ethereum Breakout Targeting $3,705ETH/USD 1H Analysis:
Price broke out of the falling wedge pattern and is showing signs of bullish reversal. Key resistance levels are at $3,581 and $3,647, with a target set at $3,705. Support holds near $3,555. Potential for upward continuation if momentum sustains.

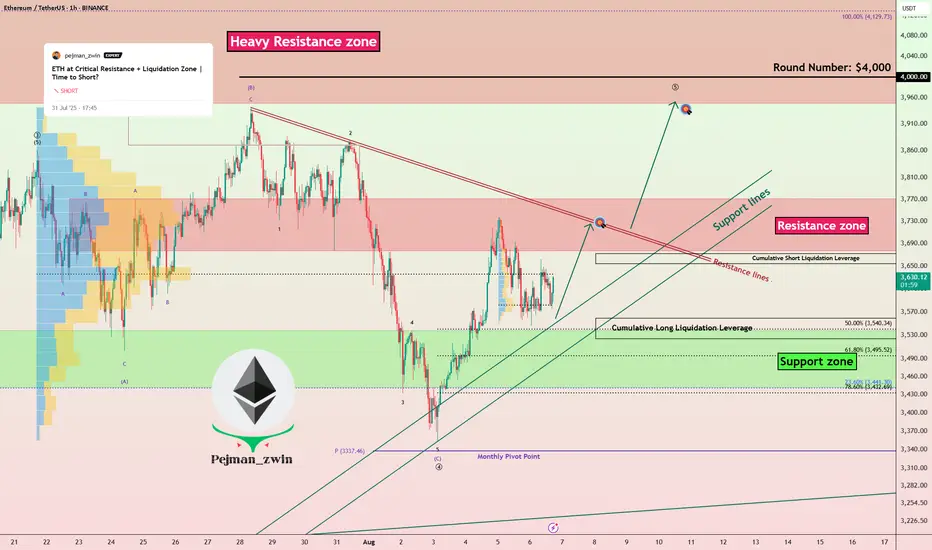
Ethereum Ready to Attack Resistances — Time to Long ETH?Ethereum ( BINANCE:ETHUSDT ) fell to the Support zone($3,538-$3,442) and Support lines as I expected in the previous idea .
Ethereum is currently trading near the Support zone($3,538-$3,442) , Support lines , and Cumulative Long Liquidation Leverage($3,559-$3,524) .
In terms of Elliott
BCH May Be The Next MYX - 5-10x Coin TL;DR – BCH is lining up a classic supply-shock + utility-boom setup.
Halving has already cut new coins 50 %, while CashTokens + May-25 upgrade unlock real smart-contract demand. Fees are still < $0.01 so merchants keep onboarding, and Wall-Street-backed EDX just gave institutions a clean on-ramp

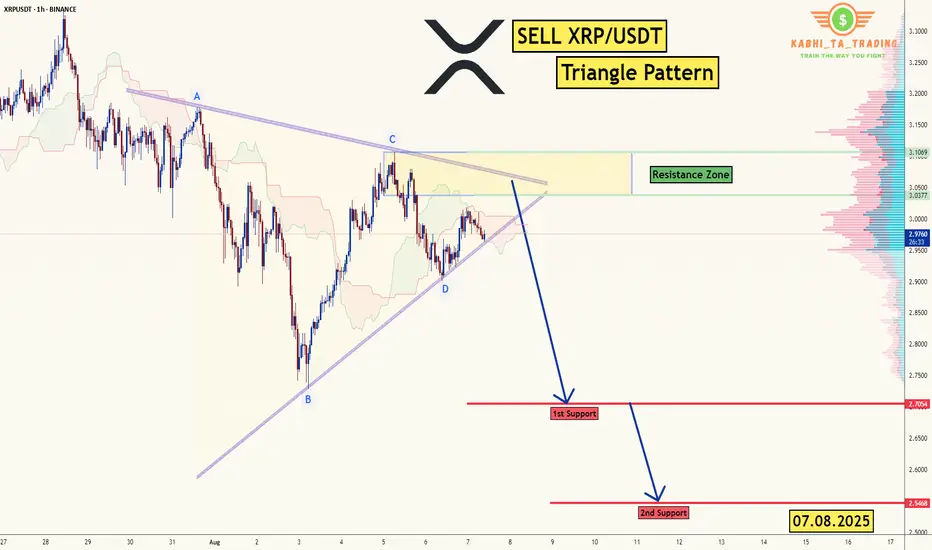
XRP/USDT -H1 - Triangle Breakout (07.08.2025)The XRP/USDT Pair on the H1 timeframe presents a Potential Selling Opportunity due to a recent Formation of a Triangle Breakout Pattern. This suggests a shift in momentum towards the downside in the coming Days.
Possible Short Trade:
Entry: Consider Entering A Short Position around Trendline O
Litecoin’s Bearish Signal: LTC dropped nearly 10%.Litecoin’s Bearish Signal: LTC dropped nearly 10%.
Litecoin formed a bearish harmonic pattern on the daily chart, completing near 129.20. This setup hints at a potential deeper correction or bearish wave—though that still needs confirmation.
Right after the pattern completed, price showed a stron

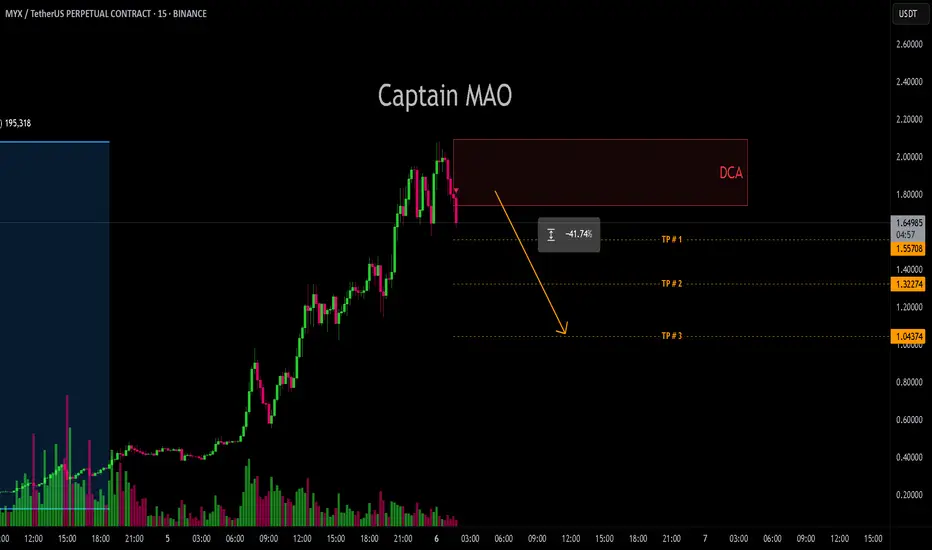
MYX/USDTThe past three days have been historic for MYX, with the token surging over +1500%, marking one of its most explosive moves to date. However, such parabolic rallies rarely sustain without a significant correction, and early signs of buyer exhaustion and weakness are emerging at the current zone.
Wi
See all popular ideas
Community trends
Crypto collections
All coinsTotal value locked rankDeFi coinsGainersLosersLarge-capSmall-capMost tradedMost addresses with balanceMost daily active addressesMost transactionsHighest transaction volumeLowest supplyHighest supplyMost expensiveMost volatileDevelopment activityAll-time highAll-time low52-week high52-week lowSee all