Crypto market

M Sell/Short Setup (4H)Considering the filling of the MUSDT price gap and the reaction to the originating order block, along with the formation of an FVG at the lower part of the chart, we can look for sell/short opportunities.
Targets and stop loss are marked on the chart.
At the first target, secure partial profits and move the stop loss to breakeven.
Do not enter the position without capital management and stop setting
Comment if you have any questions
thank you

SOL mid-term TASolana is still very bearish on mid-term trend, as well as long-term there's no change in direction. Daily time frame is strictly bearish and currently Solana is entering the bearish area again, which may pull the price deeper to the previous lows around $90ish area.

Ethereum Is Compressing After Repeated Sell-OffOn the H1 timeframe, Ethereum continues to show a clear bearish structure, defined by a series of sharp impulsive sell-offs followed by weak, overlapping consolidations. Each prior bounce has failed to develop into a meaningful recovery, and price continues to form lower highs, confirming that sellers remain in control. The current sideways movement near 2,840 is corrective in nature, not a base for reversal.
Structurally, ETH is displaying a classic bearish pause: volatility expansion to the downside, followed by tight compression with declining momentum. This type of price behavior typically precedes continuation, not reversal. As long as price remains capped below the recent breakdown area, the probability favors another leg lower, with downside liquidity sitting below the current consolidation range.
From a macro and U.S. policy perspective, Ethereum remains under pressure from the same forces weighing on broader crypto markets. The Federal Reserve’s restrictive monetary stance, elevated real yields, and a relatively firm USD continue to drain liquidity from risk assets. In addition, ETH lacks a near-term narrative strong enough to offset macro headwinds, especially in an environment where capital remains selective and risk appetite is subdued.
Bottom line:
Ethereum is not building strength it is absorbing supply after repeated sell-offs. Until macro conditions ease or ETH reclaims key resistance with acceptance, rallies should be treated as temporary pauses within a broader bearish sequence, with downside continuation remaining the higher-probability scenario.

Bitcoin Is Stabilizing After the Sell-OffOn the H4 timeframe, Bitcoin is currently trading inside a clear range, bounded by a well-defined support zone near 85,200 and a resistance zone around 90,500. The sharp drop from resistance confirms strong sell-side pressure at the highs, while the subsequent bounce from support shows that buyers are still defending key demand. However, price action in the middle of the range remains overlapping and corrective, signaling balance rather than trend continuation.
From a technical structure perspective, BTC has not yet reclaimed any major lower high. The current recovery leg is shallow and lacks impulsive follow through, suggesting it is a reactive bounce, not a trend reversal. As long as price remains below the 90,500 resistance band, upside moves should be treated as range rotations. A failure to hold above the mid-range would open the door for another test of the lower support zone, where liquidity is concentrated.
From a macro and U.S. policy standpoint, conditions continue to weigh on crypto markets, including Bitcoin. The Federal Reserve remains in a restrictive policy regime, keeping interest rates elevated and liquidity tight. High real yields and a strong USD environment reduce the attractiveness of non-yielding and high-risk assets like BTC. In addition, ongoing uncertainty around U.S. fiscal dynamics and regulatory pressure keeps institutional flows cautious, limiting upside momentum.
Bitcoin is not breaking down aggressively, but it is also not ready to trend higher. This is a range-bound market shaped by macro headwinds and liquidity restraint. Until BTC can reclaim resistance with acceptance — or macro conditions shift decisively toward risk-on the higher-probability path remains rotation within the range, not a sustained breakout. Patience and respect for structure remain critical here.

Ethereum Is Still Under Sell-Side ControlOn the H4 timeframe, Ethereum remains firmly embedded in a bearish market structure, defined by a sequence of lower highs and lower lows. Each rebound is shallow and corrective, failing at clearly marked resistance levels around 3,260 → 3,170 → 3,020 , which confirms that sellers continue to defend supply aggressively. These stepped reactions lower are characteristic of distribution within a downtrend, not accumulation for reversal. The current bounce from ~2,830 lacks impulsive strength and remains below reclaimed structure, keeping downside risk active.
From a price-structure perspective, ETH is now trading in a weak recovery leg after a sharp sell-off, with price vulnerable to another rejection below 2,860–2,900 . As long as ETH fails to reclaim 3,020 with acceptance, any upside should be treated as a sell-side rotation rather than a bullish signal. A break back below the current base would expose the major support zone around 2,700–2,650 , which acts as the next liquidity magnet on the chart.
From a macro and U.S. policy standpoint, conditions remain unfavorable for crypto, including Ethereum. U.S. monetary policy is still effectively restrictive, with real yields elevated and liquidity expansion limited. The Fed’s stance of keeping policy tight for longer continues to suppress risk appetite, especially for high-beta assets like ETH. In addition, ongoing regulatory uncertainty and risk-off positioning into year-end reduce speculative inflows, reinforcing downside pressure rather than supporting a sustainable recovery.
Ethereum is not forming a confirmed bottom it is still operating under sell-side dominance. Until price reclaims key resistance levels and macro liquidity conditions improve, the higher-probability path remains range → rejection → continuation toward lower demand . Patience is critical here; the edge lies in respecting structure, not anticipating reversal.

BTC/USDT 4H chart📉 Trend and Structure
H4 Trend: Downtrend / Downtrend Consolidation
Sequence of lower highs + lower lows from around 95k
Currently, the price is below key resistance levels; the market has not regained its upward structure.
🟩 Key Chart Levels
Resistance
94,596 – Very strong resistance (upper range zone)
91,600 – Local resistance / consolidation center
90,748 – Flip level (former support → resistance)
Support
88,385 – Short-term support (already tested)
85,226 – Current price reaction zone
83,596 – Key structural support
80,646 – Last line of defense (if 83.6k falls)
📊 RSI (14)
RSI ~40–45 → Lack of strength Buyers
No bullish divergence
RSI has not returned above 50 → trend remains bearish
📉 Stochastic RSI
Recently in the overbought zone → downward trend
This confirms a correction/further weakness
No confirmation of an upward impulse
🧠 What does price action say?
Last candle: strong upward rejection
No follow-through after bounces
Any upward breakout is sold
📌 Scenarios
🔴 Baseline scenario (more likely)
Consolidation / further decline to:
83,600
and with market weakness even 80,600
Shorts have an advantage below 88,400
🟢 Alternative scenario (bullish)
Conditions:
H4 close above 88,400
Then breakout and hold at 90,700
Only then:
Targets: 91,600 → 94,600
Without this = only corrections in a downtrend

Litecoin - Long-Term Bearish Structure, New Cycle Low ExpectedDuring previous bull runs (2017 and 2021) , Litecoin consistently made new all-time highs , breaking above prior peaks. However, an important historical pattern stands out: each bear market formed higher lows , suggesting long-term range compression.
At the current stage, this structure appears to be changing. Price remains in a prolonged consolidation phase, and a bear flag has formed on the monthly timeframe, which is a classic bearish continuation pattern following a strong downside impulse.
Based on the overall market cycle structure and historical behavior, I expect a breakdown below previous bear market lows, with a new cycle bottom forming in the $24–20 range.
Key factors:
Clear bear flag on the 1M timeframe
Lack of a sustained uptrend since the 2021 peak
Weak bullish momentum and distribution structure
Market cycle dynamics
Cycle outlook:
2026 is expected to be a bearish year, potentially marking the final phase of this downtrend and the establishment of a macro bottom.
Invalidation:
A sustained breakout and hold above the upper boundary of the monthly bear flag would invalidate this bearish scenario.
This idea is designed for long-term traders and investors who analyze the market through cycle behavior and macro structure, rather than short-term price fluctuations.

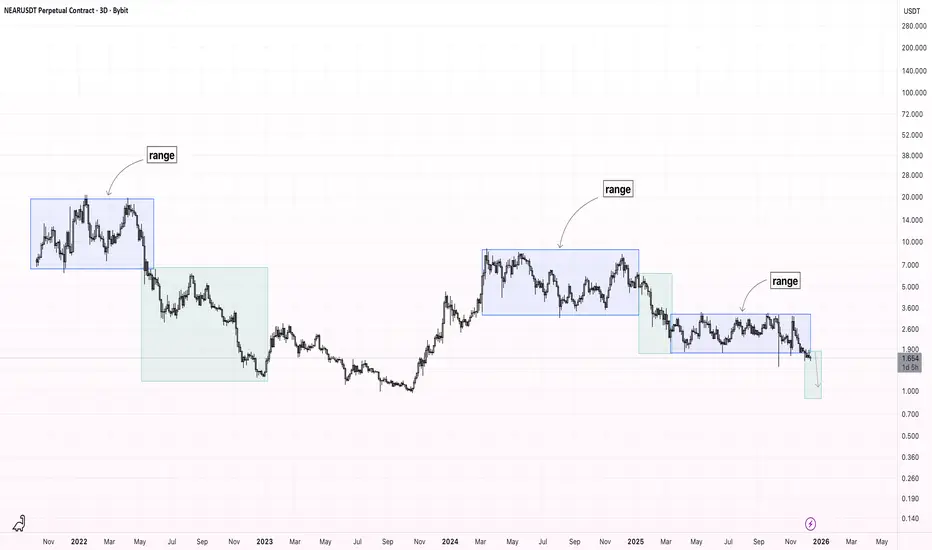
NEAR - Range-Based Market Structure – Bearish Breakdown Price action is predominantly range-bound.
Throughout the chart, price forms clear consolidation ranges, followed by directional moves after range breakouts.
Currently, the latest range has been broken to the downside, confirming bearish continuation. Structure remains weak below former range support, which is now acting as resistance.
Expectation: continuation of the downside move toward the following levels:
$1.25
$1.00
$0.90
As long as price stays below the broken range, bearish bias remains valid.
Rising Channel Breakdown → Waiting for Better Buy Prices on SUISUI has been moving inside a well-defined rising channel on the higher timeframe, forming higher highs and higher lows. However, price is now trading near the lower boundary of the channel , showing signs of weak momentum and potential breakdown.
Historically, a loss of the rising channel support often leads to a deeper corrective move, especially after an extended uptrend. Current structure suggests that downside continuation is more likely before any sustainable bullish scenario.
📌 Key points:
Long-term ascending channel
Price approaching / losing channel support
Increased risk of trend exhaustion and correction
🎯 Downside targets:
Target 1: $0.60
Target 2: $0.25
🛑 Conclusion:
At current levels, buying SUI is not attractive from a risk-reward perspective. A better strategy is to wait for deeper pullbacks and signs of stabilization near the mentioned targets before considering long positions.
This is a patience trade — better prices are likely ahead.

BNB — Ascending Channels, Shakeout Pattern & Bull Market OutlookIn 2018 BNB formed a clear ascending channel. After moving inside this structure for several years, the market experienced a sharp shakeout in March 2020, which became the final capitulation before a major trend reversal. By late 2020 the price broke out above the channel, confirming the beginning of a strong bull market.
Since 2021 a new ascending channel has been forming. I expect a corrective move toward the lower boundary of this channel in the $300–$350 area. A similar shakeout to what happened in March 2020 may occur again around 2026, potentially acting as a final reset before the next major uptrend.
After this pullback, the next bullish phase could begin, with long-term targets in the $4,000–$5,000 range.
Key points:
2018: formation of the first ascending channel.
March 2020: sharp shakeout → final reset before the bull run.
Late 2020: breakout above the channel → start of the bullish cycle.
2021–present: formation of a new ascending channel.
Expected: retrace to $300–$350 + possible 2026 shakeout.
Long-term target: $4K–$5K after the new bull run begins.

SOLANA to 185$!🟩 SOLANA LONG SETUP – Elliott Wave + PA
After a successful short as posted a couple of days ago, SOL is nearing the end of a W–X–Y corrective structure, with the final (Y)–C wave looking mature. RSI is printing a clear bullish divergence ⚠️, signaling fading bearish momentum.
The key trigger now:
➡️ A clean break above the blue channel-top trendline.
That’s the level where an impulsive reversal can launch 🚀.
Quick Highlights:
• 🌀 Corrective pattern nearly complete
• 📉 RSI bullish divergence forming
• 📈 Break above blue line = long confirmation
• 🎯 Impulsive upside likely once breakout holds
Watching for that breakout to flip bias from defensive to aggressively bullish.

BTC | 4HCRYPTOCAP:BTC — Quantum Model Projection
4H Zoom-In | Reversal Structure in the Very Late Stage
BTC has continued to decline in Minor Wave 2, reaching very close to the 0.786 Fibonacci retracement and the projected Q-Target ➤ $83,888.88 .
Minor Wave 2, unfolding as corrective structure, appears structurally complete.
The Q-Target remains intact. As illustrated on the chart, convergent equivalence lines align into a confluence zone, acting as strong support and potentially completing the trend reversal setup.
A rebound toward the origin of the Ending Diagonal ⓒ would serve as confirmation of the reversal.
The reversal thesis remains favoured, as the leading diagonal in Minor Wave 1 represents the origin phase of the Primary-degree uptrend.
Notably, from my perspective, BTC may be in the initiating stage of Primary Wave ⓹ within the 2nd Cycle (the fifth wave of Wave III).
🔖 This potential reversal has been projected since Nov. 15 during the BTC decline.
🔖 The outlook is based on insights from my Quantum Models framework. Within this methodology, Q-targets are defined as high-probability possibilities generated by the confluence of equivalence lines. These equivalence lines also act as structural anchors, shaping the internal geometry of the model and guiding the evolution of alternative paths as price action progresses.

Solana 4H chartThe "floor" has collapsed. Solana has broken below its primary value shelf, leaving a massive amount of "Last Receiver" volume trapped above current prices. We are now in price discovery mode to the downside, searching for the next institutional bid zone.
The Institutional Data
Current Price: 117.89 USDT
The "Line in the Sand" (POC): 137.89
Note: This is now major resistance.
Trend Filter (AVWAP): 172.16
Status: Price is trading -31% below the institutional average. The trend is firmly bearish.
Volatility Bands (Statistical Extremes):
-1σ (Breakdown Point): 137.57
-2σ (Reversion Target): 102.98
The Narrative: "Trapped Liquidity"
Look at the Volume Profile (the green horizontal bars on the left). The massive cluster of volume between 130.00 and 145.00 represents traders who bought the "dip" over the last few weeks.
Since price is now 117.89, every single one of those positions is underwater. These are the "Last Receivers."
If price attempts to rally back to 137.89 (POC), these trapped traders will likely sell to get out at breakeven. This creates a "Supply Wall." Until 137.89 is reclaimed, any rally is a selling opportunity for institutions.
The Trade Plan
🐻 Bearish Continuation:
We are currently in a "Low Volume Node" (thin air). Price can slip quickly through this zone.
Target: We are looking for a flush into the -2 Standard Deviation Band at ~103.00. This is the statistical extreme where mean reversion often occurs.
🐂 Bullish Reversal (Invalidation):
Do not try to catch the falling knife here.
We need a confirmed 4H close back above 137.57 (reclaiming the Value Area). Only then does the bias flip neutral.
Verdict: Cash is a position. Wait for the reaction at 103.00 (-2σ).

Is #KSM Ready to Recover or will Bears Drag it Further Down? Yello Paradisers! Is #KSM setting up for a nasty flush toward new lows, or are we about to witness a fakeout trap before a bigger move? Here's what the # Kusama chart is showing us:
💎#KSMUSDT is currently trading within a clearly defined symmetrical triangle, with the price consistently being rejected from the descending resistance trendline. This structure has broken down, and as of now, the 50EMA is acting as dynamic resistance, reinforcing the bearish bias.
💎The current price of #KSMUSD is $7.75, sitting right below the strong resistance around the $9.32 zone, where the descending trendline aligns with heavy volume on the visible range. As long as price trades below this $9.32 invalidation level, the bearish setup remains valid. A rejection from this level, combined with a 50EMA retest, would further confirm downside continuation.
💎Next key level to watch is the moderate support zone at $6.65, a potential short-term bounce area. However, the real demand lies lower, with major support at $4.95, where we could see aggressive buyers stepping in. This zone also coincides with the previous swing low and would likely trigger liquidation of late long entries, making it a potential reversal zone if the market reaches there.
💎To flip the structure bullish, #KSM needs to break and hold above $9.32. That would invalidate the descending channel and could spark a rapid move toward the next volume cluster above $10.50. Until then, every retest of resistance remains a potential short opportunity for experienced traders.
Trade smart, Paradisers. This setup will reward only the disciplined.
MyCryptoParadise
iFeel the success🌴

BTC @ 68kthe buys we are currently expecting on BTCUSD is just an inducement on the monthly timeframe.. the real demand zone lies below

UNI Weekly Analysis On the weekly timeframe, UNI has undergone a deep corrective phase and is now trading at a level worth close monitoring. From a broader market perspective, this structure suggests that altcoins may be entering a mid-term investment opportunity phase.
As long as the current price level holds, spot-based positioning becomes favorable. A strong support zone is identified at
4.8
and maintaining this level could allow UNI to initiate a recovery move toward the first upside target 7 $

$BTC Daily Range Battle Between Bulls & Bears! CRYPTOCAP:BTC remains bearish on all timeframes.
On daily TF, it has been range-bound for the past 28 days chart shown is a “noise-free” mean only candle bodies are considered, no wicks, so it’s easier to read.
- Range High: 93,430
- Range Low: 84,738
As long as price respects range low and daily candle closes above it, there is still a chance for CRYPTOCAP:BTC to push upwards towards mid-range and possibly range high.
However, if price closes below the range low, higher probability of sweeping previous wick candle low (at 80,641) increases, and body-wise support around 76,322 may be tested.
Keep in mind, this is a “do-or-die” zone bcoz December was mostly a low-volume, manipulated month. There is a chance this month may also remain range-bound.
Remember, crypto is not a stable market patience is key. Those without patience cannot survive here. +5% CRYPTOCAP:BTC pump often causes altcoins to pump +10-15%, and inexperienced traders may think it’s an alt season and buy near the top.
When CRYPTOCAP:BTC retraces -5%, alts can retrace -20-25%, leaving portfolios stuck.
Tip from my side: You can take trades, but never trade without a proper stoploss.

BTCI'm expecting a strong reaction in the body of the bullish engulfing candle. If it falls too deep and doesn't recover, I'll cancel the order.

BTC UpdateETF outflows seem to be really hurting shitcoin, it keeps dropping during US market hours. Flipped some IBIT puts today, figured it wouldn't hold the inflation pump.
Daily indicators are still trending down, I'm not gonna go long until daily indicators go oversold again.

BTC Liquidity Sweep/Daily FVG - Setting Up Bullish ContinuationBTC is currently trading above a clear pool of sell side liquidity resting around the 72.5k region. This level aligns with a higher timeframe daily fair value gap, making it a strong draw on price rather than a sign of weakness.
The current price action suggests the algorithm is in the process of seeking lower liquidity before continuation. Several inefficiencies and imbalances remain unfilled on the way down, reinforcing the expectation for a controlled draw lower into this zone.
A move into the 72.5k daily FVG would represent a rebalancing phase, not a breakdown of market structure. Once sell side liquidity is taken and price achieves equilibrium, bullish momentum is expected to return.
This area is best viewed as a higher timeframe accumulation opportunity, with the broader objective remaining a continuation toward all time highs after liquidity has been cleared. Patience is required, but the targets and roadmap are clearly defined.

GOLD WILL SEE THE LIGHT YEAR’s AHEAD…. On a long term Breakout.Well As we saw the Data today being positive for the metals and equally the expectations of rate cut’s ahead getting strong Gold has created a direction of a High predicted earlier ..on a break above 4357… finally ending up to a High of $4374 levels. Well it’s a SIGN’s of a Bullish 2026 ahead where we can see it breaking levels earlier given 4515 to a 4850 this coming year. World economies have not been performing the best with Region’s like the Europe’s of the world and equally the struggling West..TARIFF’s What we see in the coming years is a focus TRANSITION more toward’s the Bric’s economy where we can see a De Dollarization in the pipeline…equally The Asia’s, The Russia’s.. Latin America,s and the yellow continent might takeover the world power’s IN THIS SHIFT .. As we See Gold and equally Silverine once used as the only trade currency during the Queen’s Decree time’s are seeing the light of this day while we are trying to hold our economie’s with parallel currencies as the crypto which might write off badly if we see the de dollarization.. as we see the depth of its rise and fall as it goes on… Uncertain‼️ Though it has been good for the Trading community as always.
Gold will see the light of the day coming year and years ahead.. till we see such uncertain Geopolitics attracting wars to control Energy commodity power’s. HERE SILVERine can be the Man Friday call it the common man’s wealth creation year’s to come.. equally diversified into commercial and industrial use which has become a Necessity today and coming year’s. SHORTAGE of supply is the key to these Metal’s performing and Balancing economies with central banks buying it regularly to to look after their economy. I Hope we have gathered what we see ahead during this turmoil of world Geopolitics. Accumulation is the 🔑 to success.. THE LOW IT GET’s more lucrative it get’s …GATHER these Metal’s …. As we Welcome 2026✌️✨✨🪙

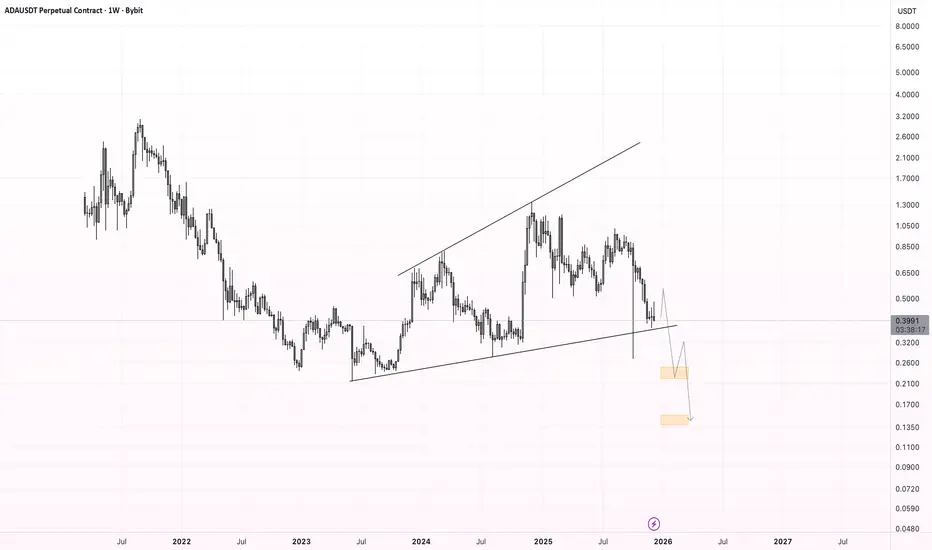
ADA - Bearish Expanding TrianglePrice is trading within a broadening (expanding) triangle , with higher highs and lower lows indicating increasing volatility and distribution. The structure favors a bearish resolution , and I’m expecting a breakdown below the lower trendline to confirm continuation to the downside.
Expectations:
Breakdown from the expanding triangle → acceleration lower.
Downside Targets:
🎯 $0.25
🎯 $0.15
As long as price stays below the upper boundary, the bearish scenario remains dominant.