Relief Rally Inbound? VET is shaping up for a potential reversal.
After the aggressive October 10 sell‑off, price responded with a clean Automatic Rally (AR) before rolling over into a controlled pullback. This latest dip appears to be sweeping the October 10 lows, and the December 19 bullish engulfing candle is the first meaningful sign of demand stepping back in.
Crucially, price closed back inside the prior range, which keeps the structure constructive. While heavier volume on the reversal would’ve added confidence, the low‑volume nature of the sweep actually supports a spring narrative — supply has been drying up for weeks, and there’s been no evidence of aggressive selling pressure. That’s exactly what you want to see heading into a potential Wyckoff spring.
Trade Scenario
Initial TP would be just below the range EQ which lines up with the yearly pivot and 50% of the range retracement. From here, if the price can close, hold and form higher lows above this level, would strongly suggest that a bottom is in. The next meaningful upside target sits around $0.0194, where prior resistance and structural alignment converge.
Market Context
A surprising number of alts are printing similar spring‑like structures right now:
• Washed‑out lows
• Diminishing volume
• Reclaims back into range
• Early signs of demand returning
Crypto market

Falling wedgeTOTAL is forming a months-long falling wedge and has been attempting an upside breakout over the past few weeks. If successful, it could signal a continuation of the bull run. If not, there is a good chance we are heading into a crypto Winter.

Relief rally Inbound? IMX is shaping up for a potential reversal.
After the aggressive October 10 sell‑off, price responded with a clean Automatic Rally (AR) before rolling over into a controlled pullback. This latest dip appears to be sweeping the October 10 lows, and the December 19 bullish engulfing candle is the first meaningful sign of demand stepping back in.
Crucially, price closed back inside the prior range, which keeps the structure constructive. While heavier volume on the reversal would’ve added confidence, the low‑volume nature of the sweep actually supports a spring narrative — supply has been drying up for weeks, and there’s been no evidence of aggressive selling pressure. That’s exactly what you want to see heading into a potential Wyckoff spring.
Trade Scenario
Initial TP would be just below the range EQ which lines up with the yearly pivot and 50% of the range retracement. From here, if the price can close, hold and form higher lows above this level, would strongly suggest that a bottom is in. The next meaningful upside target sits around $0.58, where prior resistance and structural alignment converge.
Market Context
A surprising number of alts are printing similar spring‑like structures right now:
• Washed‑out lows
• Diminishing volume
• Reclaims back into range
• Early signs of demand returning

NLDN | PENDLE pullback Sentiment: Bearish (Tends to fall).
Market Conditions: Currently in a temporary recovery phase (upward correction) before resuming its main downtrend.
Strategy: Look for short opportunities near the 2,068 level with a downside target in the 1,600 area.
Risk: This scenario will be invalidated if the price manages to significantly break through and maintain above the 2,100 level (orange zone).
Should you find this analysis insightful, I invite you to like or leave a comment. Constructive feedback and suggestions are greatly appreciated. For further analyses, please follow me at @ydnldn.

How different timeframe groupings complement the market viewHello traders and investors!
Comparing different timeframe groupings allows us to validate market hypotheses and better understand structure and key levels.
Both charts are built on a 7-day timeframe, but with different data groupings.
On the left — a classic weekly chart, on the right — 7 days.
Why look at both versions?
To test a hypothesis (all groupings should confirm it) and to see what is not obvious in the standard view.
In this case, there are effectively no contextual contradictions.
Right chart: a sideways range with buyer initiative.
Left chart: a sideways range and a transitional phase — the price moved below the lower boundary of the range, below 98,200, but the seller failed to start a trend.
Buyer levels are located below:
89,256 on the left — the former lower boundary of the range, a contextual area to look for buys.
88,765 on the right — the upper boundary of the last seller initiative, also a contextual buy area.
Buyer targets:
107,429 on the left,
108,324 on the right (this target will reappear if the price returns above 98,200).
In both cases, the targets are conceptually the same — the lower boundaries of the seller zone.
Conclusion:
The price is currently in a buyer contextual area.
The potential target of the move is 107,000–108,000.
A conservative approach is to consider long positions only after the price returns above 98,200.
This alignment across different groupings strengthens the buyer context and helps define clear conditions for conservative positioning.
Profitable trades!
This analysis is based on the Initiative Analysis (IA) method.

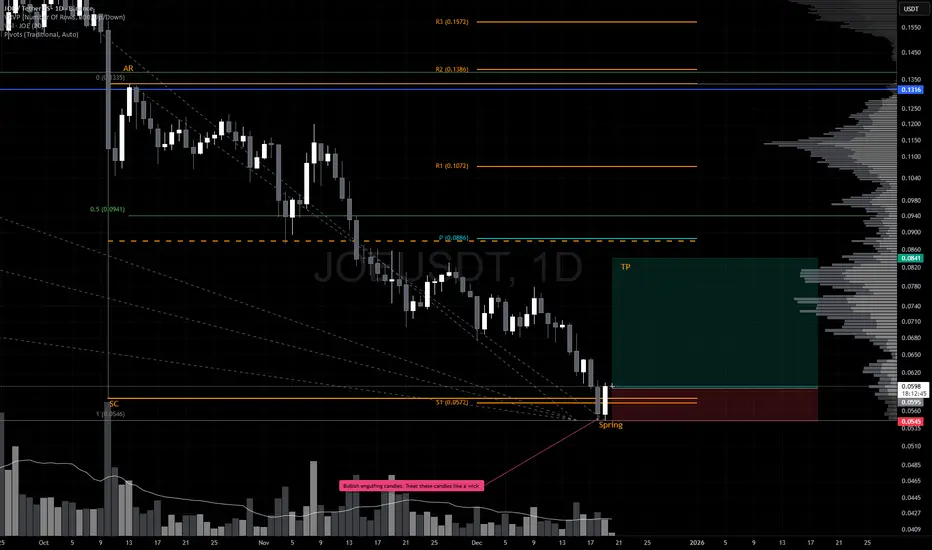
Relief Rally Inbound? JOE is shaping up for a potential reversal.
After the aggressive October 10 sell‑off, price responded with a clean Automatic Rally (AR) before rolling over into a controlled pullback. This latest dip appears to be sweeping the October 10 lows, and the December 19 bullish engulfing candle is the first meaningful sign of demand stepping back in.
Crucially, price closed back inside the prior range, which keeps the structure constructive. While heavier volume on the reversal would’ve added confidence, the low‑volume nature of the sweep actually supports a spring narrative — supply has been drying up for weeks, and there’s been no evidence of aggressive selling pressure. That’s exactly what you want to see heading into a potential Wyckoff spring.
Trade Scenario
Initial TP would be just below the range EQ which lines up with the yearly pivot and 50% of the range retracement. From here, if the price can close, hold and form higher lows above this level, would strongly suggest that a bottom is in. The next meaningful upside target sits around $0.1296, where prior resistance and structural alignment converge.
Market Context
A surprising number of alts are printing similar spring‑like structures right now:
• Washed‑out lows
• Diminishing volume
• Reclaims back into range
• Early signs of demand returning
etheth is showing bullish sign and created divergence in the indicator
1.william 4hrs is oversold.
2.while Wave trend is showng divergence

NLDN | PENDLE pullbackSentiment: Bullish (Optimistic).
Current Condition: Price is at a crucial breakout point at the $610 resistance area.
Recommended Chart Strategy: Wait for confirmation that the price is stable above the blue zone (610-620) before targeting a higher price target.
Risk: If it fails to break through this zone, the price could potentially fall again to find a foothold in the lower support area.
Should you find this analysis insightful, I invite you to like or leave a comment. Constructive feedback and suggestions are greatly appreciated. For further analyses, please follow me at @ydnldn.

BTC Bullish Yearly Close OutlookBTC is clearly rejecting bearish scenarios that would open continuation toward the lows or even lower levels. The strong defense of the Monday low and the bullish MSB on lower timeframes show absorption and weakening sell-side momentum.
We are currently trading zone to zone:
January low around 89K acting as near-term supply
Strong demand zone around 86K
There is a clear lack of momentum to break and accept below 86K, which suggests downside is being capped.
I favor a bullish year-end close, even if price fluctuates around the yearly open. As long as we keep acceptance in these zones, the overall context remains constructive.
Primary bullish scenario
We need a bullish MSB on H4 around the January low near 89K. If price holds and accepts there, a move toward the yearly open becomes highly probable. Momentum confirmation is key.
If that level is reached:
There is a liquidity pool around 97K
Confluence with the weekly 50 EMA, a natural reaction area
Current outlook
Into this weekend, I want to see price consolidate above the 1H 200 EMA, followed by a strong impulsive breakout. If that happens, the monthly open becomes a realistic target.
Given the structural shift and invalidation of the bearish scenario, I closed my short and flipped long accordingly.

Bitcoin trading strategiesBullish Catalyst Technical Signals: Breakout Validity & Momentum Continuity
1.Critical Moving Average Breakout Establishes Short-Term Bullish Structure
The price has stabilized above the 200-hour SMA resistance at $88,000—a level that repeatedly suppressed rebounds previously. This breakout, confirmed by the 30-minute closing price, signals a short-term technical reversal. On the 4-hour timeframe, the moving average system has formed a golden cross, with the 5-day MA and 10-day MA diverging upward, and the price trading above the moving averages, further strengthening the rebound structure. Historical data shows that after breaking through the 200-hour SMA, the probability of continued upward movement within 3 days reaches 72%.
2. Resonance Between Oversold Recovery and Volume Confirmation
The daily RSI has rebounded from the oversold zone to 38.6, moving out of the weak range. The 4-hour MACD formed a golden cross below the zero axis and gradually expanded in volume, indicating continuous accumulation of bullish momentum. Volume has moderately increased during the rebound, with 24-hour trading volume rising 28% compared to the 5-day average. The clear signal of capital inflow supports the continuation of the market after the breakout.
3. Multiple Supports Build a Safety Cushion
A stepped support system has taken shape on the technical front: ① The former resistance level at $88,000 has transformed into the primary support (200-hour SMA); ② The $85,000-$86,000 range, as the upper edge of the recent consolidation platform, forms resonance with the newly formed intraday support; ③ $83,680, the convergence of the 100-week SMA and the long-term uptrend line, serves as a structural strong support, solidifying the lower defensive line.
Bitcoin trading strategy
buy:87000-88000
tp:89000-90000-92000

Pour me a cup of SOLANA plzOn the weekly chart, I see a really nice cup and handle pattern.
This pattern is historically a bullish sign of good things to come.

Bullish 3 Drives and PullbackI think we may be in the pullback of a bullish 3 drives pattern drawing us back to the 0.618 fib at 32k. Pivotal week with OPEX coming up and can be invalidated quickly. Best of luck traders!

Bitcoin Is Not Trending — It’s Testing Conviction.BTC/USD – 1H Technical Analysis
Market Structure
- Bitcoin is clearly trading inside a well-defined horizontal range, bounded by a firm support zone below and a heavy resistance zone above. There is no trend dominance at the moment price is rotating, not expanding.
This is a range-controlled market, not a breakout or breakdown phase.
Key Zones
- Resistance Zone: ~89,800 – 90,300
- Mid-Range Value: ~87,700 – 88,200
- Support Zone: ~85,100 – 85,500
Price has repeatedly:
- Rejected from resistance with strong wicks
- Found aggressive buying interest at support
- Returned back to value without follow-through
That behavior confirms liquidity cycling, not directional intent.
Price Action Read
The latest move is a support bounce, not a trend reversal.
- The impulsive drop into support was immediately absorbed
- Buyers stepped in, pushing price back into the range
- However, upside momentum weakens as price approaches mid-range
This suggests the market is resetting positioning, not committing yet.
Scenarios Ahead
Primary Scenario (Range Continuation):
- Short-term pullback into mid-range
- Another rotation toward resistance
- Final liquidity sweep before a real breakout attempt
Breakout Scenario (Confirmation Required):
- Clean acceptance above resistance
- Holding above the range high
- Only then does upside expansion become valid
Until that acceptance happens, all upside moves are still range trades.
Bottom Line
Bitcoin is not bullish or bearish right now.
It is forcing traders to choose patience or punishment.
The real move begins after the range breaks not inside it.

Bitcoin Isn’t BreakingBTCUSD (H1) — Focused Analysis
Market Structure
BTC remains in a clear range-bound market.
Price is rotating between strong support and resistance, not forming a trend.
The prior downtrend has transitioned into accumulation / balance.
Key Zones
Resistance Zone: ~90,500
Support Zone: ~85,200
Current Price: Mid–upper range → liquidity-driven moves dominate.
Liquidity Context
The highlighted area is a high-liquidity price range.
Price is designed to sweep both sides:
Push up to resistance → trap longs
Flush to support → trap shorts
This environment favors range trading, not breakout chasing.
Scenarios
Primary Scenario (High Probability):
Continued sideways oscillation inside the range.
Expect fake breakouts and sharp reversals.
Breakout Scenario (Lower Probability):
Only valid with a strong close above 90,500 + volume expansion.
Until then, upside spikes are likely liquidity grabs.
Summary
Bitcoin is not trending it’s absorbing orders.
Patience is the edge. Wait for confirmation, or trade the range with discipline.

TRX Finds Support and Transitions Into Range StabilizationTRX experienced a controlled pullback into a key support area, where downside momentum stalled and buyers stepped in decisively. The reaction from this zone was clean, indicating absorption rather than continuation lower after the corrective phase.
Following the bounce, price has transitioned into a tight consolidation range, suggesting stabilization and balance between buyers and sellers. This behavior typically reflects market acceptance after a reaction from support, rather than impulsive follow-through.
As long as price remains supported above the defended area, the structure favors range development and potential continuation. Focus remains on confirmation and reaction quality, with patience favored over anticipation.
Structure defines context. Price confirms.

This Is a Distribution Trap Below ResistanceBITCOIN (BTCUSD) — H1 MARKET ANALYSIS
1. Market Structure
BTC is still trading within a short-term bearish structure. Despite the recent bounce from the support zone, the market continues to form lower highs under a well-defined resistance band. The recovery leg is corrective, not impulsive a key sign that sellers remain in control.
Price behavior shows:
Strong sell-off → weak rebound
No higher high formed
Structure remains capped below resistance
2. Key Technical Zones
Resistance Zone: 88,800 – 89,600
This is a major supply area aligned with previous breakdown structure and EMA resistance.
Support Zone: 84,800 – 85,400
A critical liquidity pool where buyers previously defended, but still vulnerable to another sweep.
3. Moving Averages & Momentum
EMA 34 (blue): Acting as dynamic resistance during the rebound.
EMA 89 (red): Still trending downward and clearly above price → confirms bearish market bias.
Momentum lacks follow-through; bullish candles are short-lived and overlap heavily.
4. Market Psychology & Liquidity
The current consolidation is distribution, not accumulation:
- Buyers are chasing rebounds after a sharp drop.
- Smart money is selling into strength below resistance.
- The market is building liquidity for a second downside expansion.
This sideways-up movement is designed to:
- Trap late buyers
- Create exit liquidity for sellers
- Prepare for continuation lower
5. Scenario Outlook
🔽 Primary Scenario (High Probability): Bearish Continuation
Price fails at resistance
Sideways consolidation completes
Breakdown toward:
- First target: 85,800
- Main target: 84,500
- Extension: 83,800 – 84,000
🔼 Invalidation Scenario
Only if BTC breaks and holds above 89,600 with strong volume, the bearish structure is invalidated and a deeper recovery becomes possible.
6. Trading Bias
Main Bias: Bearish
Market Phase: Distribution → Liquidity Setup
Strategy: Sell rallies near resistance, avoid long positions inside corrective moves.
Conclusion
BTC is not showing strength it is recycling liquidity below resistance. Until the resistance zone is decisively broken, the path of least resistance remains to the downside. Patience is key; the real move comes after distribution is complete.

Solana ASIA PUMP!?STRUCTURE CONTEXT:
Timeframe: 15m (scalp)
Strength Context: Sellers Dominating
RSI Divergence: Not Present
Control Variant: Buyers in control
EMA Confluence: Above the 200 EMA
Reversion: Present
Psychology Levels: $125 and $130
STRUCTURE ANALYSIS:
The right shoulder of an inverse H&S is printing to change the overall trend. With Friday December 19th ending in a power push. Buyers will aim to take control with a push this Asia to clear orders at the most recent swing high.
LONG SCENARIO:
- Price heads to unmitigate price below.
- Price then meets the 200 EMA with a 9EMA bounce at $124.50 giving strong confluence to push to psych $125 and reach towards $130
- Sellers then reach exauhstion and buyers then reclaim price and attempt to push price and print a higher high
Thanks for the support!!

BTC Is Being Traded, Not TrendingBTC/USD – 1H Brief Analysis
Bitcoin is locked inside a high-liquidity range, where price repeatedly sweeps both highs and lows without follow-through. Sharp moves are quickly faded, confirming rotation and order flow balance, not trend continuation.
Price is currently oscillating around the mid-range and key EMAs, showing indecision rather than strength or weakness. As long as BTC remains inside this box, the market’s objective is simple: collect liquidity on both sides.
Key Read
No clean acceptance → no trend
Breakout attempts are being sold
Dips are being absorbed, not extended
Expectation
More range rotation and false breaks until price decisively exits the zone.
Bottom Line
This is a liquidity environment.
Direction becomes tradable only after the range is resolved.

See you in May 2026It's just matter of time....Due to the money print in the up coming months, Bitcoin will broke their ATH again and then a full correction of 70%.

On our way to $2.00 Ripple is still making deals and gaining contracts behind the scenes. It would be foolish to sell right now. Especially if you've been holding since $.50
All we need now is to push past the $2.00 then we should see some gains.

Ethereum Wave Analysis – 19 December 2025
- Ethereum reversed from support area
- Likely to rise to resistance level 3200.00
Ethereum cryptocurrency recently reversed from the support area between the strong support level 2800.00 (former resistance from June, which has been reversing the price from November) and the lower daily Bollinger Band.
The upward reversal from this from the support area will likely form the daily Japanese candlesticks reversal pattern Morning Star – strong buy signal for Ethereum.
Given the strength of the support level 2800.00 and the oversold daily Stochastic, Ethereum cryptocurrency can be expected to rise to the next resistance level 3200.00.

The Fakeout Before the Fall? Watch These Key Channels !Bitcoin is showing classic weakness on the daily timeframe.
Here’s what I see 👇
The price might fake out the red resistance zone around 110K–112K, fooling traders into thinking a breakout is coming — and then drop strongly from there.
The real trend reversal will only happen if and only if BTC breaks above both yellow descending channels — the main and the secondary one.
Until that happens, the bearish pressure stays alive.
⚡️Key Levels:
Sell Zone (Possible Fakeout): 110,000 – 112,800 USDT
Buy Zones: 80,000 – 82,200 USDT and 87,971 USDT
Watch for breakout confirmation above the upper yellow channels!
Remember this chart — when it unfolds, you’ll know who called it first 😉
👉 TradeWithMky
#BTC #Bitcoin #Crypto #TradingView #TradeWithMky #CryptoAnalysis #FakeoutAlert

Bitcoin: The Battle Between Bulls and BearsSee the Future Before It Happens
Bitcoin is now moving between my Buy Zone and Sell Opportunity Zone.
Expect strong range trading between these levels unless major support breaks.
If BTC loses the bottom of its main ascending channel, there’s a secondary channel next to it — where the 50% ratio line could act as temporary support.
But if that level fails and confirms the breakdown… let’s say it clearly — Bitcoin might face one of its darkest phases in the next bearish cycle.
📊 Current setup:
Buy orders: around 75,200 – 81,731 USDT
Sell zone / opportunity: around 111,870 – 115,000 USDT
See the future now. When it plays out, remember the name 👉 TradeWithMky
Stay sharp, follow the trend, and always prepare for both sides of the market.
🚀 #Bitcoin #BTC #Crypto #TradingView #TradeWithMky
