XMR USDT SHORT SIGNAL📢 Official Trade Signal – XMR/USDT
📉 Position Type: SHORT
💰 Entry Price: 438.00 (Limit Order)
🎯 Take-Profit Targets (Partial Exits):
• TP1: 426.30
• TP2: 412.44
• TP3: 396.81
• TP4: 382.95
• TP5: 367.00
• TP6: —
🛑 Stop-Loss: 448.50
📊 Timeframe: 15m
⚖️ Risk/Reward Ratio: Favorable
💥 Suggested Leverage: 5× – 10×
🧠 Technical Analysis Summary
XMR is trading below a key resistance zone near 440, showing clear bearish rejection on the 15-minute timeframe.
Market structure is shifting bearish with lower highs, and selling pressure is increasing.
Downside liquidity zones align precisely with our TP levels:
426.30 → 412.44 → 396.81 → 382.95 → 367.00
A confirmed move below TP1 significantly increases the probability of continuation toward deeper targets.
⚙️ Trade Management Rules
✔ Take partial profit at TP1
✔ Move SL to Break-Even once TP1 is hit
✔ Trail SL as price reaches lower targets
✔ No re-entry if SL is hit
✔ Confirm bearish structure before execution
📌 TradingView Hashtags
#XMRUSDT #XMR #CryptoSignal #ShortSetup
#TradingView #FuturesTrading #TechnicalAnalysis
Crypto market

BTC USDPrice is making lower highs and lower lows, showing weakness.
BTC got rejected from the 90.5k area and failed to hold above 88k, which turned into resistance.
Now price is below the key support zone, so sellers are in control.
What this means:
As long as BTC stays below 88k, downside pressure remains.
Likely move is a liquidity sweep toward lower supports.
Levels to watch:
Resistance: 87.6k–88.6k
Support targets: 86k first, then 85k
Trend changes only if BTC reclaims 88.6k with a strong 1H close.
This view is based on technical analysis concepts for learning purposes.
This explanation is meant only to understand market structure, supply–demand, and price behavior, not as trading advice.

$UNI is sitting on a major long term demand zone, and historicalUNI is sitting on a major long term demand zone, and historically every time price respected this base, it delivered a strong upside move, the last comparable setup resulted in a ~156% pump. Right now, the focus is clear: support lies at $4.70–$5.26 with deeper demand at $3.30–$4.10, while $7.18–$7.80 remains the key resistance that must break to unlock real upside.

BTC HTF 2026 V2The second scenario i'm watching is a redistribution that takes out the range high again and mitigates the supply immediately. It's not my preferred scenarion, since the distribution that got put in already looks good on timeframes like the weekly. A lot of possible outcomes, but i'm just waiting for the confirmations of the models that present itself, so i'm ready.

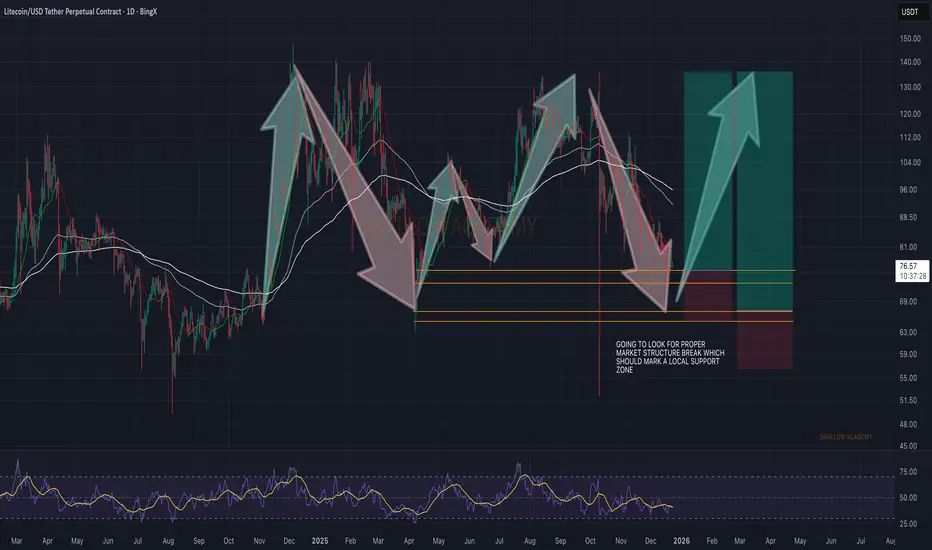
Litecoin (LTC): Looking For Market Structure Break | Bullish AFLTC has been moving in a clear up–down sequence with strong impulsive moves on both sides. Right now we’re coming from a downtrend, and the focus is on seeing a proper MSB form, which would mark a local support zone.
Once that MSB appears and buyers step in with control, this would signal a potential trend shift. That’s where we start looking for continuation to the upside, following the same type of move we’ve seen in previous cycles on this chart.
Swallow Academy
Binance Coin (BNB): Looking For Break of 200EMABNB is getting pressed between the support zone below and the EMAs above, which is creating a clear zone of pressure. Price has very little room left here, so a volatile move is likely.
Bias stays slightly in favor of buyers. We’re looking for a clean break and acceptance above the 200 EMA. Once buyers manage to secure that level, that would open the door for a long continuation toward the upper zone.
Swallow Academy

Curve DAO - CRV price analysisCRYPTOCAP:CRV is approaching an interesting accumulation zone
From a technical perspective, OKX:CRVUSDT shows signs of controlled downside pressure, often seen before impulsive upside moves driven by market makers.
🔑 Key confirmation level: $0.42–0.43
A successful breakout and consolidation above this zone would signal a trend shift.
📊 Mid-term target: $1.10
At this level, #Curve market cap grows from ~$0.5B to ~$1.5B — still relatively undervalued for a long-standing project
🚀 Holding above $1.10 opens the path toward ATH levels near $6.8.
❓Do you expect CRYPTOCAP:CRV to confirm the breakout, or is more accumulation ahead?
______________
◆ Follow us ❤️ for daily crypto insights & updates!
🚀 Don’t miss out on important market moves
🧠 DYOR | This is not financial advice, just thinking out loud

Fluctuating upwardsCore Bullish Drivers
1.Macro Liquidity Tailwinds Provide a Floor: The Federal Reserve has embarked on an interest rate cut cycle and signaled continued easing through 2026, with the released liquidity underpinning risk assets. The "stealth quantitative easing" effect proposed by Coinbase analysts is gradually taking shape. As the Fed shifts from balance sheet reduction to net liquidity injection, it is expected to drive capital flows into the crypto market, providing the momentum for Bitcoin to break through the key psychological level of $90,000. Meanwhile, an uptick in U.S. initial jobless claims or weaker-than-expected CPI data intraday will reinforce dovish expectations, further boosting bullish sentiment.
2.Robust Support from On-Chain Value Zone: Bitcoin’s current MVRV Z-Score stands at 1.17, close to the long-term premium buying range of 1.10. Historical data shows that positions entered at this level yield an average annual return of 40%, attracting long-term capital to accumulate on dips. A dense buy wall exists in the $83,000–$85,000 range, which represents the cost basis of a large number of recent buyers, forming a strong technical support level. With the current price hovering above $88,500, bulls have ample buffer room.
3.Leverage Bubble Deflation Reduces Downside Risks: Open interest in the futures market has fallen back to April lows, with excessive leveraged positions already cleared out. Market froth has been fully squeezed, laying the groundwork for stabilization and upward movement within the current range. Additionally, 30% of Bitcoin’s circulating supply is held by long-term holders such as institutions. This segment of supply remains relatively stable, reducing the likelihood of sharp intraday sell-offs.
Bitcoin trading strategy
buy:87000-88000
tp:89000-90000-92000

XRP Breakdown Loading...Are You on the Right Side of the Market?Yello Paradisers, are you prepared for what could be a brutal XRPUSDT reversal? If you missed the latest fake breakout above $1.96, this might be your last chance to position smartly before the market punishes the late entries.
💎After multiple rejections, XRPUSDT is once again trading within a heavily manipulated resistance zone. Price action shows clear signs of exhaustion after sweeping liquidity above the previous highs. The inducement move was textbook, dragging in breakout traders just before reversing hard. This kind of move typically signals smart money is offloading positions while retail gets trapped.
💎We’ve already seen multiple internal structure shifts, including an internal Change of Character (I-ChoCH) and Break of Structure (I-BOS). These are strong bearish signals on the lower timeframes, especially when combined with a Fair Value Gap (FVG) rejection at the golden pocket between the 0.5 and 0.618 Fibonacci retracement levels. Unless XRP can close a strong candle above the $1.96 resistance, this move looks more like distribution than continuation.
💎From here, the first downside target sits at the $1.8262 support level. However, if that zone fails to hold, we’re eyeing a deeper move towards the major support around $1.7450–1.7500. That’s also where a large pool of liquidity sits, marked on our chart as "$$$" making it a likely magnet for price. This zone could serve as the next point of interest for accumulation, but only if approached with patience and precision.
💎Right now, emotions are your biggest enemy. Don’t get tempted by hype or fear of missing out. Stick to your levels, respect invalidation, and let the market come to you.
🎖But it never is, and never will be a free ride. Make sure you play it smart, Paradisers; The next 6–9 months will be juicy for some and painful for others. Discipline, patience, robust strategies, and trading tactics are the only ways you can make it long-term in this market.
MyCryptoParadise
iFeel the success🌴

How Important is this week's close?If the OBV weekly closes with a double top, there's a big dip coming. Or we keep climbing for like the next year from here.

BTC/ISD)Bullish trend analysis Read The captionSMC Trading point update
Technical analysis of BTCUSD – Daily (1D) chart using SMC + Fibonacci + EMA mean-reversion logic.
⸻
Market Context
• Higher-timeframe bias: Bullish (macro)
• Long-term structure still intact despite the pullback
• Current move down = deep corrective phase, not confirmed trend reversal yet
• Price is trading below EMA 50, but reacting near EMA 200 + HTF support
⸻
What Happened (Why BTC Dropped)
• Liquidity taken at the October high
• Sharp impulsive sell-off → distribution + stop-hunt
• Price retraced into a high-confluence discount zone
⸻
Key Demand / Accumulation Zone (Blue Area)
~85,000 – 92,000
This zone is important because it aligns with:
• Fib OTE zone (0.705 – 0.79)
• Previous daily demand
• Range low support
• Proximity to EMA 50 (93K) → mean reversion magnet
• Multiple long lower wicks → absorption
This suggests smart money accumulation, not panic selling.
⸻
Fibonacci Logic
Measured from major swing low → all-time high
• 0.5 & 0.62 → failed supports
• 0.705 – 0.79 → institutional rebalance zone
Textbook location for trend continuation buys
⸻
Trade Idea (Swing Long)
Buy on confirmation inside demand
• Entry: 86,000 – 90,000
• Stop Loss: Below demand (~82,000)
• Targets:
• TP1: 93,000 (EMA 50)
• TP2: 101,800 (EMA 200 / mid-range)
• Final TP: 121,000+ (marked target point / liquidity above highs)
RR potential: 1:4 to 1:6 (swing setup)
⸻
Confirmation Signals (Very Important on BTC)
Wait for at least one:
• Daily or 4H bullish engulfing
• Strong rejection wick from demand
• 4H CHoCH after sweep of lows
• Compression → expansion behavior
⸻
Invalidation
• Daily close below ~82,000
• Acceptance below demand with strong volume
If that happens → bullish swing idea is invalid, and market likely seeks lower HTF liquidity.
⸻ Mr SMC Trading point
Summary
This is a high-timeframe accumulation & continuation setup:
• Deep discount
• Fib OTE + demand
• EMA mean reversion
BTC rewards patience and HTF discipline — confirmation > prediction.
If you want, I can:
• Break this into a 4H / 1H execution plan
• Help you build a BTC-specific SMC swing model
• Or map bearish alternative scenarios for risk control
Please support boost this analysis

BTC HTF 2026 V1Some time has passed since my last post about BTC. I'm still expecting the technical target of 74k to get hit. From there i will look for a reaccumulation into the previous accumulation range to then retrace into the created structure supply above. Thats 1 of the 2 scenarios i'm watching for now, until i see different developments.

Idea of The Market Structure We play along these lines if this OBV doesn't form a double top. In other words, a double top on the OBV breaks down this structure. Something should finally give this week.

$TAO Will Hit 500$ ??? 📌With the drop in CRYPTOCAP:BTC , the price of GETTEX:TAO is decreasing significantly ✅
📌We can expect a bullish reversal for GETTEX:TAO from the strong support zone marked below ✅
📌If there is a bullish reversal from that range, GETTEX:TAO will reach $500+ again 🔥🚀

Bitcoin Price Analysis: What's Going On in Late December 2025?Hey everyone , Bitcoin is hovering right around $88,000 – give or take a few hundred bucks depending on the exchange. It's been a wild ride this month, honestly. We saw it flirt with $89,000-90,000 earlier, but it's pulled back a bit amid all the holiday thin trading and macro jitters.I've been watching the charts closely, and right now, BTC is stuck in this frustrating downtrend channel that started after the big highs earlier in the year (remember that $126,000 peak?). It's been chopping sideways mostly between $85,000 and $94,000 after bouncing off that solid psychological level at $80,000.
Weekends have been interesting – price keeps teasing the top of the channel, but then it rolls over and starts sniffing out lower liquidity pockets, like around $86,000-$88,000 where we are now.
The Big Picture: Still Bearish Short-Term?
Look, the overall market structure feels bearish to me in the near term. We've got lower highs and lower lows forming, and the order flow isn't screaming "bulls in control" yet.If we start seeing more consistent selling pressure pushing toward $85,000, I wouldn't be shocked to see a breakdown there. That could open the floodgates – trigger some liquidations around $80,000 and send us tumbling into that Low Volume Node (LVN) zone between $75,000 and $78,000.
That area was a key pullback spot back in April, so it might hold as decent short-term demand.
But if it doesn't... well, things could get messy quick.
Deeper Supports and Potential Buyers
Way down below, there's this wider High Volume Node (HVN) from $60,000-$70,000. That's where a lot of volume piled up historically, and I suspect there are some passive buyers – you know, long-term spot holders – sitting there. If they don't panic and start absorbing the supply, selling pressure could fade, and we might see a shift.
But honestly? Selling doesn't look exhausted yet.
Could We Bounce Back to $100K?
Don't get me wrong, I'm not all doom and gloom. If those lower zones hold strong – especially the LVN at $75K-78K – we could get a nice relief rally. That might flush out some trapped sellers from the November highs and push us back toward $100,000 to squeeze the shorts.
It's happened before. Crypto loves liquidating everyone eventually.
Quick Scenario Breakdown
Here's how I'm thinking about it right now:
🔴 Bearish case (my base for now): Break $85K → liquidations → test $75K-78K LVN → possible slide to $60K-70K if panic sets in.
🟠 Sideways grind: We just chop in this $85K-$94K range through the holidays – low volume, no real direction.
🟢 Bullish surprise: Strong hold at lower supports + shift in order flow → rally to liquidate sellers at $100K+.
At the end of the day, anything can happen in this market – that's the beauty (and frustration) of it. I've been trading crypto long enough to know that being flexible is the only way to stay profitable. Right now, I'm cautious on the upside, watching order flow and those key levels.
If you're trading this, manage your risk – stops below recent lows if long, or above recent highs if positioning short.
What do you guys think?
Bullish reversal incoming, or more pain first?
Drop your takes below.
Stay safe out there!

Chuck's coin teetering on the brink of a dramatic plunge to 9cCardano, along with many other high market cap tokens, certainly stands out.
As we find ourselves in the crypto bear market,
I would argue that we have actually been in one for quite some time now.
The rapid declines can catch newcomers off guard.
Meanwhile, those who have weathered several cycles tend to quietly withdraw and wait for BTC to undergo its usual year-long downturn.
Will BTC hit a bottom again next November, similar to the previous four-year cycles?
The odds still seem to favor a yes.
Even with the influx of institutional capital.
This situation simply means that the OGs finally have the liquidity to cash out completely.
And they have been doing so with great intensity since the summer.
Unfortunately, altcoins do not benefit from this liquidity, and there are hardly any profitable wallets aside from those of founders and VCs who essentially created the coins or acquired them for a pittance.
Retail investors will likely bear the brunt of falling for the hype once more.

BTC long So we left some liquidity lower here as 4h & 1h synchronised imb and targets before looking for shorts is 4h imb up there

RENDER / USDT – Trade ideaPrice is still trading inside a range after a strong sell-off.
Market shows indecision, but structure is holding for now.
This trade is already active, based on confluence with the Total Market Cap analysis.
Market conditions align with a potential relief move, as long as structure holds.
Technical View
* Price is reacting around a key support zone
* Multiple rejections from range lows
* Break above range highs could confirm continuation
* Loss of support would invalidate the setup
Do you expect continuation from this range or a breakdown first?
MrC

DIA ( SPOT)BINANCE:DIAUSDT
DIA/ USDT
Entry range (0.266- 0.277)
SL 4H close below 0.2533
T1 0.30
T2 0.31
T3 0.35
T4 0.39
3 optional extra targets on the chart
_______________________________________________________
Golden Advices.
********************
* collect the coin slowly in the entry range.
* Please calculate your losses before the entry.
* Do not enter any trade you find it not suitable for you.
* No FOMO - No Rush , it is a long journey.

BTCUSD: Massive Bullish Reversal from Support? Targeting 90kBitcoin has recently undergone a sharp correction, but it is now finding significant interest at lower levels. Based on the price action, we are seeing a classic "double bottom" or "W-formation" developing right above a crucial demand zone.
Technical Breakdown
The Bounce: BTC rejected the lower levels near 87,000 and is currently carving out a reversal pattern.
Support Zone: Current support is holding firm around 88,500.
The "Strong Support" Target: If momentum continues, the primary objective is the liquidity zone at 90,388.
Invalidation (Stop Loss): If the price drops below the recent swing low and breaks the 86,243 zone, this bullish thesis is invalidated.
Trade Setup
Entry Idea: Looking for a successful retest of the immediate support before the next leg up.
Target: 90,388 (Previous supply zone).
Risk/Reward: With a tight stop loss at the bottom red zone, the R:R on this trade is excellent.

December 23 Bitcoin Bybit chart analysisHello
It's a Bitcoin Guide.
If you "follow"
You can receive real-time movement paths and comment notifications on major sections.
If my analysis was helpful,
Please click the booster button at the bottom.
This is the Nasdaq 30-minute chart.
Indicators will be released shortly at 10:30 AM and 12:00 PM.
I've made rough predictions about the likely movements.
Whether the red finger or Gap 6 retraces before and after the purple finger touches seems important.
I've applied this directly to Bitcoin.
Here's a 30-minute Bitcoin chart.
Tomorrow is Christmas Eve, and the day after is Christmas Day, so I've covered two days of analysis up to the 25th.
I'll briefly summarize the key points and then move on.
*When the red finger moves,
One-way long position strategy
1. Confirm the purple finger touches once at the top (autonomous short)
Long position entry point at $87,328.6 at the bottom / Stop loss if the green support line is broken
2. If the strategy is successful, utilize the intermediate wave with the pink finger
First target for a long position: $89,398 -> Target prices in order from the top to the top.
If the pink resistance line is not broken from the current position,
it will trigger a vertical decline.
The key question today is whether the Nasdaq will retraceive Gap 6.
Also, if the price touches the first section and rebounds without breaking above the purple support line, it's most advantageous for a long position.
I've set my stop-loss level slightly loosely to the green support line.
If it holds until this point, it will become a safe sideways market.
(Check the MACD dead cross on the 6-hour chart.)
After breaking the green support line, the candlestick pattern can fall to the second section at the bottom.
The price is open to a maximum of 84.5K until the 25th.
If this section breaks, it will represent a double bottom.
Holding the light blue support line at the bottom of the second section will create the conditions for continued upward movement this month.
Please use my analysis to this point as a reference only.
I hope you operate safely, adhering to principled trading and a stop-loss level.
Will there be a Christmas Santa beam?
Have a good year-end and see you on Friday.
thank you

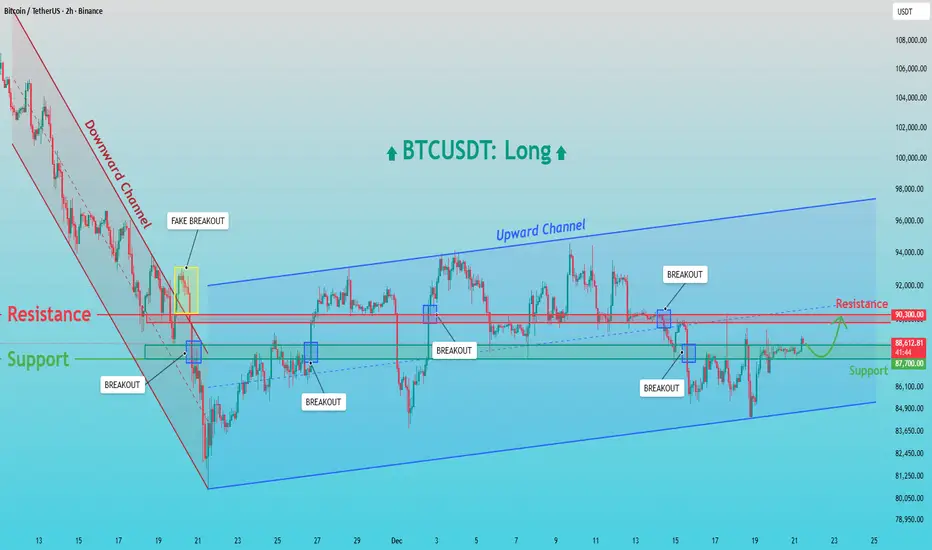
BTCUSDT: Holds Demand - Retest of 90,300 Resistance LikelyHello everyone, here is my breakdown of the current BTCUSDT setup.
Market Analysis
BTCUSDT recently transitioned from a strong downward channel into a broader bullish recovery phase. After a prolonged bearish move, price formed a base near the channel low, where selling pressure weakened. This led to a breakout from the downward channel; however, the first move above resistance resulted in a fake breakout, indicating that sellers were still active at that level. Following this, Bitcoin found strong demand around the 87,000 Support Zone, where buyers stepped in aggressively. From this area, price began to form higher lows and successfully established an ascending (upward) channel, signaling a shift in short-term market structure toward bullish control. Within this upward channel, BTC experienced several clean breakouts above intermediate resistance levels, confirming improving momentum. The key horizontal level around 90,300 acted as a major resistance, where price was rejected multiple times. Despite these rejections, the market did not break down sharply, suggesting absorption of selling pressure rather than distribution.
Currently, BTCUSDT is pulling back toward the 87,000 Support Zone, which aligns with previous resistance turned support and the lower boundary of the upward channel. Price action here remains constructive, with consolidation rather than impulsive selling, indicating that the move lower is corrective.
My Scenario & Strategy
My primary scenario remains bullish as long as BTC holds above the 87,000 support. This zone is a key demand area, and a strong reaction from here could lead to another attempt toward the 90,300 Resistance and a continuation within the upward channel. A confirmed breakout and acceptance above the 90,300 level would open the door for further upside toward higher channel targets.
However, a failure to hold the 87,000 Support Zone would signal weakness and could trigger a deeper correction toward the lower channel boundary. For now, the market structure favors long positions, with support holding and resistance as the next upside objective.
That's the setup I'm tracking. Thank you for your attention, and always manage your risk.
TOTAL Market Cap – 4H UpdateIn my previous update I highlighted a key level to watch.
That level has now been cleanly reclaimed with a strong 4H candle close, confirming strength.
Since then, we’ve seen a 50% retracement, which is a healthy pullback after the impulsive move.
With this structure in place, I’m switching my bias to bullish.
Context
Key level successfully reclaimed
Strong 4H close confirms acceptance
50% retracement completed
Multiple long setups already shared align with this higher-timeframe context
Are you positioning with the higher-timeframe bias or still waiting for confirmation? 📊👀
Please share your toughts
MrC
