$ETH 4H FractalsCRYPTOCAP:ETH 2022 4H fractals are still lining up well here.
We’ve just seen a secondary test of the trendline, which usually points to some consolidation or chop in this zone rather than an immediate breakout. Price looks like it needs a bit of time to build acceptance here.
As long as $2800 continues to hold as support, the structure stays constructive, and that keeps the higher-timeframe upside intact. If this base holds and momentum gradually rebuilds, there’s a decent chance we see a push toward the $3700 area later this quarter.
Crypto market

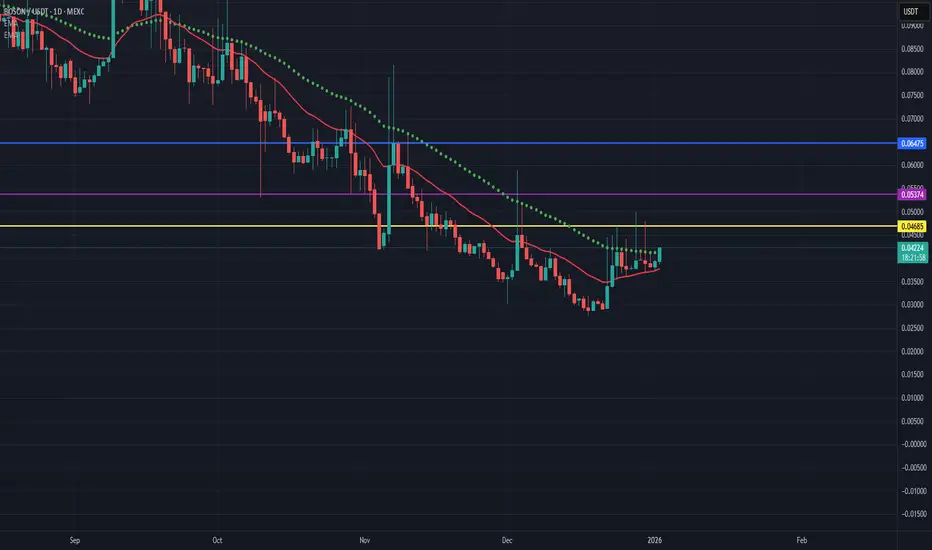
BOSONUSDT // Inverse head and shoulders formationThe chart shows an inverse head and shoulders pattern, but the formation condition is to look for closing prices above the yellow line. If this condition is met, the first target is 0.05374, which corresponds to the Fibonacci 1.414 level of the breakout. If we see closing prices above this level, the main target is 0.06475.
BTCUSD 1H Corrective Range after Supply RejectionBTCUSD 1H is trading within a corrective range after rejecting a clearly defined supply zone. Earlier bullish momentum, highlighted by higher highs, higher lows, and an ascending trendline, weakened near 90,000–90,200, where repeated rejections indicated strong selling pressure. Failure to hold above this level caused a break below the trendline, confirming a short-term structure shift. Price now forms lower highs under a descending trendline, showing controlled selling rather than aggressive liquidation, suggesting consolidation within a wider range.
Supply: 90,000–90,200 remains primary resistance and key supply. Secondary resistance lies at 88,800–89,200, aligned with recent lower highs and the descending trendline.
Demand: Immediate support is 87,200–87,000, maintaining consolidation if held. Below this, the higher-timeframe demand zone at 84,500–84,200 marks prior strong buying and the range low. Price reactions here will determine the next move.

LINK/USDT — Descending Trendline Test: Break or Rejection?LINK/USDT on the 12H timeframe is still moving within a medium-term bearish structure, but price is currently testing a major descending trendline resistance that has capped upside movement since the previous highs. This places LINK in a critical decision zone.
---
📐 Pattern & Price Structure
Primary Pattern: Descending Trendline (Bearish Structure)
Price has been forming consistent lower highs and lower lows.
Price is now approaching a dynamic resistance (yellow trendline), which has:
Acted as strong resistance for months
Become a key validation level for either continuation or reversal
Additionally, price is consolidating in a tight accumulation range below the trendline, often a precursor to a strong breakout or breakdown.
---
🧱 Key Levels
Resistance:
13.55 – 14.70 → Minor resistance / supply zone
16.50 → Next structural resistance
18.50 – 19.90 → Extended bullish targets after a confirmed breakout
23.40 → Major resistance / previous distribution area
Support:
12.40 – 12.00 → Nearest support & demand zone
11.70 → Critical support (bullish invalidation)
11.10 → Extreme support / last defense
---
🟢 Bullish Scenario
Price breaks and closes decisively above the descending trendline on the 12H timeframe.
Ideal confirmation includes:
Strong candle body
Trendline retest holding as support
Potential upside targets:
14.70 → 16.50
Extension toward 18.50 – 19.90
A valid breakout would:
End the lower-high structure
Signal a medium-term trend reversal or bullish continuation
---
🔴 Bearish Scenario
Price fails to break the trendline and prints a clear rejection (long upper wick / bearish engulfing).
A breakdown below the current range opens downside potential toward:
12.00 retest
Extension to 11.70 – 11.10
As long as price remains below the descending trendline, the primary bias stays bearish / corrective.
---
🧠 Conclusion
LINK/USDT is trading at one of the most important technical zones in recent months.
Price reaction at the descending trendline will define the next major move:
Breakout → structure shift & bullish opportunity
Rejection → continuation of the downtrend
Patience and confirmation are key to avoiding false breakouts in this area.
---
#LINK #LINKUSDT #Chainlink #CryptoAnalysis #TechnicalAnalysis #Altcoins #Downtrend #Trendline #Breakout #CryptoTrading

MUBARAKUSDT | Potential ReversalHello traders,
I'm seeing early bullish signs on MUBARAK's chart. Internal downtrend break + hidden bullish divergence on OBV
Entry, SL, TP marked on chart.
Good Luck

SOL/USDT – Accumulation or Continuation? Key Support!SOL/USDT on the 8-hour timeframe is still moving within a bearish corrective structure / broader downtrend, characterized by a series of lower highs and lower lows since the rejection from the 230+ area.
Currently, price is trading inside a strong historical demand zone at 127–121, which previously acted as a major accumulation and bounce area.
Price is now consolidating above this demand zone while pressing against a descending trendline, making this area a critical decision zone for the next major move.
---
Pattern & Price Structure
1. Descending Trendline (Bearish Pressure)
The descending trendline remains valid and unbroken
Each recovery move continues to be capped by this trendline
Indicates seller dominance is still present
2. Demand Zone / Support Base (127 – 121)
The yellow box marks a strong demand zone
Multiple lower-wick rejections indicate active buying interest
Price is forming a base / consolidation range above support
3. Compression Pattern (Range Tightening)
Price is compressed between:
Dynamic resistance (descending trendline)
Static support (demand zone)
This structure often leads to a high-momentum breakout
---
Key Levels
Dynamic Resistance: Descending trendline
Horizontal Resistances:
144
154.5
167
177
Major Support:
127
121
Invalidation Level:
Strong close below 121
---
Bullish Scenario
The bullish scenario is valid if:
1. Price holds above the 127–121 demand zone
2. A strong candle close breaks above the descending trendline
3. Volume expansion confirms the breakout
Upside Targets:
144 (minor resistance)
154.5 (key reaction level)
167 (mid-range resistance)
177 (major resistance)
A confirmed breakout above the trendline may signal a trend reversal or bullish continuation from a base structure.
---
Bearish Scenario
The bearish scenario occurs if:
1. Price fails to break the descending trendline
2. A strong breakdown and close below 121
3. The demand zone fails to absorb selling pressure
Downside Risk:
116.8 (previous low)
Further downside could form new lower lows, continuing the broader bearish trend
---
Conclusion
SOL/USDT is currently at a critical decision area.
The 127–121 demand zone is the key level to watch:
Holding support + trendline breakout → bullish reversal potential
Demand breakdown → bearish continuation
Patience is required. Wait for clear breakout or breakdown confirmation before committing to a directional trade.
---
#SOLUSDT #Solana #CryptoAnalysis #TechnicalAnalysis #DescendingTrendline #DemandZone #SupportResistance #AltcoinTrading #CryptoMarket

Hyperliquid LongBullish Idea for Hyperliquid as it took liquidity on lower time frame, i am going long

ETH - Break out of Ascending/Symmetrical triangleETH - Break out of Ascending/Symmetrical triangle and long term trendline.
Lets see the price goes up!

BTC - Price is going up a bit and volume is declining BTC - Price is going up a bit and volume is declining.
Buyers are not interested and spiking the volume.
More buyers have to step in and fuel up buying to keep up the momentum of price to up. Or else its bearish divergence.

Ethereum Is Not Ready to Rally — This Is a DistributionHello everyone,
On the H1 timeframe, the key focus right now is not upside continuation, but the fact that Ethereum is stalling below a well-defined resistance zone after a completed impulsive move. The current price action suggests distribution and rebalancing, rather than the start of a new bullish leg.
After the strong impulsive rally that pushed ETH sharply above 3,000, price was rejected from the upper resistance near 3,030, triggering a fast corrective sell-off. That initial drop was aggressive and directional, signaling that buyers who entered late were forced to exit. Since then, ETH has recovered partially but has failed to regain acceptance inside the resistance zone around 2,980–3,000.
From a structural perspective, the market is now printing lower highs beneath resistance, with price compressing in the middle of the range. This behavior indicates that upside momentum has weakened and that buyers are no longer in control. The consolidation here is not constructive it is occurring below resistance, which favors another leg lower rather than a breakout.
Technically, the current structure aligns with a bearish corrective sequence. The sideways-to-lower drift suggests that ETH is building a base for continuation down toward the 2,900–2,880 support zone, which has acted as a demand area previously. The projected path on the chart reflects this logic clearly: a shallow bounce, followed by renewed selling pressure into support.
Resistance zone: 2,980–3,000 — repeated rejection, sellers active.
Major resistance: ~3,030 — prior impulse high and supply.
Support zone: 2,880–2,900 — next area where buyers may step in.
Only a clean breakout and sustained acceptance above the 3,000–3,030 resistance would invalidate this pullback scenario and reopen bullish continuation. Until that happens, ETH remains in a post-impulse correction phase, where downside tests are more likely than upside expansion.
Wishing you all effective and disciplined trading.

Bitcoin Is Not Breaking Out Yet — This Is Classic Box Accumu....Hello everyone,
On the H1 timeframe, the key focus right now is not chasing an immediate breakout, but recognizing that Bitcoin is still consolidating inside a well-defined accumulation box. Despite several sharp intraday swings, price continues to respect clear boundaries, signaling balance rather than trend.
Structurally, BTC has been rotating between the 86,500 support zone and the 90,300–90,400 resistance zone. Multiple attempts to push higher have stalled below resistance, while every pullback into support has been absorbed quickly. This repeated back-and-forth price action is characteristic of box accumulation, where liquidity is being built before a directional expansion.
The recent impulsive rally toward the upper range was followed by an equally sharp rejection, but crucially, price did not break down. Instead, BTC stabilized above the mid-range and began forming higher short-term lows, suggesting that sellers are losing momentum near the bottom of the box while buyers remain active.
From a price action perspective, the market is printing overlapping candles and compressed swings, confirming that this is not a trending environment yet. The projected path on the chart reflects a typical accumulation outcome: continued rotation inside the box, potential liquidity sweeps, and only then a decisive move.
Key levels to watch:
Resistance zone: 90,300–90,400 — range high and breakout trigger.
Support zone: 86,500–86,800 — range low and structural defense.
Mid-range: ~88,500 — equilibrium area where noise dominates.
A clean breakout and acceptance above resistance would confirm bullish continuation and open the door for upside expansion. Conversely, a decisive breakdown below support would invalidate the accumulation structure and shift the bias lower. Until one of these conditions is met, Bitcoin remains range-bound and in preparation mode, not trending.
Wishing you all effective and disciplined trading.

BTCUSD 15M, 30m, 1Hr Breaking upwards, alignment formingHeres another videio guys on the mighty Bitcoin.
Intraday breaking out somewhat, moving cleanly up and through a bearish order-block.
IO also explain how I use momentum indicators to confirm future price swings in the traders direction.
The True Strength Index or TSI functionality is similar to MACD but its more accurate in short term trading and it can dictate / capture the longer term trend. (* My bias and finding only. Also, never wait for cross down eg. Macd crossing down X Signal line on very high timeframes. Profits will be handed back.
Exit on other confluences like bears OBlock's but in combination with several other cue's like a bearish pinbar, trendlines etc, RSI & Stochastics are faster than MACD, & TSI, when they are pointed skywards still its a good chance what you just witnesses was a pullback and the bullish uptrend is intact.
Tomorrows trading is interesting, USD index looks to move higher, EURUSD in a short term downtrend and I think Bitcoin will stay on the heals of the USD which normally wouldn't do, why how, is its releasing from its coiling and bullish momentum still building.

ETH Compresses Between Supply and Demand On the 1H timeframe, Ethereum is trading inside a clearly defined range, capped by a strong resistance zone around 3,040–3,080 and supported by a demand zone near 2,880–2,920. Price is currently rotating around the mid-range near 2,970, showing hesitation rather than directional conviction. This positioning signals balance between buyers and sellers, not trend expansion.
From a structure perspective, the market has failed multiple times to sustain acceptance above the resistance zone. Each push into supply has been followed by sharp rejections, indicating that sell-side liquidity remains active at higher levels. The recent rebound is corrective in nature and has not yet invalidated the broader ranging structure.
On the downside, the support zone has held repeatedly, but reactions from this area are becoming increasingly overlapping and less impulsive. This behavior typically reflects absorption rather than aggressive accumulation. As long as price holds above this support, downside risk is contained, but the lack of strong follow-through limits bullish continuation.
In the near-term outlook, ETH is likely to continue range oscillation unless a clear catalyst drives expansion. A rejection from the 2,980–3,000 area would favor a move back toward the lower boundary of the range, while a clean breakout and acceptance above 3,080 would be required to confirm a structural shift toward higher prices.
From a macro context, crypto remains sensitive to broader risk conditions, including USD stability and liquidity expectations. Without a decisive risk-on impulse or volume expansion, moves into resistance should be treated with caution.
In summary, Ethereum remains range-bound and compressed. Until price decisively breaks and holds outside the 2,880–3,080 range, the market favors patience, reaction-based trading, and respect for key zones rather than directional bias.

Liquidity Builds Before the Real MoveOn the 1H timeframe, Bitcoin remains locked inside a clearly defined sideways range, bounded by a support zone around 86,700–87,000 and a resistance zone near 90,300–90,600. Price is currently trading around 88,500, which places it firmly in the middle of the range — a location that typically favors indecision rather than directional conviction.
From a market structure standpoint, Bitcoin has repeatedly failed to establish acceptance above the resistance zone. Each impulsive push into the 90K area has been met with swift rejection, signaling that sell-side liquidity remains active at the highs. These reactions confirm that the resistance is not yet weakened and continues to cap upside attempts.
On the lower boundary, the support zone has been respected multiple times, producing consistent rebounds. However, these reactions have become increasingly corrective rather than impulsive. This suggests absorption and balance, not aggressive accumulation. As long as price holds above this zone, downside continuation remains limited, but the lack of strong follow-through keeps the market range-bound.
The current price action shows compression and volatility contraction, a classic behavior ahead of expansion. Liquidity is being built on both sides of the range. A sustained break and acceptance above 90,600 would be required to confirm a bullish continuation scenario, while a clean loss of 86,700 support would expose lower liquidity pools and shift the bias decisively bearish.
From a broader macro perspective, Bitcoin remains sensitive to overall risk sentiment and liquidity conditions. With no clear macro catalyst or volume expansion visible at this stage, the market continues to favor range rotation rather than trend development.
In summary, Bitcoin is not trending it is consolidating. Until price decisively exits the 86,700–90,600 range, traders should prioritize reaction at key levels, patience, and disciplined risk management, rather than anticipating a breakout prematurely.

AIXBT/USDT – Dead Cat Bounce or Trend Reversal?AIXBT/USDT on the 2D timeframe remains in a long-term bearish trend since early 2025. Price has consistently formed lower highs and lower lows, clearly respecting a descending trendline resistance that continues to suppress upside movement.
Currently, price is attempting a technical rebound from the lower demand zone after a strong sell-off and a short accumulation phase near the end of 2025.
---
Pattern & Price Structure
Main pattern identified:
Descending Trendline / Downtrend Structure
Multiple rejections from the descending trendline, confirming seller dominance.
A small base formation near the bottom, indicating early accumulation after capitulation.
Key characteristics:
High volatility during the previous breakdown (panic selling phase).
The current bounce is still a pullback within a broader downtrend, not a confirmed reversal.
---
Key Levels (Support & Resistance)
Key Support Levels:
0.033 – 0.035 USDT → Major demand zone
0.038 – 0.040 USDT → Minor support (current price area)
Key Resistance Levels:
0.054 USDT → Minor resistance
0.069 USDT → Mid-term resistance
0.086 USDT → Strong resistance
0.121 USDT → Major resistance
0.219 USDT → Large supply zone / previous distribution area
---
Bullish Scenario
A bullish scenario becomes valid only if:
Price breaks and closes decisively above the descending trendline
Followed by a higher high and higher low structure on the 2D timeframe
Bullish targets:
0.054 USDT
0.069 USDT
0.086 USDT
0.121 USDT (extended target if momentum strengthens)
Bullish implication:
Confirmation of a medium-term trend reversal
Shift in market structure from bearish to bullish
---
Bearish Scenario
The bearish continuation remains likely if:
Price fails to break the descending trendline
Strong rejection occurs around the 0.045 – 0.054 USDT area
Price breaks back below the 0.035 USDT support
Bearish targets:
Retest of 0.033 USDT
Further downside continuation if support fails
Bearish implication:
The current rebound is only a dead cat bounce
The primary downtrend remains intact
---
Conclusion
AIXBT/USDT is currently at a critical decision zone. Price action will determine whether this move develops into:
A confirmed trend reversal (bullish breakout), or
A continuation of the dominant downtrend (bearish rejection)
Traders should wait for clear confirmation above the descending trendline before considering long positions and remain cautious of rejection scenarios below major resistance levels.
---
#aixbt #aixbtusdt #cryptoanalysis #altcoinanalysis #technicalanalysis #downtrend #trendline #supportresistance #marketstructure #altcointrading

Bitcoin triangel trap provides liquidity for smart moneyPrice broke out of a triangle with 123 pushes up to get retail traders to buy. Price then quickly drops to provide liquidity for smart money as retail traders panic and sell at the bottom. Retail buyers see the channel breakout so they buy on that, but smart money needs to shakeout the weak hands who keep selling into their uptrend move. Buy as price comes back down to retest the shakeout.
Now smart money is long and retail traders are short, which adds fuel to their uptrend once price goes back up, forcing retail to buy to close their short positions.

PNUT .07 What again ha ha ha +7,000% in just dayssthis was so all over the news
as in like the media made it like a netflix hit series
and price just went nuts in days
will it be the same this time
who knows
when meme coins are flyiinng
everything is just so right .. right
NFA

DOGE: Something Familiar is CookingThe chart explains everything. Similar patterns, similar structures. I think something is brewing right now...
Invalidated if it breaks below the support line.

Bitcoin Builds a Base Below SupplyOn the 1H timeframe, Bitcoin is currently trading inside a well-defined range, capped by a clear resistance zone around 90,000–90,300 and supported by a key demand area near 87,700–88,000. Price has recently rebounded from the lower boundary of the range, indicating that buyers are still active at support, but the market has not yet transitioned into a trending environment.
From a structure perspective, the prior impulsive sell-off broke short-term bullish momentum and shifted BTC into a range-building phase. Since then, price action has been characterized by higher lows from support, but each upside attempt remains corrective and constrained beneath resistance. This behavior suggests balance and compression, not a confirmed breakout setup yet.
The 34 EMA and 89 EMA are beginning to flatten and converge, with price oscillating around them. This alignment typically reflects neutral momentum, reinforcing the idea that the market is waiting for new information or liquidity before committing to a directional move. As long as price remains below the resistance band, upside moves should be viewed as range rotations, not trend continuation.
The projected path toward resistance represents a mean-reversion move within the range, where liquidity is likely resting near the upper boundary. A clean breakout would require strong acceptance above 90,300, supported by increased volume and sustained closes above that level. Without those conditions, the probability of rejection and rotation back toward support remains elevated.
From a macro standpoint, Bitcoin is entering a period where expectations around monetary policy in the coming year are already partially priced in. This reduces the likelihood of an immediate, sentiment-driven breakout unless accompanied by a clear shift in liquidity conditions or risk appetite. As a result, the current structure favors patience and range awareness, rather than directional bias.
In summary, Bitcoin is constructively consolidating, but still structurally neutral. The market is preparing for expansion, yet direction remains unresolved. Until resistance is decisively reclaimed, Bitcoin should be treated as range-bound, with both upside and downside scenarios remaining technically valid.

Ethereum Compresses Below Major Supply On the 1H timeframe, Ethereum is trading within a well-defined sideways range, capped by a strong resistance zone around 3,050–3,080 and supported by a demand area near 2,900–2,920. Price has repeatedly failed to establish acceptance above the upper boundary, confirming that this zone remains a dominant supply area rather than a breakout level.
The sharp impulsive rally into resistance earlier in the session was followed by an immediate rejection, forming a classic stop-run and distribution reaction. This behavior indicates that liquidity above prior highs was absorbed by sellers, not followed by continuation. Since then, price has rotated back into the range, reinforcing the market’s balance condition rather than trend expansion.
From a structural perspective, Ethereum is currently printing overlapping candles and shallow pullbacks, characteristic of range-bound price action. The 34 EMA and 89 EMA are flattening and converging, which further supports the view that momentum is neutral and that the market is waiting for a catalyst to resolve the range.
On the downside, the support zone around 2,900–2,920 has been respected multiple times. Each test has produced a reaction, suggesting the presence of responsive buyers. However, these bounces lack strong follow-through, highlighting that demand is defensive rather than aggressive at this stage.
From a macro and sentiment standpoint, Ethereum remains highly correlated with broader crypto risk appetite and liquidity conditions. With no immediate macro shock or strong risk-on impulse, price action favors mean reversion within the range rather than a sustained directional move.
In summary, Ethereum is in a clear consolidation phase between major supply and demand. A clean breakout above 3,080 with acceptance and volume would be required to shift the structure bullish. Until that occurs, rallies into resistance and dips into support should be viewed as range rotations, not trend signals.

Still Ranging — The Breakout Isn’t Here YetCOINBASE:ETHUSD continues to trade in a range-reaccumulation structure on H2. Price is holding above the 2,880–2,920 support zone, while upside attempts remain capped below the 3,060–3,100 resistance area. This behavior reflects rotation and liquidity rebalancing rather than a decisive trend move.
The EMA cluster is flattening, reinforcing the idea of consolidation. As long as support holds, the structure favors a gradual build-up for another upside attempt.
Resistance: 3,060 – 3,100
Support: 2,880 – 2,920
Range focus: 2,900 – 3,100
➡️ Primary: support holds → higher lows → rotation back toward 3,060–3,100 resistance.
⚠️ Risk: clean break below 2,880 opens a deeper pullback into the lower demand zone.

Accumulation Continues — Expansion Needs a Breakout.BITSTAMP:BTCUSD is stuck in a clear accumulation range, with price rotating between the 86,000 support zone and the 90,200–90,800 resistance area. Repeated rejections near the top of the range show supply remains active, while buyers continue to defend dips, keeping structure balanced rather than trending.
The EMA cluster is flattening, reinforcing range conditions and liquidity rotation. Directional expansion will require a clean break from this box.
Key Levels
Resistance: 90,200 – 90,800
Support: 86,000 – 86,500
Range focus: 86,000 – 90,800
➡️ Primary: hold above 86k → range continuation → push back toward 89.5k–90.8k.
⚠️ Risk: loss of 86k → downside sweep into lower demand before reassessment.

BTCUSD BTCUSD holds above key support 88,400–88,500, keeping bullish structure intact
Higher low formation confirms short-term buyer control
Price is consolidating below 89,000–89,300, indicating potential breakout build-up
A 30-min close above 89,300 can trigger upside momentum
Upside targets: 90,200–90,400, extended 90,800–91,200
Bullish bias remains valid unless price breaks below 87,450
Expect pullbacks; trend continuation favors patience over chasing
