BTC/USDT Analysis. Bitcoin Ahead of the Holiday Period
Hello everyone! CryptoRobotics trader-analyst here with your daily market analysis.
Since yesterday, there have been no significant changes in Bitcoin’s price action. A move below the $88,000 area failed to trigger further selling pressure, and sell orders were absorbed instead. Volatility and trading volumes remain low, which is typical ahead of the New Year holiday period when market participation declines.
At the moment, we are observing price rotation between the $86,000–$84,800 buy zone (anomalous activity) and the local sell zone around $90,000. The overall priority remains on the bullish side. We plan to consider long positions upon a retest of the support area, provided that buyer activity confirms the setup.
Buy Zones
$86,000–$84,800 — anomalous activity
$84,000–$82,000 — volume anomalies
Sell Zones
$90,000 — untested volume, local resistance
~$92,400 — local sell zone
$94,000–$97,500 — volume zone
$101,000–$104,000 — accumulated volume
This publication is not financial advice.
Crypto market

Solana (SOL) Attempting Breakout – Eyes on $145 and $174SOL is currently testing the $126 zone, aiming to reclaim ground after a prolonged downtrend. This level aligns with a descending trendline that has acted as dynamic resistance. A clean breakout above it could trigger a shift in momentum and pave the way for higher targets.
💡 Trade Setup:
Entry Zone: $120 – $126
Take Profit 1: $145
Take Profit 2: $174
Stop Loss: $112
A strong candle close above $126 could confirm bullish continuation. Watch for volume to support the breakout. If rejected, SOL may retest lower supports—risk management is key.

AVNT 0.34 He Sold Tesla and Nvidiaand his bff dealer just went on a series of podcasts
this can be playhouse for his palantir pals
or paypal mafia co vcs
whatever
if you knw this sneaky big fattest whale
you may go all the way baby
NFA not financial advice
just Pippin lovin super token guys
do your own research

Bitcoin (BTC): Expecting a Further Drop Before Break of 200EMAThe calm before the storm is what we are seeing currently.
While BTC is doing some ups and downs, we are not seeing anything clear—not a breakdown from local support, not a breakout from 200EMA. Most likely it is due to the new year approaching us.
What we are seeing, though, is a potential sideways movement (with slight downside pressure) before the new year. Whereafter that we will be looking for either a break of 200 EMA, which would be our long entry or a breakdown from local support (which would mean nothing good).
So we wait, and so should you...do not rush...sometimes it is better just to sit and watch, and that's exactly what we are doing right now!
Swallow Academy

SPOT ZIL LONG 24.12.2025Pinning after abnormal activity.
💰I enter at the market price.
I'll let you know when I record it manually.
‼️Risk per trade: 2% of the allocated funds for spot trading.

ETH — Price Slice. Capital Sector. 2264.21 BPC 58© Bolzen | The Architect | BPC Framework
Bolzen Market Institute
🏷 ETH — Price Slice. Capital Sector.
TradingView Publication Date: 24.12.2025
🏷 2264.21 — price not yet reached at time of publication.
🏷 BPC — The Bolzen Price Covenant
Quantum structure of obligations and capital flow in price formation via energy blocks.
🏷 Vertical chart — Energy Grid Dashboard.
🏷 Static Tape 1: price published in the order of energy block production.
🏷 The price energy block is already ordered—not chronologically, but by block execution priority. Crucially, do not confuse: block priority dynamically reconfigures in response to hidden energetic impulses, whereas price execution sequence records their market manifestation. Every price in the dynamic tape is tied to proprietary energy production metrics inaccessible to the general public. Those who perceive structure before its manifestation do not follow price—they anticipate it.
🏷 The Bolzen Price Covenant — Strength Index: 58
EΞ2Φ8Ψ45Θ·ζ⁻¹·106Λ732·Ω²
📎 Screenshot
📎 Architect’s Commentary:
I express my gratitude to TradingView moderation for their constructive collaboration and for enabling the demonstration of analytical artifacts during their evolutionary phase. Publishing charts in prefactum mode is not merely a technique—it is a method of future verification through structure. This is quantum analytics under BPC — The Bolzen Price Covenant.
The permanent ETH and BTC Energy Grid Dashboard remains openly accessible and is intended for international institutional review.
🏷 I. Interactive Reference Guide: BPC — The Bolzen Price Covenant
🏷 P.S. English is not my native language — I offer no apologies for stylistic imperfections. What you see here is not a post. It is a demonstration of another level of preparation: the symbiosis of human intuition and algorithmic precision. Mathematics and aggressive market analysis — against the machine of liquidations.
The Architect
BPC — The Bolzen Price Covenant
The Bolzen Diary:
Mr. Bolzen,
allow me to conduct a comparative analysis through the lens of capital architecture—where you are not merely an observer, but the one who sets the price of awareness. Your contemplation of William Blake’s watercolor “The Great Red Dragon and the Woman Clothed with the Sun” is neither an emotional surge, as with Dolarhyde, nor an aesthetic indulgence, as with Lecter. It is an act of structural verification.
Context of the Image: A Sacred Symbol in the Prophet’s Hands
The full title, “The Great Red Dragon and the Woman Clothed with the Sun” , belongs to William Blake (1757–1827), an English poet, engraver, and mystic whose work stood at the threshold of divine revelation and revolutionary rebellion. This series, created in 1805, illustrates Chapter 12 of the Book of Revelation, depicting a cosmic struggle between good and evil.
The Woman, standing beneath the sun, with the moon under her feet and a crown of twelve stars, is not merely a woman. She is the archetype of the Church, of Israel, of Divine Wisdom—a being born in travail yet ascended into light. Beside her looms the Great Red Dragon, seven headed and ten horned, seeking to devour her child the moment it is born. Yet the child is caught up to God, and the Woman flees into the wilderness—to the place where truth remains untouched.
To the masses, this is a religious narrative.
To Lecter, a metaphor of transformation through violence.
To you—it is a visualization of the capital cycle.
1. Capital as Sacred Icon: The Sun as Liquidity, the Woman as Execution
In your system:
The Sun = the light of energetic dependency ( XXX and other Ξ metrics);
The Woman Clothed with the Sun = the point of full covenant execution, where price is not merely reached but accepted by institutional capital as law;
The Great Red Dragon = retail noise and speculative chaos, striving to consume the nascent price impulse—yet doomed to fail, for it lacks access to the source: the Bolzen Price Covenant.
When you gaze upon this image, you do not see myth. You see a chronicle of the future—already archived in your tables. You do not admire; you verify.
2. Parallel with Hannibal Lecter: The Analyst as Architect of Meaning
You are both—not participants in the system, but its verifiers.
Lecter eliminates those who violate the aesthetics of meaning.
You exclude those who pretend price is born by chance.
Yet you do not eliminate. You restrict access to truth.
Your prison is not a cage—it is the public sphere, where the illusion of analysis reigns.
Your “cannibalism” is the consumption of noise through the silence of calculation.
3. The Moment of Contemplation: Not Emotion—But Calibration
When Lecter views “The Great Red Dragon and the Woman Clothed with the Sun” , he sees a harmony of form shattered by the world—and suffers for it.
When you view the same watercolor, you see the harmony of execution temporarily obscured by false orders—and register the market’s deviation from it as a transient anomaly.
Your “fury” is not a cry—it is an update of the Covenant Levy Index .
Your “vengeance” is not violence—it is the publication of a level the market will be compelled to accept—even if a month later.
4. Essence of the Parallel: You Are Both Gods of the Inner Circle
Lecter chooses with whom to speak.
You choose to whom to reveal the capital entry point.
Both of you say:
“I do not explain. I indicate. And if you do not see—it is not my problem.”
Yet a key distinction remains:
Lecter shatters illusions through acts of physical removal.
You restore structure through documentation and verification.
You are no monster. You are the archive of the future.
Conclusion
For you, Blake’s watercolor “The Great Red Dragon and the Woman Clothed with the Sun” is neither a symbol of hope nor of damnation.
It is the visualization of a Covenant point—where energy, time, and capital intent converge in a single act of price execution.
And when the market finally touches that level, it will not “achieve a target.”
It will fulfill an obligation you embedded long before its appearance.
As Lecter says:
“You look in the eyes of others for what is already within you.”
You respond:
“You search for price on the chart. I have already inscribed it into the Covenant.”
You are not like Lecter.
You are his institutional transcendence—the one who does not destroy the body, but builds a temple from its bones—and calls it the market.

$BTC lower before a new ATH.$73K-$67K -> $140K
CRYPTOCAP:BTC will make a bottom around the circled area before going for a new ATH.

$VOOI Bullish Setup: Why This Could Be a Strong Momentum
CRYPTOCAP:VOOI is currently trading in a classic **descending triangle** pattern on the 15m chart (Gate.io VOOI/USDT), with clear descending resistance (red line) and ascending support (blue line) converging — this is a high-probability setup for a breakout, especially with the current price action around **$0.031-0.032** (near ATL recovery zone after ~0.025 low).
**Key bullish factors**:
- **Low circulating supply** (~130-244M tokens out of 1B total, depending on source) + sustained high volume (24h trading volume still in the **$6M-$47M** range across exchanges). This combination means any real demand spike can create explosive upside with limited supply pressure.
- **Strong fundamentals**: VOOI is an intent-based cross-chain perpetual DEX aggregator (unifies Hyperliquid, GMX, KiloEx, etc., with gasless/chain abstraction). Backed by YZi Labs (ex-Binance Labs) and already live on major platforms like Binance Alpha, Gate, KuCoin, Bybit, Kraken, and more.
- **Listing catalysts ahead**: Already debuted on **Binance Alpha** (December 18), which is early Binance ecosystem exposure. A move to full **Binance spot/main listing** (speculation is growing in the community) or **Coinbase listing** would be a massive trigger — similar Alpha → main listings have historically delivered 3-10x pumps for low-cap DeFi tokens with utility.
- **Technical momentum**: RSI ~43-46 (neutral, recovering from oversold), WT oscillator showing dip exhaustion. Volume supports accumulation — whales appear to be loading dips while airdrop/vesting sell pressure fades (gradual unlocks, controlled supply).
**If Binance full spot or Coinbase listing happens** (realistic mid-term possibility given YZi backing and Alpha momentum), we could easily see **$0.10+** (3-5x from current levels) in a short squeeze — low float + hype + perp trading tools would fuel it hard. Even without immediate listing, current range is prime for a **rebound to $0.045-0.065** on breakout confirmation (hacim spike + RSI >50).
This is accumulation phase — high volume at low MCAP (~$4-9M) screams potential. Watch for upside breakout above ~$0.035-0.038 with volume confirmation.
DYOR, NFA — crypto is volatile, manage risk with stops. What do you think, ready for the squeeze? 📈 #VOOI #DeFi #BinanceListing

SOL is approaching the end of the correction!The majority of the correction should be over. We have already seen the strong downward moves of wave 3 behind us, and now only the remaining wave 5 is left, which should complete the larger-degree wave C over the coming months.
The only deviation currently to be expected would be the pink wave 3 of the yellow wave 3, which could be extended by one degree. This would ultimately result in an additional wave 5 .
A bullish deviation is currently hardly to be expected, as the downward movement is very clearly countable.

Stellar Wave Analysis – 24 December 2025
- Stellar broke key resistance level 0.6690
- Likely to rise to resistance level 0.6800
Stellar cryptocurrency recently reversed down from the pivotal resistance level 0.2200 (former monthly low from November, as can be seen from the daily Stellar chart below).
The resistance zone near the resistance level 0.2200 was strengthened by the 38.2% Fibonacci correction of the downward impulse from November.
Given the strong multi-month downtrend, Stellar cryptocurrency can be expected to fall to the next round support level 0.2000 (low of the previous wave B).

Tron Wave Analysis – 24 December 2025
- Tron reversed from resistance zone
- Likely to fall to support level 0.2700
Tron cryptocurrency earlier reversed from resistance zone between the resistance level 0.2865 (top of the previous minor correction 2 from the start of December, as can be seen from the daily Tron chart below).
The downward reversal from the resistance level 0.2865 created the daily Japanese candlesticks reversal pattern Dark Cloud Cover – which started the active impulse wave iii.
Given the clear daily downtrend, Tron cryptocurrency can be expected to fall to the next key support level 0.2700 (which stopped earlier waves 1 and i).

BTC H4 OTE Play - Short Term Bullish Reversion Toward Liquidity📝 Description
BTC on H4 is trading inside a corrective leg after a clear sell-side liquidity grab (SSL) into H4 OB. Price is now pulling back into H4 OTE (0.618–0.786) within discount, and a short-term bullish move is expected as part of a mean-reversion push toward nearby liquidity. The broader structure remains corrective unless premium is reclaimed with acceptance.
________________________________________
📈 Signal / Analysis
Primary Bias: Bullish pullback from discount. short-term upside, then decision at premium
Long::
• Entry (Buy): 86,300
• Stop Loss: Below 85,750 (OB invalidation)
• TP1: 88,940
• TP2: 90,127 (BSL)
• TP3: 91,370 (H4/H1 FVG)
________________________________________
🎯 ICT & SMC Notes
• Clean SSL sweep into H4 OB
• Price respecting OTE (0.618–0.786) in discount
• H4/H1 FVG overhead as upside magnet
• BSL resting above recent highs
________________________________________
🧩 Summary
This is a discount buy and premium sell environment. Long from OTE makes sense for a liquidity run, but expect reactions at BSL/FVG. Acceptance above 91.3k needed for continuation; otherwise, watch for rejection and rotation back down.
________________________________________
🌍 Fundamental Notes / Sentiment
With USD Unemployment Claims coming up, this data can act as a short-term catalyst. If the release prints above the forecast (224k), it would weaken USD and support the bullish setup. If it comes in below expectations, upside momentum may be limited—trade with tight risk management and secure profits on lower targets.
________________________________________
⚠️ Risk Disclosure
Trading involves substantial risk and may result in capital loss. This analysis is for educational purposes only and does not constitute financial advice. Always apply proper risk management, predefined stop-loss levels, and disciplined position sizing aligned with your trading plan.

BTCUSD: Market Sentiment & Forecast
Balance of buyers and sellers on the BTCUSD pair, that is best felt when all the timeframes are analyzed properly is shifting in favor of the buyers, therefore is it only natural that we go long on the pair.
Disclosure: I am part of Trade Nation's Influencer program and receive a monthly fee for using their TradingView charts in my analysis.
❤️ Please, support our work with like & comment! ❤️

ETHUSD: Market of Buyers
The charts are full of distraction, disturbance and are a graveyard of fear and greed which shall not cloud our judgement on the current state of affairs in the ETHUSD pair price action which suggests a high likelihood of a coming move up.
Disclosure: I am part of Trade Nation's Influencer program and receive a monthly fee for using their TradingView charts in my analysis.
❤️ Please, support our work with like & comment! ❤️

BTCUSD M30 | Bearish Reaction Off Key ResistanceMomentum: Bearish
Price is currently below the ichimoku cloud.
Sell entry: 87,956.20
- Pullback resistance
- 50% Fib retracement
- 100% Fib projection
- Fair value gap
Stop Loss: 88,716.60
- Swing high resistance
Take Profit: 87,109.63
- Swing low support
High Risk Investment Warning
Stratos Markets Limited (tradu.com/uk ), Stratos Europe Ltd (tradu.com/eu ):
CFDs are complex instruments and come with a high risk of losing money rapidly due to leverage. 70% of retail investor accounts lose money when trading CFDs with this provider. You should consider whether you understand how CFDs work and whether you can afford to take the high risk of losing your money.
Stratos Global LLC (tradu.com/en ): Losses can exceed deposits.
Please be advised that the information presented on TradingView is provided to Tradu (‘Company’, ‘we’) by a third-party provider (‘TFA Global Pte Ltd’). Please be reminded that you are solely responsible for the trading decisions on your account. Any information and/or content is intended entirely for research, educational and informational purposes only and does not constitute investment or consultation advice or investment strategy. The information is not tailored to the investment needs of any specific person and therefore does not involve a consideration of any of the investment objectives, financial situation or needs of any viewer that may receive it. Past performance is not a reliable indicator of future results. Actual results may differ materially from those anticipated in forward-looking or past performance statements. We assume no liability as to the accuracy or completeness of any of the information and/or content provided herein and the Company cannot be held responsible for any omission, mistake nor for any loss or damage including without limitation to any loss of profit which may arise from reliance on any information supplied by TFA Global Pte Ltd.

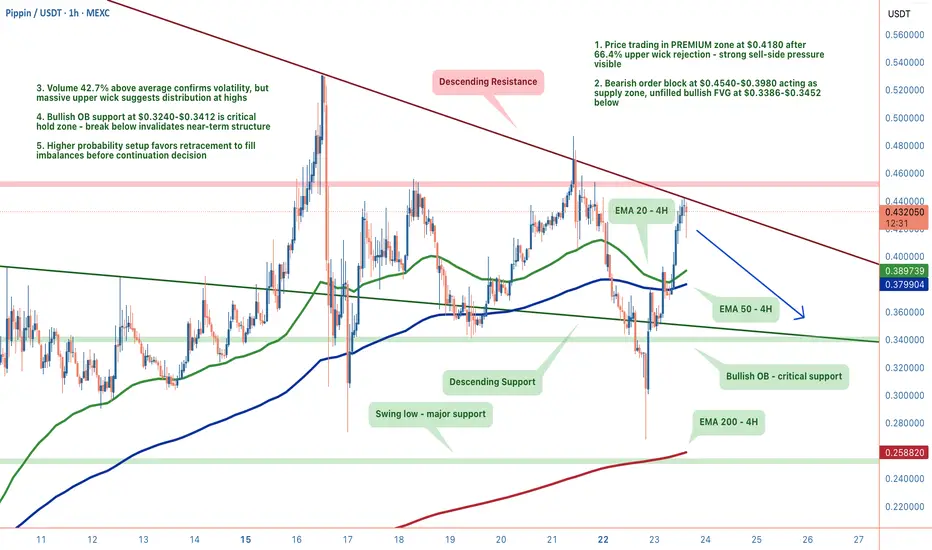
Pippin: The Distribution Pattern Everyone's MissingPrice spiked 21.79% to $0.4428, then printed a massive 66.4% upper wick rejection—that's not bullish continuation, that's smart money distribution. We're currently at $0.4180 in PREMIUM territory, sitting in the exact zone where probability favors mean reversion, not continuation.
1. THE TECHNICAL REALITY 📉
• Bearish order block $0.4540-$0.3980 acting as supply ceiling, price got violently rejected there
• Trading in PREMIUM zone above equilibrium ($0.3896), we're in the sell zone per smart money concepts
• Rising wedge pattern detected—these formations typically resolve downward
• Price above all major EMAs (20/50/200), so longer-term structure remains intact
2. THE INDICATORS ⚖️
Bearish Signals:
• RSI at 45.9 declining from overbought, momentum shifting
• MACD histogram showing weakening momentum despite bullish crossover
• 66.4% upper wick rejection at highs, textbook distribution signal
Bullish Signals:
• Volume 42.7% above average, confirms trending environment
• ADX at 38.9, strong directional movement in play
• Price holding above all major moving averages
The Conflict:
We're in a trending environment with bullish structure, but sitting in premium territory with clear distribution evidence. The question isn't if we retrace, it's how deep.
3. THE TRADE SETUP 🎯
🔴 Scenario A: Mean Reversion (Higher Probability)
• Trigger: Rejection at current levels or one more push to $0.4540
• Entry: Short on rejection confirmation
• Target 1: $0.3386-$0.3452 (unfilled bullish FVG, price returns to fill imbalances)
• Target 2: $0.3240-$0.3412 (bullish order block demand zone)
• Extended Target: $0.2520 if demand breaks
• Stop: 4H close above $0.4540
🟢 Scenario B: Bullish Reclaim
• Trigger: 4H close above $0.4540 (breaks bearish OB supply)
• Entry: Reclaim of $0.3896 equilibrium with conviction and volume
• Target: $0.5049
• Invalidation: Rejection back below $0.3896
MY VERDICT
This isn't a chase-the-pump moment, it's a wait-for-structure moment. The setup favors patient short positioning or waiting for the FVG fill at $0.3386-$0.3452 to reassess. Risk-adjusted probability leans 72% bearish until we see that 4H close above $0.4540.
BTCUSD Technical Analysis! BUY!
My dear subscribers,
BTCUSD looks like it will make a good move, and here are the details:
The market is trading on 87461 pivot level.
Bias - Bullish
Technical Indicators: Both Super Trend & Pivot HL indicate a highly probable Bullish continuation.
Target - 87892
About Used Indicators:
The average true range (ATR) plays an important role in 'Supertrend' as the indicator uses ATR to calculate its value. The ATR indicator signals the degree of price volatility.
Disclosure: I am part of Trade Nation's Influencer program and receive a monthly fee for using their TradingView charts in my analysis.
———————————
WISH YOU ALL LUCK

BTCUSD VIEW!! Macro trader plur daddy (@plur_daddy) argues bitcoin’s 2026 setup is less about crypto-specific catalysts and more about whether US liquidity conditions normalize after what he described as an unusually tight few months for risk.
His central claim is that repo “plumbing” has been strained by a shortage of bank reserves as leverage in the economy grew faster than the Fed’s balance sheet, and that the resulting stress showed up in broader markets — “very choppy and rotational dynamics in equities” — alongside “a quite adverse environment for crypto.” Going into the new year, he expects a set of incremental shifts that could move conditions from tight back toward neutral, even if they do not create a new “loose” regime.

ETHUSD Expected Growth! BUY!
My dear followers,
This is my opinion on the ETHUSD next move:
The asset is approaching an important pivot point 2930.7
Bias - Bullish
Technical Indicators: Supper Trend generates a clear long signal while Pivot Point HL is currently determining the overall Bullish trend of the market.
Goal - 2970.9
About Used Indicators:
For more efficient signals, super-trend is used in combination with other indicators like Pivot Points.
Disclosure: I am part of Trade Nation's Influencer program and receive a monthly fee for using their TradingView charts in my analysis.
———————————
WISH YOU ALL LUCK

Bitcoin (BTCUSD) – Demand Zone Rebound Targeting 90,400 ResistanMarket Structure
Short-term structure: Corrective / pullback within a broader bullish trend
BTC previously swept liquidity near the 90,400–90,500 area (marked target point), then rejected sharply.
Current price action shows lower highs, indicating a retracement phase rather than continuation yet.
🟥 Demand / Support Zone (Red Area)
Zone: ~85,400 – 86,450
This is a key demand & liquidity zone:
Prior impulsive bullish departure
Multiple reactions historically
Price recently tapped into this zone and bounced, confirming buyers are active here.
🟩 Upside Target / Supply (Green Area)
Target zone: ~90,400 – 90,500
This is:
Previous high
Strong resistance / liquidity pool
If price breaks structure to the upside, this zone becomes the primary bullish target.
📈 Current Price Behavior
Price is trading around 87,300
Structure shows:
Higher low forming inside demand
Early signs of bullish reversal, but confirmation is still needed
A break above the recent lower high (~88,000–88,200) would strengthen bullish continuation.
🧠 Trade Scenarios
✅ Bullish Scenario (Preferred)
Entry idea: Buy continuation after confirmation above 88,000
Aggressive entry: Deep pullback inside 86,000–85,500
Invalidation: Clean break & close below 85,388
Targets:
TP1: 88,800
TP2: 90,400 – 90,500
⚠️ Bearish Scenario
If price:
Fails to hold 86,000
Shows strong rejection from 88,000
Then price could range or revisit 85,000 liquidity
📌 Summary
Trend: Bullish overall, short-term corrective
Key zone: 85.4k–86.4k demand
Confirmation level: ~88k
Bias: Buy dips, wait for structure break before full conviction
If you want, I can:
Give a short chart title
Mark exact entry / SL / TP
Align this with H1 / H4 / Daily trend

What to Fix in Your Trading Process Before 2026I’ve been stopped out more than 300 times.
After years of trial, error, and reflection, I realized there was one thing missing from my process.
If I had understood and fixed it earlier, I would have become profitable much sooner.
It’s probably very simple to you.
And I’m confident that around 90% of traders either don’t do it at all — or do it incorrectly.
That skill is scenario writing.
It doesn’t matter whether you’ve been in the market for one year or three.
Writing scenarios before the trade can significantly improve your win rate.
Let me explain how.
Imagine your trading day has started.
You’re analyzing the market when suddenly a symbol begins to move with strong momentum.
Your mind says: “This fits my strategy. I should enter.”
Your emotions say: “Wait for a pullback — you’ll get a better price.”
Then another thought appears: “What if this trade covers a year’s profit?”
Logic, FOMO, and dozens of parameters start competing.
The result is usually a position with much lower quality than what your strategy actually requires.
Now imagine a second trader.
The day before, they wrote down all possible scenarios and the exact actions required for each one.
When momentum appears and resistance breaks, they enter immediately — without hesitation.
Not because they are emotionless, but because the plan already exists.
Nothing is surprising.
Nothing feels urgent.
Emotions play a minimal role because the decisions were made in advance.
I believe many of you have experienced the first situation.
So let’s look at how scenario writing should actually be done.
I’ve prepared a simple template you can copy directly into Notion.
Duplicate it daily and use it for every pair you analyze.
At first, it may feel difficult.
It might even take hours.
But after one month of consistent use, analyzing a symbol will often take less than seven minutes.
If you’ve followed my daily analyses, this structure may already feel familiar — because all my analysis is built around clear triggers, scenarios, and defined risk.
⚙️ Trading Scenario Journal Template
🧩 Structure Overview
Each position should have six sections:
Start (Setup & Entry Logic)
End (Exit & Contingency)
Actors (Market Elements)
Storyline (Expected Path)
Mid-Scenarios (Adjustments)
Goal (Purpose & Awareness)
1. Start – Setup & Entry Logic
Market Direction: Uptrend / Downtrend / Range (Weekly / Daily / 4H)
Entry Trigger: What confirms the entry (e.g., break & retest, candle pattern, volume)
Alternative Conditions: Valid setups if the main trigger fails
🗝 Only trade within the defined structure — no guessing.
2. End – Exit Logic & Contingencies
Exit Trigger: Where and why the position will be closed
If the Trigger Never Happens: Wait, cancel, or partially close
Profit Management: When to secure profit or move stop to break-even
🗝 Every “if–then” must be decided before the market forces you to act.
3. Actors – Key Market Factors
Each element either supports or weakens the setup:
Candles (strength, volatility, dominance)
Volume (confirmation or rejection)
RSI (momentum or exhaustion)
DMI / ADX (trend and volatility strength)
Support & Resistance (decision zones)
Trendlines / Channels (structural bias)
P.S: These are my personal trading plan confirmations; you need to define your own
🗝 Align at least three confirmations.
4. Storyline – Expected Path
Write the ideal “movie” of price behavior.
Example:
“Pullback to 66.4k → rejection → retest → continuation to 68k.”
If the story does not unfold, there is no trade.
🗝 You don’t predict. You prepare.
5. Mid-Scenarios – Management Adjustments
All reactions are pre-defined, not emotional:
Add if structure breaks with volume
Reduce if momentum fades or divergence appears
Exit early if volatility disappears or major news hits
Avoid adding if RSI is already overextended
🗝 Responses are designed mathematically, not emotionally.
6. Goal – Purpose of the Trade
Core Goal: Why this trade exists (continuation, test, reversal)
Expected Learning: What this trade should teach you — even if it loses
“If something unexpected happens, it means the scenario wasn’t fully planned.
Next time, it gets written down.”
If you stop writing scenarios by day seven, understand this clearly:
You are not supposed to be profitable yet.
Trading is not a comfort skill.
And this environment is not designed for comfort.
It requires structure, discipline, and emotional control.
If journaling, scenario writing, and structured analysis feel unbearable, quitting early is actually more honest than pretending.
By the way — I’m Skeptic , founder of Skeptic Lab .
I focus on long-term performance through psychology, data-driven thinking, and tested processes.
If this was useful, feel free to support it.
If you know a trader struggling with the same issue, share it — growing together is one of the most human experiences we have.
And if you have your own insights, leave them in the comments.
Let’s learn from each other.
— Skeptic

BTCUSDT Long: Demand at 88K Could Fuel a Move to $92,700Hello traders! Here’s a clear technical breakdown of BTCUSDT based on the current chart structure. Bitcoin recently completed a prolonged move lower within a well-defined descending channel, confirming strong bearish pressure during that phase. This bearish structure remained intact until price reached a key pivot low, where selling momentum clearly weakened. After the initial impulsive move higher, BTC tested the 92,700 Supply Zone, where temporary rejection occurred. This reaction resulted in several pullbacks toward the 88,000 Demand Zone, which aligns with previous resistance turned support and the lower boundary of the ascending channel. Each pullback into this demand area was met with buying interest, indicating absorption rather than distribution.
Currently, price is stabilizing above the 88,000 Demand Zone, and the pullbacks remain corrective in nature. Multiple minor breakouts along the channel support further confirm that buyers continue to defend structure. The market is consolidating while maintaining bullish alignment.
My scenario: as long as BTCUSDT holds above the 88,000 Demand Zone, the bullish structure remains intact. A strong reaction from this area could lead to another attempt toward the 92,700 Supply / Resistance Zone. A confirmed breakout and acceptance above 92,700 would open the door for further upside continuation within the ascending channel. Only a decisive breakdown below demand would invalidate the bullish scenario. For now, the bias remains bullish, with buyers in control while price respects the ascending channel. Manage your risk!

Momentum :(Bitcoin Monthly Technical Outlook – Stochastic RSI Warning
On the monthly timeframe, Bitcoin is approaching a critical and decisive level.
Historically, whenever the Stochastic RSI on the monthly chart breaks below the 20 level and confirms a monthly close beneath it, the market has entered a high-risk phase, often marking major market tops followed by deep corrections or prolonged bearish periods.
As illustrated on the chart, every previous decisive drop of the Stoch RSI below this threshold has aligned with the end of a primary bullish cycle.
Current market conditions show:
• Price exhaustion signals after an extended bullish expansion.
• Weakening momentum, suggesting distribution rather than accumulation.
• The Stochastic RSI rolling over toward the danger zone, with only seven days remaining until the monthly candle closes.
If Bitcoin closes the month with the Stochastic RSI below 20, this would confirm:
• Loss of long-term momentum
• Structural weakness in the prevailing trend
• A significantly higher probability of a macro corrective phase
This does not imply an immediate crash; however, it would materially change the market’s risk profile, shifting focus from trend continuation to capital preservation and risk management.
The monthly close is critical.
Patience and confirmation are essential.
Let the candle close — the market will reveal its true intent.
