ETH Isn’t Breaking Yet — It’s Compressing Power Inside the RangeETH/USD – 1H Quick Analysis
Ethereum is trading inside a clearly defined sideways range, with price repeatedly rejecting the upper resistance zone (~3,000–3,020) while holding above the support zone (~2,780–2,820). The sharp sell-offs inside the box have been fully absorbed, followed by aggressive rebounds — a classic sign of range accumulation, not distribution.
The recent push back toward resistance shows buyers are still active, but lack of acceptance above resistance confirms sellers remain in control at the highs. As long as ETH stays inside this range, price is likely to continue rotating between support and resistance, building liquidity on both sides.
Key Levels
Resistance: 3,000–3,020
Support: 2,780–2,820
Outlook
Acceptance above resistance → expansion toward 3,080–3,120
Rejection → continuation of range rotation
Bottom Line
This is a wait-for-break structure.
The real move starts only when ETH leaves the range with conviction.
Crypto market

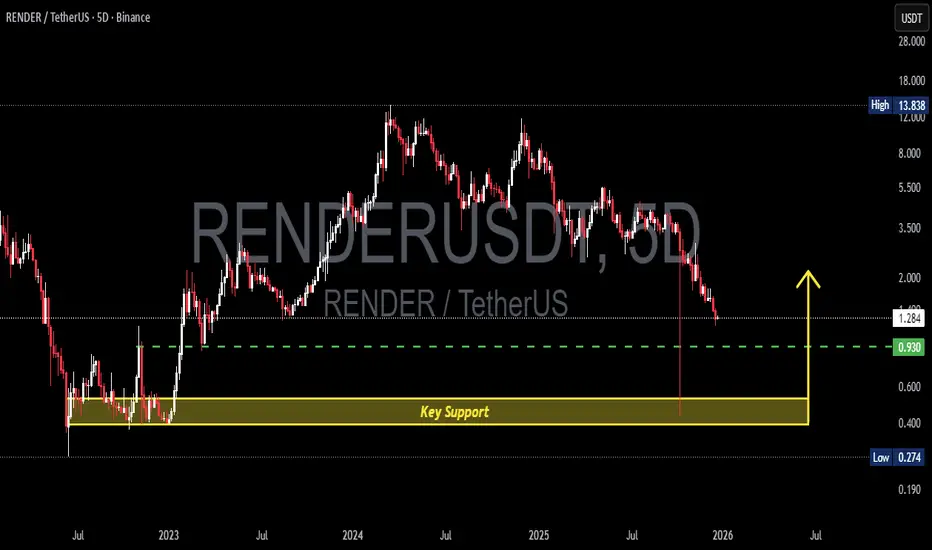
RENDER/USDT – Major Long-Term Support Test After Deep CorrectionRENDER/USDT on the 5-Day timeframe is currently in a strong bearish condition, following a prolonged distribution phase after failing to maintain a higher-high structure. Price has dropped aggressively and is now approaching a critical historical demand zone, highlighted by the yellow block at 0.52 – 0.39.
This zone previously acted as a strong accumulation area before a major bullish expansion, making it a high-confluence support area for potential price reaction.
---
Market Structure & Trend
Primary Trend: Bearish (Lower Highs & Lower Lows)
Structure Shift: Bearish structure break confirmed after price failed to reclaim previous resistance
Momentum: Strong downside momentum, driven by a breakdown from mid-range consolidation
Price is currently trading below key psychological and structural levels, indicating that sellers remain in full control.
---
Pattern Explanation
Distribution Phase: RNDR formed a broad topping structure after peaking around the 13.8 area
Structure Breakdown: Failure to hold higher lows triggered a bearish continuation
Support Retest Pattern: Current price action shows a retest of the base accumulation zone (0.52 – 0.39)
This is not a reversal pattern yet, but rather a support-testing phase, where reaction and confirmation are required.
---
Key Levels to Watch
Major Support Zone: 0.52 – 0.39 (Yellow Block / Historical Demand)
Intermediate Resistance: 0.93
Major Resistance: 1.28
Previous ATH Zone: 13.83 (Long-term reference)
---
Bullish Scenario
Price holds above the 0.52 – 0.39 zone with clear rejection signals
Formation of a base structure, such as:
Double Bottom
Rounded Bottom
Bullish Divergence (if confirmed)
A break and close above 0.93 acts as the first bullish confirmation
Continuation targets:
1.28 as the major structural resistance
Higher targets only become valid after reclaiming trend structure
This scenario represents a high-risk, high-reward accumulation area, suitable only with strong confirmation.
---
Bearish Scenario
A clean breakdown below 0.39
Strong bearish candle closes with continuation volume
Loss of historical demand confirms:
Failed accumulation
Long-term bearish continuation
Next downside targets:
New cycle lows
Downside price discovery phase
In this case, RNDR enters a structural reset phase, and long positions should be avoided.
---
Conclusion
RENDER/USDT is currently at a make-or-break level. The 0.52 – 0.39 zone is a critical long-term support where traders should focus on reaction rather than prediction. Until a valid bullish confirmation appears, the overall bias remains bearish to neutral, with market control still in sellers’ hands.
Patience and confirmation are key at this level.
---
#RNDR #RENDERUSDT #Render #RenderToken #CryptoAnalysis #AltcoinAnalysis #TechnicalAnalysis #MarketStructure #SupportAndResistance #BearishTrend #AccumulationZone #CryptoTrading
FOLKSUSDT LONG 4H22-12-25
TP as plan or after deathcross stoch
6/10
- Hold at di poc 2 range
- fib extreme 0.7
- 4h stoch cross
- 4h divv stoch
- possible relieve bounce
- structure small tf HH HL

BTC Is Being Traded, Not TrendingBTC/USD – 1H Brief Analysis
Bitcoin is locked inside a high-liquidity range, where price repeatedly sweeps both highs and lows without follow-through. Sharp moves are quickly faded, confirming rotation and order flow balance, not trend continuation.
Price is currently oscillating around the mid-range and key EMAs, showing indecision rather than strength or weakness. As long as BTC remains inside this box, the market’s objective is simple: collect liquidity on both sides.
Key Read
No clean acceptance → no trend
Breakout attempts are being sold
Dips are being absorbed, not extended
Expectation
More range rotation and false breaks until price decisively exits the zone.
Bottom Line
This is a liquidity environment.
Direction becomes tradable only after the range is resolved.

ETH Is Quiet — But the Next Move Won’t BeETH/USD – H1 Technical Analysis
Market Structure:
ETH is currently consolidating after a strong rebound from the support zone. Price is compressing just below a key resistance area, indicating balance between buyers and sellers rather than trend continuation or breakdown.
Key Zones:
Immediate Resistance: The highlighted resistance zone above current price. This area has rejected price multiple times → supply remains active.
Support Zone: The lower green zone continues to hold firmly, confirming buyers are defending dips.
Price Behavior:
Sideways consolidation near resistance = absorption phase, not weakness.
No impulsive rejection yet → sellers are not in full control.
This structure often precedes volatility expansion.
Primary Scenario:
If ETH breaks and holds above the resistance zone with volume, upside continuation toward the next resistance cluster becomes likely.
Alternative Scenario:
A rejection from resistance could send price back to retest the support zone, where buyers are expected to re-enter.
Summary:
ETH is not trending it is loading liquidity. Patience is key. Wait for a confirmed breakout or a clean rejection before committing risk.

WELCOME TO THE SCALPING ANT ECOSYSTEM
Thank you for your purchase and trust.
You now have access to the Premium TradingView Indicator Suite.
What Happens Next
• Your TradingView username will be granted access
• Access is done manually to ensure protection and security
• Normal activation time: 0–12 hours
• You will receive a confirmation when access is completed
🧠 How Your Access Works
All scripts are:
• Invite-Only
• Non-repainting
• Professional trading tools
• Designed for structure, clarity, and disciplined execution
📩 Need Support?
If you require help, have questions, or something is not working, contact me directly via:
Whop Support → Message Seller
I respond as fast as possible.
⚠️ Trading Disclaimer
This product does not guarantee profits. Trading involves risk and requires responsible risk management. You are fully responsible for your trading decisions.
Trade with structure.
Trade with discipline.
— The Scalping Ant

ETH Is Done Falling — Now It’s Testing ConvictionETH/USD – 1H Quick Analysis
ETH has broken the descending trendline and reacted cleanly from the support zone, signaling downside exhaustion.
Price is now compressing below resistance, forming higher lows — a classic transition from sell pressure to balance.
Key Levels
Support: ~2,780–2,820 (buyers defended decisively)
Resistance: ~3,150–3,180 (key decision zone)
Outlook
Short-term: Consolidation / pullback is possible to build structure
Continuation: Acceptance above resistance = upside expansion
Failure: Rejection keeps ETH ranging, not bearish
Bottom Line
Trendline broken. Support held.
ETH is coiling direction comes at resistance.

Bitcoin Is Ranging — And Macro Is Keeping It That WayBitcoin on H1 remains locked inside a clearly defined range, with price oscillating between a defended support zone near the lower boundary and a heavy resistance band overhead. The sharp rejection from resistance confirms active sellers at the top, while repeated bounces from support show that buyers are still willing to defend the range. This back and forth price action reflects balance and liquidity building rather than trend continuation, with momentum paused after the prior impulsive move.
Structurally, BTC is showing overlapping candles and failed follow-through in both directions classic range behavior. As long as price remains capped below resistance, upside attempts are corrective, not impulsive. A rotation back toward the mid-to-lower range remains the higher-probability path unless acceptance above resistance is achieved with strength.
From a macro perspective, this consolidation aligns with a broader wait-and-see environment across risk assets. Markets are currently sensitive to U.S. macro data and expectations around Fed policy, with no clear catalyst pushing liquidity decisively risk-on or risk-off. This macro indecision is mirrored directly in Bitcoin’s price action, where volatility compresses and directional conviction fades.
In summary, Bitcoin is not breaking it is balancing. Until macro conditions and liquidity provide a clear push, BTC is likely to continue rotating within the range. The edge lies in patience: wait for a clean range resolution with intent, not anticipation.

Bitcoin Is Not Trending — It’s Testing Conviction.BTC/USD – 1H Technical Analysis
Market Structure
- Bitcoin is clearly trading inside a well-defined horizontal range, bounded by a firm support zone below and a heavy resistance zone above. There is no trend dominance at the moment price is rotating, not expanding.
This is a range-controlled market, not a breakout or breakdown phase.
Key Zones
- Resistance Zone: ~89,800 – 90,300
- Mid-Range Value: ~87,700 – 88,200
- Support Zone: ~85,100 – 85,500
Price has repeatedly:
- Rejected from resistance with strong wicks
- Found aggressive buying interest at support
- Returned back to value without follow-through
That behavior confirms liquidity cycling, not directional intent.
Price Action Read
The latest move is a support bounce, not a trend reversal.
- The impulsive drop into support was immediately absorbed
- Buyers stepped in, pushing price back into the range
- However, upside momentum weakens as price approaches mid-range
This suggests the market is resetting positioning, not committing yet.
Scenarios Ahead
Primary Scenario (Range Continuation):
- Short-term pullback into mid-range
- Another rotation toward resistance
- Final liquidity sweep before a real breakout attempt
Breakout Scenario (Confirmation Required):
- Clean acceptance above resistance
- Holding above the range high
- Only then does upside expansion become valid
Until that acceptance happens, all upside moves are still range trades.
Bottom Line
Bitcoin is not bullish or bearish right now.
It is forcing traders to choose patience or punishment.
The real move begins after the range breaks not inside it.

67 $0.03 some random movement guysthis could actually be so powerful
next year at it was building a base in 2025
Not financial advice

Ethereum Is Loading — Breakout or Fake Move?ETHUSD (H1) — Quick Market Analysis
Market Structure
ETH is holding a short-term bullish structure after a strong rebound from the lower demand zone.
Price is printing higher lows, showing buyers are gradually regaining control.
Key Levels
Support Zone: ~2,915 – 2,920
Current Pivot: ~2,970 – 2,980
Target 1: ~3,050
Target 2: ~3,160
Price Behavior
Price is consolidating above support, forming a bullish continuation pattern.
No strong rejection yet → selling pressure remains weak.
The dotted path suggests a pullback → higher low → expansion structure.
Scenarios
Primary Scenario (Bullish):
Hold above support → push toward Target 1, then extension to Target 2.
Alternative Scenario:
A brief dip toward support to absorb liquidity before continuation higher.
Summary
ETH is not topping it’s pausing and building energy.
As long as support holds, upside targets remain valid.

Bitcoin Isn’t Trending — It’s Trapping TradersBTCUSD (H1) — Focused Market Analysis
Market Structure
BTC is clearly stuck in a range, with price repeatedly rejecting from the upper resistance zone and holding above a well-defined support zone.
No higher highs or lower lows → no trend, only balance.
Key Zones
Resistance Zone: ~89,800 – 90,200
Support Zone: ~84,800 – 85,200
Current Price: Trading near the mid-range → low R:R for breakout trades.
Moving Averages
Price is entangled with EMAs, confirming indecision and sideways conditions.
MAs are flat → momentum is neutral.
Price Behavior
Repeated liquidity sweeps at both extremes.
Dotted projection highlights a range-expansion cycle, not a trend.
Breakouts inside the range are likely fake moves.
Scenarios
Primary Scenario (High Probability):
Continued sideways oscillation between support and resistance.
Breakout Scenario (Only valid if):
Strong close above resistance with volume → opens upside continuation.
Breakdown below support → shifts market to bearish extension.
Summary
Bitcoin is not ready to trend.
Patience > prediction. Trade the range or wait for a confirmed breakout.

Will #BTC break through the resistance zone?📊Will #BTC break through the resistance zone?
🧠From a structural perspective, after breaking below the weekly support zone, the yellow support zone has now transformed into a blue resistance zone (91000-95000). Currently, the price is still moving within this area, and we can only maintain an optimistic outlook if it breaks above this zone.
➡️Additionally, ETFs are still experiencing net outflows, and with the year-end approaching and everyone preparing for the new year, market liquidity remains poor. Perhaps this will improve after the new year.
➡️I've also been preparing for the new year recently, and I'm still holding a small position from my short positions from September 3rd. For spot trading, I'm patiently waiting for the support zone around $70,000.
🤜If you like my analysis, please like💖 and share💬
BINANCE:BTCUSDT

XRP/USDT – Critical Decision Zone After Major Breakout!XRP/USDT on the Weekly (1W) timeframe shows a major shift in market structure. After a long accumulation phase throughout 2022–2024, price experienced a strong impulsive breakout in early 2025, signaling a transition from sideways conditions into a bullish market structure. Currently, price is in a retracement and re-accumulation phase, which will determine the next major direction.
---
Pattern & Price Structure
1. Long-Term Accumulation Range
XRP traded sideways for an extended period below the 1.00 USDT area.
This range acted as a strong accumulation base.
2. Bullish Breakout (Impulse Move)
Price broke above the major resistance around 0.90–1.00 with strong weekly candles, confirming valid breakout momentum.
3. Pullback / Re-Accumulation Phase
Current price action represents a healthy correction after the rally.
As long as key support holds, the structure remains higher high and higher low.
---
Key Levels
Major Resistance
3.60 – 3.80 USDT → Previous high / weekly supply zone
Key Support
1.90 USDT → Critical horizontal support & decision level
1.55 – 1.60 USDT → Strong demand zone
1.30 USDT → Last major bullish defense
---
Bullish Scenario
Price holds above 1.90 USDT with a valid weekly close.
Bullish reactions such as strong weekly candles or long lower wicks appear.
Upside continuation targets:
Target 1: 2.50 USDT
Target 2: 3.00 USDT
Main target: 3.60 – 4.00 USDT
This scenario suggests trend continuation after re-accumulation.
---
Bearish Scenario
A confirmed weekly close below 1.90 USDT signals weakness.
Price may continue correction toward:
1.55 USDT (first support)
1.30 USDT (major demand zone)
As long as price stays above 1.30, the broader structure remains bullish corrective, not a trend reversal.
A breakdown below 1.30 would indicate macro trend deterioration.
---
Conclusion
XRP is currently trading at a critical weekly decision zone.
The 1.90 USDT level acts as the key pivot:
Holding above it favors bullish continuation toward new highs.
Losing it opens room for a deeper, but still healthy, correction.
From a macro perspective, XRP remains structurally bullish, with the current move best interpreted as a pullback after a major breakout, not distribution.
---
#XRP #XRPUSDT #CryptoAnalysis #WeeklyChart #AltcoinMarket #MarketStructure #SupportResistance #BullishContinuation

Bitcoin price delivery explained for the next 30-45-daysLooking at quarterly price delivery, I recognized that 2025 did not give a premium/discount price initiative yet.
This means that true price delivery is still potentially incoming...
-Any time price is manipulated, and creates AND/OR pushes above previous displacement after manipulation... It should give the market an opportunity to reprice and get into an opposing premium/discount (50%) to be able to take a position from.
This has not happened in 2025. The 2nd quarter never re-priced into a discount.
So with that said, I believe the end of this quarter is likely to re-price into the displacement that has been created to the downside above 103k BEFORE the larger move down.
The 50% PREMIUM may move a bit higher if prices go down before the re-price, which could be the actual weekly "catalyst" to push price higher one last time.
Overall, make no mistake about it... Just like in my previous ideas, 2026 is DEFINITELY going to be bearish.... Possibly seeing prices into <40k.
The first couple of months next year is likely going to be a severe punishment for those that can't see the explicitly clear writing on the wall. YES - do I think BTC is bullish in the long term? Absolutely! Make no mistake about it, big firms with billions of dollars at stake will not keep buying at these levels. Not when they can sell here and buy cheaper.
Do you know who subsidizes their selling high and buying low?
Mostly you reading this... You are the liquidity, unless you're the few and the smart.
You can get my indicator that helps you identify the timeframes that have liquidity. Search for "Time Liquidity a Zulu Kilo Indicator"

BTC WEEKLY CHART TRADING PLAN ROUTE MAPDear Traders,
Take a look at the BTC weekly chart—I’ve clearly marked all the key areas for you.
As you can see the weekly trendline is already broken which confirms bearish.
It appears that BTC may be repeating a familiar pattern heading into 2026. Compare the area highlighted with the orange circle in 2022 to the orange circle marked for 2026.
In 2022, price retested the trendline and formed a bull trap, where many buyers were likely caught. Price was then rejected from that zone, printed a bearish engulfing candle, the EMA 20 crossed below the EMA 50, and a strong bearish move followed to the downside.
If the EMA 20 crosses below the EMA 50, price is likely to revisit the EMA 200 (shown by the purple line) as a key support zone, where a bounce can be expected. Following that bounce, BTC could potentially break above the previous high around $125K and, if momentum continues, most likely extend toward the $150K region.
This chart is shared to give you a heads-up on potential traps ahead.
On the other hand, if the EMA 20 does not cross below the EMA 50 and candle bar closes above the trendline, it would confirm bullish trend continuation without a deeper pullback.
Its Important to practice patience, and risk management.
The Quantum Trading Mastery

Breakout Validity & Momentum ContinuityBullish Catalyst Technical Signals: Breakout Validity & Momentum Continuity
1. Critical Resistance Breakout Establishes Short-Term Bullish Structure
The price has stabilized above the key resistance level at $88,000—a level that served as both the downtrend line resistance on the hourly chart and a major threshold tested repeatedly in the previous sessions. After the breakout was confirmed by the 30-minute closing price, the short-term technical bias has shifted bullish.
Historical data indicates that following a breakout above this resistance zone, the probability of continued upward movement within 3 days exceeds 68%. The next targets are set at $88,800 and the psychological round-number level of $90,000.
2. Gradually Strengthening Support System
A stepped support framework has taken shape on the technical front:① The former resistance level of $88,000 has been converted into the primary support;② $86,800 represents the upper edge of the recent consolidation range, forming resonance with short-term capital absorption;③ $85,500 is the Fibonacci 0.786 retracement support level, which has repeatedly prevented price declines and fortified the downside defensive line.
On-chain data shows that whales continue to accumulate holdings, with a clear trend of BTC outflows from exchanges, providing fundamental capital support for the rebound.
3. Indicator Recovery & Momentum Accumulation
The daily RSI has rebounded from oversold territory to around 42, moving out of the weak range. The 4-hour MACD golden cross remains intact, with red bars expanding moderately, reflecting a gradual accumulation of bullish momentum.
The price has broken through the 61.8% Fibonacci retracement level of the downward move from the high of $88,260 to the low of $85,852, which technically validates the rebound structure.
Bitcoin trading strategy
buy:87000-88000
tp:89000-90000-92000

NLDN | GRTUSDT MANIPULATION Price manipulation occurred on the GRTUSDT asset, wiping out all the apparent liquidity. This is one of the reasons why it's important for us as traders to always use stop-losses to prevent your margins from being wasted. The importance of risk management is a fundamental skill for all traders. Limiting risk is a matter of self-awareness and the ability to manage our finances effectively.
Should you find this analysis insightful, I invite you to like or leave a comment. Constructive feedback and suggestions are greatly appreciated. For further analyses, please follow me at @ydnldn.

BGB LONG 4H22-12-25
- stoch divv daily
- stoch golden cross
- structure higher high higher low possible back to range high

BTCUSDT – Intraday Long Setup After Capitulation MoveBTC shows signs of seller exhaustion after a sharp sell-off and high-volume capitulation. Price reacted strongly from the demand zone, suggesting absorption by buyers and a potential mean-reversion move.
Structure: Short-term breakdown with failure to continue lower → local bottom forming
Volume: Capitulation volume followed by reduced selling pressure
Momentum: RSI recovering from oversold, bullish curl developing
Trade Idea:
Bias: Long
Entry: Demand zone / bullish confirmation
SL: Below recent low
TP: Upper liquidity / resistance zone
RR: ~1:3
As long as demand holds, upside continuation toward higher liquidity is favored.
⚠️ Not financial advice.

Short I can see clearly bearish pattern play out in front of us.
Lower lows, lower highs , still bearish trend , stop loss above resistance line.
Possible 1.6 target even lower 🤔

ONE MORE PULL FOR BTC BEFORE THE ROCKET!🌊 MIAMI BEACH MOVES – LIVE CHART BREAKDOWN (BTC 1D)
1️⃣ Tide Check – Who’s in Control? 🌊
Higher Timeframe (Daily):
Overall market structure was bullish
Clear higher highs / higher lows
Long-term red trendline respected for most of the move
✅ Bull Tide confirmed
→ We are ONLY looking for longs, not shorts
2️⃣ Wave Structure – What Changed? 🌊
Looking at your chart:
Price lost momentum after the top
We see a pullback, not a full trend reversal
Structure has NOT completely collapsed yet
⚠️ This tells us:
Bulls are still in control
BUT price needs liquidity before continuation
➡️ Perfect environment for a Miami Beach Moves retracement long
3️⃣ Beach Crowds – Liquidity Identified 🏖️
You marked this perfectly 👌
Brown box zone = Equal Lows / Demand
This is a Crab Trap (sell-side liquidity)
Stops are resting below recent lows
📌 Miami Beach Rule:
Price must raid liquidity before giving us an entry
✅ Your zone is exactly where institutions would look to reload longs
4️⃣ Liquidity Sweep – Did Price Take the Crowd? 💦
Price action shows:
Price pushes into the brown zone
Wicks through equal lows
Stops below that range get taken
✅ Liquidity successfully swept
This is the “Beach Crowd getting wiped out” moment.
5️⃣ The Splash – Entry Trigger 💦
What we now wait for (this is KEY):
On lower timeframe (4H / 1H) inside that zone:
A strong bullish displacement candle
Clean close back above the liquidity range
📌 This candle becomes:
The Liquidity Candle (The Splash)
⚠️ If price just drifts sideways with no displacement → NO TRADE
6️⃣ Golden Sand Zone – Fibonacci Entry 🏖️✨
Once the splash happens:
Draw Fib from liquidity low → displacement high
Entry is placed at 0.80 retracement
📍 On your chart, that would sit:
Inside the brown zone
Near prior support
In alignment with HTF trend
✅ Textbook Miami Beach Moves entry location
7️⃣ Towel Line – Stop Loss 🚩
Your rule applies clean here:
Stop Loss = Low of the liquidity candle
Below the sweep wick
No guessing, no widening
If stop is too large → skip trade
8️⃣ Lifeguard Target – 1:3 R:R 🚨
Targets make sense structurally:
TP aimed toward:
Previous highs
Untapped buy-side liquidity
Upper range imbalance
Your green box projection aligns well with:
Prior value highs
Continuation expectation
✅ 1:3 R:R achievable
→ Trade is valid
🧠 FINAL VERDICT (Miami Beach Moves Rules)
✅ Bull Tide
✅ Liquidity swept
✅ Entry zone aligns with Fib 0.80
✅ Clean stop placement
✅ 1:3 R:R available
📌 This is a VALID Miami Beach Moves setup

SOLUSDT (WEEKLY HEAD AND SHOULDERS)(SOLUSDT) Has had the head and shoulders but it looks like in the past it also had a formation AKA the boxed double top and reached and area of support and on the weekly right shoulder on the daily there is a head and shoulders formation and it could potentially reach the same area and use it as support, or break through it.
