1 hour view (xrp) short-term SHORTHello 🙋♀️🙋♂️👽👻🐮🌍
just a quick idea and possible short available here. price could go much lower because we are in a descending triangle on daily time frame view.
⏬⏬
For now I have my eyes on 💲1.8 as a possible short term target.
This is just an idea, please trade at your own risk
🐶This is a Short term short Idea. The cryptocurrency market is extremely volatile💣
This is not financial advice
🐶
Always have a stop loss ✋🛑💲 set🆗
Any thoughts 💭💡, questions 🙋♀️🙋♂️❓, good 👍, bad👎, happy 😄 or sad 😥, in the comments always welcome.😄
Jazerbay ☯️
Crypto market

BTCUSDTUncle Trump sold his gold and wants to marry Bitcoin, I hope.
ENTRY:88000_77000
SL:73000
TP:167618
**There is no responsibility for your profits or losses. Please manage your investments.**

The Language of Price | Lesson 10 –Candlesticks + S&R Practice 1Candlesticks + Support & Resistance — How to Read Them Together
Instead of viewing candlesticks and support & resistance separately, this lesson shows how price structure and candle behavior can be read together to form a clearer directional context.
Think of it as:
Where price is + how price reacts .
Scenario 1 — Fresh Support + Reaction
📍 Support
• Fresh formed
🕯️ Candlesticks
• Inverse long wick
• Two inside candles
• Long wick
• Momentum
➡️ A fresh level combined with rejection and compression often highlights participation , not prediction.
Scenario 2 — Tested Support + Hesitation
📍 Support
• Two rejections
• Fresh formed
• Previously respected as S & R
🕯️ Candlesticks
• Two inside candles
• Long wick
➡️ Repeated reactions at the same level add context to candle formations.
Scenario 3 — Strong Reaction Zone
📍 Support
• Huge move away
🕯️ Candlesticks
• Long wick
• Momentum
➡️ When price moves away strongly from a level, candlesticks help interpret the strength of rejection .
Scenario 4 — Confluence Example
📍 Support
• Two rejections
• Fresh formed
• Huge move away
• Respected as S & R in the past
🕯️ Candlesticks
• Long wick
• Inside bar
➡️ This is confluence: multiple elements aligning to improve clarity , not certainty.
Key Insight
❌ Candlesticks alone are not enough
❌ Support & resistance alone are not enough
✅ When combined, they can offer a stronger directional bias , but it is never guaranteed and should always be viewed as contextual, not predictive.
ETHICAL & EDUCATIONAL NOTICE
This content is presented solely for educational and analytical purposes , based on historical price data.
It does not promote or encourage any specific trading method, financial instrument, gambling, leverage, margin usage, short selling, or interest-based activity .
Readers are encouraged to align any financial activity with their own ethical, legal, and religious principles .
⚠️ DISCLAIMER
This material is strictly educational and informational .
It does not constitute financial advice, investment recommendations, or trading instructions.
The author does not provide personalized guidance.
Any decisions made based on this content are the sole responsibility of the individual.

Happy New Years To Everyone But BTC Yearly looks BAD I have been saying for a while that BTC is at the end of one giant bull market since inception. We will see lows nobody imagined. I personally think it is going sub 10k and my lowest target is 3k. Call me crazy but this yearly candle looks like a blow off top and this thing is going into a multi year bear market. If we are indeed going lower, my guess would be we will go up a little from hear before ultimately the next yearly candle will look BAD

Chiliz CHZ price analysis🎆 Is someone launching a New Year firework on the OKX:CHZUSDT chart?
Over the past 3 months, CRYPTOCAP:CHZ has shown much stronger price stability than most altcoins.
While the broader market struggles, #Chiliz keeps holding its ground — and that already says a lot.
📍 Right now, price is pressing against a key decision zone around $0.45.
This level may define the next major move.
📈 A clean breakout above $0.45 could open the way toward the trend resistance at $0.60–0.62.
🎄 So if markets get quiet during the New Year holidays — CRYPTOCAP:CHZ might be worth watching closely.
🤔 Is this just a short-term hype move, or are buyers quietly preparing a bigger push?
______________
◆ Follow us ❤️ for daily crypto insights & updates!
🚀 Don’t miss out on important market moves
🧠 DYOR | This is not financial advice, just thinking out loud

BTC/USD Preparing for Bullish Continuation After Support HoldBitcoin is currently trading on the 1H timeframe within a well-defined bullish structure. Price has respected a strong support zone near the previous swing low, indicating buyers are actively defending this area. After a corrective move, the market formed a higher low, which keeps the bullish bias intact.
A Break of Structure (BOS) earlier confirms bullish intent, and the recent consolidation suggests accumulation before the next impulse. The marked last low acts as a key invalidation level—holding above it strengthens the case for upside continuation.
On the upside, price is targeting the previous swing high and resistance zone. A clean breakout and close above this resistance could trigger strong bullish momentum, opening the door for a fresh rally toward higher levels.
Overall, as long as BTC holds above support, the market favors buy-the-dip behavior, with buyers likely aiming for a continuation toward resistance and beyond.

BTC/USD 1h chart review1️⃣ Uptrend broken
• The black upward trend line has been clearly broken down
• This is a change in the market structure (HH/HL → LH/LL)
• It's not just the wick - the candles have closed below
➡️ Short-term bias: bearish
⸻
2️⃣ Strong downward impulse
• One long falling candle + continuation
• No immediate rebound = weak demand
• This looks like a distribution + dump, not a correction
⸻
3️⃣ Key Levels (from your lines)
🔴 Resistances (now SELL / short area):
• 88,520 – 88,800
• 89,000 – 89,200
➡️ Until the price returns and stays above 89k, any upward movement is a pullback, not a trend.
🟢 Support:
• 87,650 (local – already tested)
• 87,400 – 87,200
• 86,750 (very important, lower support)
⸻
4️⃣ Stochastic RSI
• Came out of overbought
• Lines pointing strongly downwards
• There is no bullish divergence yet
➡️ Momentum is still down, no long signal visible
⸻
🧠 Scenarios (Highlights)
🟥 SCENARIO 1 – base (more likely)
Pullback → further decline
• The price returns to around 88,200 – 88,600
• Rejection (lack of volume, weak candles)
• Next move down:
• 🎯 87,200
• 🎯 86,750
➡️ This is a classic break & retest
⸻
🟨 SCENARIO 2 – consolidation
• Price holds 87,400 – 88,200
• Lack of volume
• “Grinding” before the next move

Ethereum Ready for Upside BreakoutEthereum on the 1H timeframe is showing clear signs of bullish strength returning after a healthy pullback. Price respected the major support zone and formed a clean swing low, indicating strong demand from buyers at discounted levels. This reaction from support confirms that sellers are losing momentum and buyers are stepping back in with confidence.
The market then pushed higher and created a swing high, highlighting a shift in short-term market structure. The area marked as last low now acts as a crucial invalidation zone—as long as price holds above this level, the bullish bias remains intact. This zone is also acting as a demand base where accumulation is likely taking place.
Currently, ETH is consolidating below the resistance zone, which suggests energy is being built for the next impulsive move. This type of sideways price action after a strong reaction from support often precedes a bullish continuation breakout. A confirmed breakout and close above the resistance zone can open the path toward higher targets around the upper range, with momentum-driven buying expected to follow.
Overall, the structure favors buy-the-dip opportunities, with smart money likely positioning ahead of a potential upside expansion. As long as Ethereum stays above support and maintains higher lows, the market outlook remains bullish, and buyers are in control of the next move.

Q1 2026 Plan: Buy Fear, Sell EuphoriaGrowth Factors
1) Spot Bitcoin ETFs (Institutional Demand)
By the end of 2025, total net assets of U.S. spot Bitcoin ETFs exceeded $111–115 billion, equivalent to approximately 7% of Bitcoin’s total market capitalization.
ETFs do not guarantee linear price growth, but they significantly reduce drawdowns and accelerate recoveries after corrections.
2) “Stealth QE” (Hidden Liquidity Support)
The Federal Reserve’s reserve management tools (RMP) can quietly inject liquidity into the financial system, supporting risk appetite.
Q1–Q2 2026 is a key window. A potential liquidity inflow of $300–600 billion is possible.
If this liquidity returns to markets, Bitcoin would receive strong support and could target a move toward $150,000.
Decline Factors
1) Federal Reserve Pause
After three rate cuts in late 2025 (to 3.5%–3.75%), Fed officials are signaling a possible pause in Q1 2026 due to persistent inflation.
The absence of further stimulus could trigger a pullback toward $75,000.
2) Declining Volume
Charts show a clear divergence: price attempts to stabilize while trading volume is falling sharply, indicating buyer exhaustion.
Technical Picture
Price is currently sitting near the lower boundary of the wedge (green line).
This is a critical decision point:
either we see a strong rebound,
or a downside break would signal a transition to a bearish macro trend.
The market is currently in a phase of “maximum fear” within a broader bull cycle.
Holding the green support line and volume around 1.86M suggest the market may be preparing for a short squeeze.
If January 2026 starts with a reclaim above $95,000, the target becomes the upper orange boundary of the range — $135,000 to $150,000 by mid-2026.
Repeating Corrections — The Strongest Signal
First correction: ≈ −31%
Second correction: ≈ −34%
Current correction: ≈ −35%
The duration of each wave is similar (≈ 3–6 months).
Pullbacks consistently start from the upper boundary of the channel and end at the lower trendline.
This is a classic fractal market structure — large capital operates according to the same repeated pattern.
Historically, such symmetry is typical for BTC in 2016–2017 and 2020–2021.
In all cases, these were corrections within a bull cycle, not its end.
Volume Confirms Correction, Not Capitulation
There are:
no panic spikes in volume,
no abnormal selling pressure,
volumes are comparable to previous corrections.
This indicates that large players are not exiting the market.
What we are seeing is redistribution, not capital flight.
Conclusion
The market is not broken — it is in a deep but typical correction phase.
Market structure, drawdown depth, and price behavior fully align with historical Bitcoin bull cycles.
Entry Point
Entry zone: $82,000 – $84,000
This is:
the lower boundary of the expanding wedge (green line), and
the 0.618 Fibonacci retracement of the last impulse.
Expected Timeline
January 2026 — Accumulation
Price retests the $80k–$84k zone, collecting liquidity below local lows.
February – March 2026 — Impulse
A sharp breakout from the wedge driven by short covering (short squeeze).
Price returns toward $100,000.
April – June 2026 — Parabolic Phase
A parabolic move toward the upper boundary of the orange channel, with targets at $135,000 – $152,000.
This would represent the final stage of the cycle.
Risk Management
Stop-Loss: below the mirror level at $73,200.
A sustained break below this level would fully invalidate the bullish structure and signal a transition into a bear market phase.

FORECAST FOR 2026 ON ETH! THE FIRST HALF OF THE YEAR! OVERVIEW!!It's time to discuss a little bit about ETH. First, BTC already fell by 35% in 80 days and most market participants expect a bear market. However, if we open most common and reliable indicators like RSI, Momentum or Stochastic, we can see how they show the lowest values which we could see only in deepest bear markets. There's absolutely nobody believes in the market and growth, but we still hold above EMA 100 level which is the very level and in case of breaking this zone, the market usually plummets by another 50% down. So it's essential to keep an eye on ETH and BTC simultaneously. As soon as we see how BTC starts growing from the strongest support zone of $80.000 that I mentioned multiple times in my previous trade ideas, and so far bulls are still protecting this level buying every dip from that zone and not allowing bear traders to push through this zone, this means big whales and especially ETF firms are buying all BTC to defend this level. So far we are still above of that zone, so I still believe in growth. My forecast until May 2026. We'll set another HIGH on BTC around $124.00, and this growth should go with the decline of BTC.dominance and growth of altcoins. Maybe we are likely to see smooth growth without pumps. Also in case if BTC loses the strongest support zone will indicate about the beginning of a bearish market without oppurtunity to get back to previous levels. I highlighted essential zones on ETH from $2500 to $2700 which we have to defend as bulls, and seeing this pattern like in previous times, I can say ETH is in accumulation phase. Plus, the price made a deep correction from its ATH to 0,61 of Fibonacci level which is often called the golden cross and where in most cases the price makes a reversal trend. So I expect ETH to blew up in near months to $5000 level and maybe even higher. Just imagine current capitalization of ETH is $361 billions and I don't know when, but sooner or later, we'll see $1 trillion easily which means x3, adding that to current price of $3000, it'll be $9000. I hope I'll get back to this post in 1-2 years and after all, we'll see who was right. Peace guys!✌️

CELOBINANCE:CELOUSDT
CELO/ USDT
Entry range (0.112- 0.117)
SL 4H close below 0.111
T1 0.13
T2 0.14
T3 0.15
T4 0.16
T5 0.17
3 optional extra targets on the chart
_______________________________________________________
Golden Advices.
********************
* collect the coin slowly in the entry range.
* Please calculate your losses before the entry.
* Do not enter any trade you find it not suitable for you.
* No FOMO - No Rush , it is a long journey.

Bitcoin Price Update – Clean & Clear ExplanationBitcoin market is moving inside a rising channel, showing that the bigger short-term trend is still bullish, but price is currently reacting near the upper resistance zone the grey zone around 90,000 – 91,000 is a strong supply area. Price has been rejected from this region multiple times, indicating sellers are active here.
BTC faced rejection and is now pulling back, which is normal after a strong move. This pullback looks like a healthy correction, not a trend reversal yet.
Immediate Support: The area near 87,200 – 88,000 is marked as immediate support. If price holds here, we can expect sideways consolidation or a small bounce the next major support lies around 85,000.If immediate support breaks, price may drop quickly into this zone, where buyers are expected to step in strongly
BTC is still bullish overall, but currently in a correction phase. Holding above immediate support keeps the bullish structure intact. A breakdown below it may bring a deeper retracement before the next move.
If you find it please like and comments for this post and share thanks.

TradeCityPro | TON Range Tightens, Breakout Probability Rising👋 Welcome to TradeCity Pro!
In this analysis, I want to review the TON coin for you. One of the popular crypto projects that belongs to the Telegram platform, and with a market cap of $4 billion, it is ranked 26th on CoinMarketCap.
⏳ 4-hour timeframe
This coin has formed a range box on the 4-hour timeframe, and like most altcoins, it is currently ranging.
⚡️ The bottom of the range box is at 1.45 and the top of the box is at 1.68, and for several days now, volume inside this box has been increasing.
📊 This increase in volume indicates the presence of traders in this coin, and if volume continues to increase, the probability of a range breakout will rise.
✔️ Currently, most of the volume is buy volume, and the probability of breaking the 1.681 resistance has increased.
⭐ The higher low that the price has formed is at 1.562, and as long as the price stays above this level, we can expect that if 1.681 breaks, an upward bullish move will start.
🎲 However, if the price gets rejected from 1.681 and moves downward, breaking 1.562, then with the break of 1.45, we can open a short position.
📝 Final Thoughts
Stay calm, trade wisely, and let's capture the market's best opportunities!
This analysis reflects our opinions and is not financial advice.
Share your thoughts in the comments, and don’t forget to share this analysis with your friends! ❤️

Monthly Crypto Analysis: Arbitrum (ARBUSD) – Issue 118The analyst expects Arbitrum's price to decline by the specified end time, based on quantitative analysis.
The take-profit level only highlights the potential price range during this period — it’s optional and not a prediction that the market will necessarily reach it.
You don’t need to go all-in or use leverage to trade wisely.
Allocating just a portion of your funds helps keep overall risk low and ensures a more sustainable approach.
Our strategy is built on institutional portfolio management principles, not the high-risk, all-in trading styles often promoted on social media.
Results are evaluated over the entire analysis period, regardless of whether the take-profit level is reached.

Selling pressure on BTC - 2026Bitcoin (BTC/USD) – End-of-Year Outlook (D1)
As we move toward the end of the year, Bitcoin is showing a clear shift from uptrend to corrective / bearish structure on the daily timeframe.
1. Market Structure
BTC has broken below the rising channel and failed to reclaim it, confirming a loss of bullish control.
Price is now trading below EMA 34 and EMA 89, while EMA 200 remains far above — a classic sign of a medium-term downtrend.
2. Key Resistance Zone
The 95,000–96,000 area (purple zone) is a strong supply / sell zone, aligned with:
Previous support turned resistance
EMA confluence
Any pullback into this zone is likely to attract sellers rather than buyers.
3. Support & Downside Scenarios
First downside target: ~76,700
This is a major demand zone and the 1.618 Fibonacci extension.
If this level breaks:
Price could extend further toward 52,000–53,000, which is a long-term demand area and strong historical support.
4. Year-End Expectation
Without a strong reclaim above 96,000, BTC is more likely to:
Continue sideways to bearish movement, or
Form a bearish pullback before another leg down

Bitcoin Price test the resistance before react bearish Bitcoin Consolidation bearish momentum capped by multiple trendline resistances. Price has failed to reclaim the upper range near 90K / 92K, showing repeated rejections. Current consolidation around 87.5K suggests distribution rather than accumulation.
Technically a potential short-term bounce toward resistance is possible, but failure to break above could lead to a continuation move lower. Key downside targets near 85K, to toward 82.2K.
You may find more details in the chart,
Trade wisely best of luck buddies.
Ps; Support with like and comments for better analysis thanks for supporting.

SOLUSDTENTRY:125.17_123.90
SL:123.25
TP:128.50
**Please observe capital management. There is no responsibility for your profits or losses.**

Forecast Bitcoin 2026
Forecast for Bitcoin's price path - a pullback to the 50 to 60k USD range, from where it will rise to the 300k USD range by the end of 2028/beginning of 2029.

ZEC: Institutional Accumulation + $1,000 Target from Hayes, Key 📊 Overview
Zcash is up over 800% YTD while most altcoins struggle. Arthur Hayes called $1,000 as the "first stop" in late December. Meanwhile, Cypherpunk Technologies (backed by the Winklevoss twins) just bought $29M worth of ZEC and now owns 1.76% of total supply, with plans to reach 5%. The combination of institutional accumulation, supply dynamics, and a high-profile price target makes this setup worth watching.
---
🐋 What the Data Shows
- Cypherpunk Technologies purchased 56,418 ZEC for $29M at an average price of $514
- Total Cypherpunk holdings: 290,062 ZEC (1.76% of supply), targeting 5%
- Significant exchange withdrawals detected from Binance and Kraken
- An estimated 25-30% of all ZEC is held in shielded (private) addresses
- Whale wallets control a substantial portion of circulating supply
---
📈 Technical Setup
Resistance: $550, $600, $744 (ATH from Nov 2025)
Support: $500, $470, $400
Hayes Target: $1,000
ZEC broke out of an ascending triangle pattern and reclaimed the 50-week moving average as support. RSI is approaching overbought territory after the recent rally. A rising wedge on lower timeframes suggests a potential short-term pullback before continuation. The $470 zone shows confluence where daily breakout level, H4 support/resistance, and H1 consolidation align.
---
🎯 Trade Idea
Bias: Long (swing position)
Entry Zone: $470 - $500 (on pullback)
Target 1: $600 (key resistance)
Target 2: $744 (retest ATH)
Target 3: $1,000 (Hayes target, longer term)
Stop Loss: $440 (below $470 confluence zone)
Risk/Reward: Approximately 2.5:1 to first target from $480 entry
---
⚠️ Risks to Consider
- Regulatory pressure: Privacy coins face ongoing scrutiny. Delistings in some jurisdictions could slash liquidity.
- Thin liquidity: High whale concentration and shielded supply mean the market is thin. Moves can be violent in both directions.
- Technical pullback: Rising wedge pattern on lower timeframes. A "reset" to $400 is possible before continuation.
- Leverage risk: Open interest hit $1.3B in late December. Liquidation cascades can accelerate downside quickly.
- BTC correlation: If Bitcoin breaks down hard, ZEC will likely follow regardless of its own setup.
---
📅 Upcoming Catalysts
- Cypherpunk continuing to buy toward their 5% supply target (ongoing demand pressure)
- Grayscale Zcash Trust ETF speculation (potential 2026 filing)
- November 2024 halving effect still playing out (reduced issuance)
- Arthur Hayes' macro thesis: liquidity returning through Fed operations in 2026
---
💡 Conclusion
The institutional accumulation pattern from Cypherpunk is real and verifiable. Hayes' $1,000 call adds narrative momentum. However, after an 800% YTD run, expecting a straight line higher is unrealistic. The $470-$500 zone offers better risk/reward for entries. If $470 fails, $400 becomes the next logical support. Size appropriately for the volatility and regulatory uncertainty that comes with privacy coins.
---
⚠️ Disclaimer
This is not financial advice. Privacy coins carry unique regulatory risks. Always do your own research and manage your risk appropriately.

CHZ USDT
📢 Technical Analysis – CHZ/USDT
🧠 Market Structure Overview
CHZ has been trading inside a long-term descending channel, confirming a broader bearish structure.
However, price is currently located near the lower boundary of the channel, where selling pressure is weakening and accumulation behavior is visible.
This area historically acts as a reaction zone, often leading to corrective or trend-reversal moves.
📐 Chart Pattern & Structure
• Primary Structure: Descending Channel (Long-Term)
• Price is compressing near channel support
• Momentum loss on the downside
• Potential base formation after prolonged decline
📌 This setup suggests a high-probability corrective move rather than continuation straight down.
🟥 Key Resistance Zone
The highlighted red zone above represents a major supply / breakdown area.
A successful reclaim of this zone would confirm a structural shift and open the door for a strong upside expansion.
🟩 Bullish Projection Scenario
If price manages to break and hold above the descending resistance line, the structure supports a potential upside expansion of ~61%, targeting the upper range of the highlighted projection.
📈 This move would be considered a trend correction or early trend reversal, depending on follow-through and volume.
🧩 Technical Confluence
• Long-term descending channel support
• Historical demand zone
• Compression → volatility expansion expected
• Risk-to-reward favors upside from current levels
Indicators are secondary here — price structure and location are the primary drivers.
⚠️ Invalidation Concept
Failure to hold the lower channel support would invalidate the bullish scenario and keep the market in bearish continuation mode.
🧠 Summary
CHZ is still technically in a bearish trend,
but location matters — price is positioned at a level where buyers historically step in.
This makes the chart technically interesting for a potential upside correction, with a projected move of approximately 61% if resistance is reclaimed.

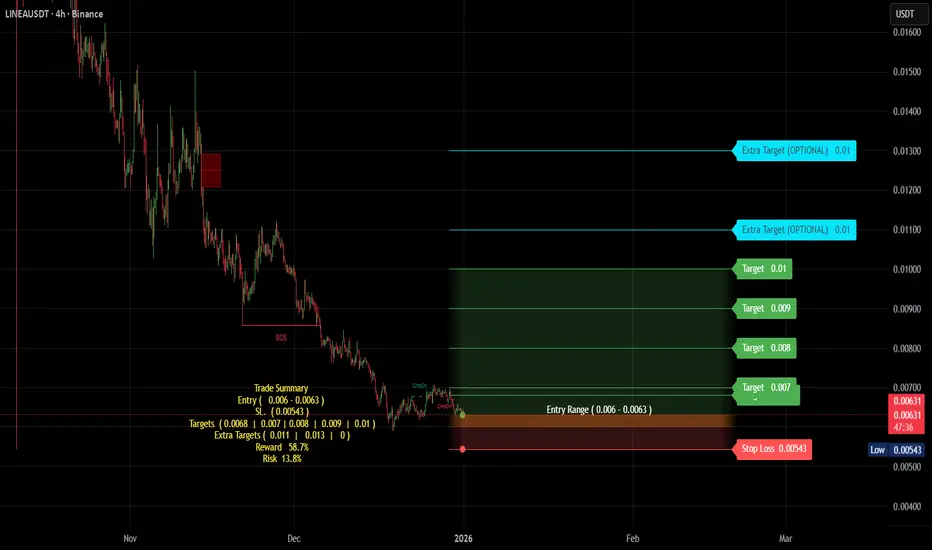
LINEABINANCE:LINEAUSDT
LINEA/ USDT
Entry range (0.0060- 0.0063)
SL 4H close below 0.00543
T1 0.0068
T2 0.007
T3 0.008
T4 0.009
T5 0.010
2 optional extra target on the chart
_______________________________________________________
Golden Advices.
********************
* collect the coin slowly in the entry range.
* Please calculate your losses before the entry.
* Do not enter any trade you find it not suitable for you.
* No FOMO - No Rush , it is a long journey.
$TAO is trading inside a Descending Triangle!! GETTEX:TAO is trading inside a Descending Triangle. It is a decentralized, open source AI network where machine learning models collaborate and earn TAO tokens based on the value they contribute. TAO creates a trustless marketplace for AI, allowing anyone to build, access, and benefit from artificial intelligence in a transparent, incentive driven ecosystem. This positions TAO as a strong contender to lead the AI sector into 2026.
From a price action perspective, TAO is currently trading near a major long term support zone. If price holds the $180 to $170 area and delivers a clear bounce, followed by a decisive breakout above the descending trendline, the structure opens room for a potential 100 percent to 1000 percent upside over the next cycle. The $160 level remains key support, and a clean loss of this level would invalidate the bullish thesis.

CAKE/USDT – Post-Dump Consolidation and Key Levels to WatchCAKE is currently consolidating after a sharp 28% drop earlier in December, setting the stage for potential liquidity sweeps and reactive plays.
🔼 Upside Scenario
Stop Hunt Setup: Price is pushing toward stops above the Dec 29 high at $1.920. A sweep here may provide bulls a clean exit or set up a reversal.
Key Resistance: Watch the $1.9775 level – the top of the unfilled bearish daily gap from Dec 17, aligned with the 18-day EMA, creating technical confluence.
Extended Bull Case: If momentum continues and BTC stays strong, price may target the Dec 15 gap at $2.0843. This zone marks the next major upside liquidity area.
🔽 Downside Scenario / Support Zones
Immediate Support: Around $1.8665, particularly if Monday’s low holds above Saturday’s high, forming a bullish daily gap.
Rejection Zone: Multiple bearish rejections since Dec 20 reinforce this support area.
Deeper Pullback:
Equal lows at $1.7890 and $1.7670 could become bearish targets.
$1.7943 (Dec 18 rejection) may act as a reaction level for bulls.
Below $1.7670, next structural supports are weak until $1.7200 and $1.7000, which are psychological levels where bulls may step in.
