$IDOL 3D CHART UPDATE
📌$IDOL is moving in an uptrend, respecting the rising trendline clearly 📈
📌Price already touched this trendline 2 times before and each time we saw a good pullback to the upside ✅
📌Now again, price is testing the same trendline area 👀
📌Important part:
👉 If price holds this trendline, we can expect another upward move 🚀
Crypto market

ROSEBINANCE:ROSEUSDT
ROSE/ USDT
Entry range (0.100- 0.106)
SL 4H close below 0.0098
T1 0.0110
T2 0.0120
T3 0.0140
T4 0.0155
T5 0.0170
1 optional extra target on the chart
_______________________________________________________
Golden Advices.
********************
* collect the coin slowly in the entry range.
* Please calculate your losses before the entry.
* Do not enter any trade you find it not suitable for you.
* No FOMO - No Rush , it is a long journey.

BTCUSDT the broken trendline is good sign of Upcoming PumpAs observed on the chart, Bitcoin has broken above a key daily trendline. For this breakout to be validated , a successful retest of the trendline as support is now anticipated, ideally accompanied by a noticeable increase in trading volume .
A decisive daily close above the $90,000 resistance level, following this retest, would serve as strong confirmation of a structural shift and likely signal the beginning of a renewed bullish phase.
DISCLAIMER: ((trade based on your own decision))
<<press like👍 if you enjoy💚

ETHUSDT the Red trendline resistance cause this sell pressureAs observed on the chart, Ethereum has faced repeated rejections at this descending trendline resistance. Critically, the selling pressure at each subsequent test appears to be diminishing—a sign of waning bearish momentum and potential buyer accumulation.
This pattern of weakening reactions often precedes a breakout. A decisive move above this trendline, confirmed by a sustained increase in volume, would signal a shift in market structure and could initiate a strong upward impulse. Based on the pattern's dimensions, the initial technical target following a confirmed breakout is projected near the $4,000 level.
DISCLAIMER: ((trade based on your own decision))
<<press like👍 if you enjoy💚

ZECUSDT targeting 1000$ now or after some restAs previously noted, ZECUSDT is approaching the critical $600 resistance zone, which may result in near-term consolidation or a minor pullback. However, should the price achieve a decisive breakout above this resistance it would signal a significant shift in market structure. In such a scenario, the next primary technical target would be projected toward the $1,000 level.
also we should consider that we need first breakout above 600$ because that ascending channel in dump may be charge and fuel for more dump.
DISCLAIMER: ((trade based on your own decision))
<<press like👍 if you enjoy💚

XRPUSD XRP- Gann Square of Nine Chart DailySome price and time projections using june to dec solstice time period via gann square of nine method.
4.15; 5.27 price level correlates to .5 and .618 fib extensions.
Support at 1.71 (.5 fib); 1.44; 1.11; 0.6.

ETHUSD 2H Chart Pattern ...ETHUSD 2H Chart Pattern
Bias: Bullish breakout above descending trendline
Buy Zone: 2,980 – 3,020
Target 1 (TP1): 3,080
Target 2 (TP2): 3,150
Target 3 (TP3 / Main Target): 3,170 – 3,200 🎯
Stop Loss: Below 2,950
Explanation:
Price has broken the descending trendline and is holding above support. Momentum favors continuation toward the marked target point near 3,170+.

BTCUSDBTC
Expectd with the curve line trends will follow but
stronger resistance 88-90k for now .
and relate this post to the last post of BTCUSD . LONGER TIME PERIOD UPTRENDS'.
FOR EDUCATIONAL PURPOSES ONLY.

GAS Buy/Long Signals (4H)Price is currently trading at a major key level, which is an important area to watch for a potential reaction. A strong bullish CH has formed on the chart, indicating a clear shift in market sentiment. The overall price structure is supportive of buy/long positions, and as long as this structure remains intact, our primary focus is on looking for long opportunities within this setup.
There are two well-defined entry zones marked on the chart, and positions should be built using a DCA strategy to optimize entries and manage risk effectively.
targets:2.030$ _ 2.151$_ 2.24$
Once the first target is reached, it is recommended to move the position to break-even to protect capital and secure a risk-free trade.
If you would like us to analyze a coin or altcoin for you, first like this post, then comment the name of your altcoin below.

BTCUSD (1H) chart pattern...BTCUSD (1H) chart pattern.
📈 BTCUSD – Bullish Targets
Current Bias: Bullish continuation
🎯 Target 1: 90,500 – 91,000
🎯 Target 2: 93,500 – 94,000
📌 Price is holding above the support zone (around 88,000 – 88,500) and showing higher highs, indicating buyers are in control.
🔑 Key Support:
88,000
87,500 (strong support)
⚠️ Invalidation:
If price breaks and closes below 87,500, bullish setup may fail.
If my want, I can also give:
📉 Sell scenario
🛑 Proper SL (Stop Loss)

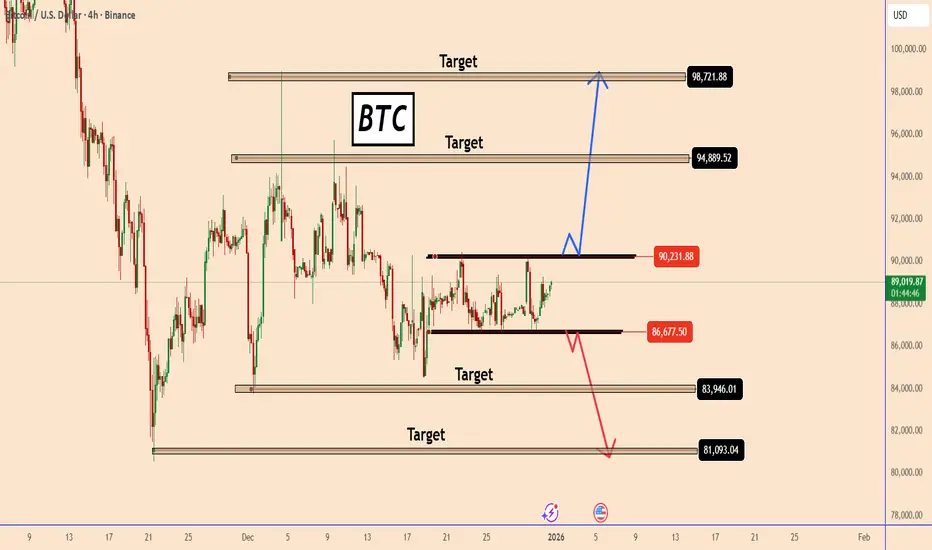
BTC at a Critical Range: Breakout or Breakdown AheadBTC at a Critical Range: Breakout or Breakdown Ahead
BTC is currently consolidating inside a well-defined range, showing clear indecision between buyers and sellers. Price has been respecting both the upper and lower boundaries of this structure, making this zone a key decision area.
Bullish Scenario:
A confirmed breakout above 90,200 could open the way toward higher targets at 94,800 and potentially 98,700, indicating a continuation of the bullish recovery.
Bearish Scenario:
On the other hand, a breakdown below 86,600 would invalidate the range and may trigger a bearish continuation toward 83,900 and 81,000.
Until a clear break occurs, patience is required. The next impulsive move is likely to be strong.
You may find more details in the chart!
Thank you and Good Luck!
PS: Please support with a like or comment if you find this analysis useful for your trading day
trading mistakes you should leave in 20252025 was a loud year in the markets. Volatility exposed bad habits, punished weak discipline, and rewarded structure. If you’re serious about longevity, these are the trading mistakes that must stay behind as we move forward.
Overtrading
More trades ≠ more money.
In 2025, many traders got chopped by high-frequency noise, especially during range-bound conditions in FX and crypto. Overtrading increases fees, emotional fatigue, and lowers decision quality. Capital is a resource, protect it.
Rule: If there’s no clear setup, there’s no trade.
No Plan or Strategy
Random entries don’t magically become profitable.
A trading plan defines when you trade, why you trade, and when you’re wrong. Traders without a plan in 2025 were essentially liquidity for those who had one.
Rule: If you can’t explain the trade before entry, don’t take it.
No Stop Loss
Hope is not risk management.
Markets don’t care about your bias. 2025 proved again that tail events happen faster than most expect. No stop loss = unlimited downside.
Rule: Every trade must have a predefined invalidation level.
Wrong Expectations
Expecting daily profits is a fast way to blow an account.
Professional trading is probabilistic, not linear. Even profitable systems experience drawdowns. Unrealistic expectations led many to revenge trade in 2025.
Rule: Think in series of trades, not single outcomes.
Predicting Movements
The market doesn’t reward predictions, it rewards reactions.
Trying to “call the top” or “buy the exact bottom” was expensive in 2025, especially during macro-driven trends.
Rule: Let price confirm. React, don’t predict.
Random Trading
No context. No bias. No edge.
Jumping between timeframes, assets, and ideas without structure is gambling. Random trading thrives in hype, not in consistency.
Rule: One model, one execution process.
Oversized Positioning
Position size killed more accounts than bad analysis in 2025.
Even a good setup becomes a bad trade when size is too large. Volatility expansion exposed poor risk management across markets.
Rule: Size for survival first, profits second.
Holding Losing Trades
Loss aversion is expensive.
Holding losers “until it comes back” locked traders into dead capital while better opportunities passed by.
Rule: Small losses are tuition. Big losses are ego.
Trading for Excitement
If you’re bored, the market owes you nothing.
Trading for dopamine instead of execution discipline turned many accounts into entertainment expenses in 2025.
Rule: Boring trading is usually profitable trading.
Not Doing the Homework
Ignoring fundamentals, higher-timeframe structure, or session context showed up brutally in 2025. News, liquidity cycles, and macro themes mattered.
Rule: Preparation is part of the edge.
nerdy thought
Leaving these mistakes in 2025 isn’t about perfection, it’s about professionalism. The market in 2026 will be even more efficient, faster, and less forgiving.
Survive first.
Then grow.
put together by : Pako Phutietsile as @currencynerd
courtesy of : @TradingView

$PUMP Coin Long Incoming?Based on the current buyback policy, where the PUMP company repurchases $1–2 million worth of tokens per day, which appears to represent roughly 98 % of the company’s current earnings, a potential long position when the fully diluted valuation (FDV) reaches $500 million (down from the current ~$1.8 billion) could be considered. However, this idea needs to be evaluated within the broader market context. If Bitcoin were to decline to around $50,000, it is conceivable that PUMP’s price could also pull back toward an FDV of $500 million. This is because crypto asset prices are influenced not only by fundamentals like buybacks and earnings but also by overall market sentiment, supply and demand dynamics, and volatility. A useful historical analogy is Amazon during the 2000s dot-com crash. Despite improving financial performance, Amazon’s share price fell sharply as market sentiment deteriorated. Similarly, even if PUMP’s fundamentals remain solid, it could still experience significant price declines during a broader crypto market downturn, especially if speculative demand weakens. Furthermore, if Bitcoin’s price drops and general participation in the crypto ecosystem shrinks, fewer meme coins may be created on PUMP’s platform. This could reduce transactional volume and potentially diminish the company’s buyback capacity. Finally, the buyback program is not guaranteed, the company may choose to reduce or stop repurchases in the future. Taken together, while a long position near an FDV of $500 million might present an interesting risk-reward setup, it carries significant downside risk if market conditions deteriorate or if buybacks are reduced.
[ As a conclusion:
The idea of going long around an FDV of $500 million is interesting because current buybacks provide visible support. However, this strategy is highly dependent on market sentiment, Bitcoin’s price trajectory, and the continuation of the buyback program. In a market downturn, even a strong buyback mechanism may not prevent significant price declines.
Disclaimer:
This analysis is for informational and educational purposes only and does not constitute financial advice, investment recommendation, or an offer to buy or sell any securities. Stock prices, valuations, and performance metrics are subject to change and may be outdated. Always conduct your own due diligence and consult with a licensed financial advisor before making investment decisions. The information presented may contain inaccuracies and should not be solely relied upon for financial decisions. I am not personally liable for your own losses; this is not financial advice.

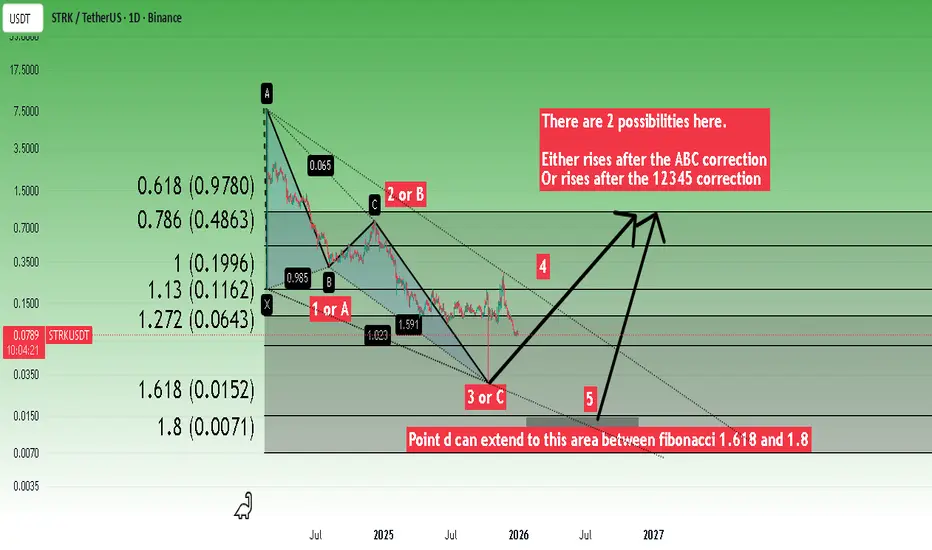
Bullish Harmonic Deep Crab PatternOne of the projects whose technology I like.
I tried to draw two possible scenarios for educational purposes.
* The purpose of my graphic drawings is purely educational.
* What i write here is not an investment advice. Please do your own research before investing in any asset.
* Never take my personal opinions as investment advice, you may lose your money.
Vet buy from 0.003-0.005Hard to believe it but seems like it is heading towards that area .
I will consider buying from 0.005$ region.
This reminds me of 2019 2020.
Great opportunities ahead of us .
We should not let this get away .

Binance Coin Wave Analysis – 31 December 2025 - Binance Coin broke Descending Triangle
- Likely to rise to resistance level 911.00
Binance Coin cryptocurrency recently reversed from the support area between the support level 825.55 (lower border of the sideways price range from November) and the lower daily Bollinger Band.
The upward reversal from the support level 825.55 started the active impulse wave 3 – which then broke the daily Descending Triangle from November.
Binance Coin cryptocurrency be expected to rise to the next resistance level 911.00 (upper border of the active sideways price range and the target for the completion of the active impulse wave 3).

Uniswap Wave Analysis – 31 December 2025
- Uniswap reversed from resistance area
- Likely to fall to support level 5.500
Uniswap cryptocurrency recently reversed from the resistance area between the key resistance level 6.5 (which has been reversing the Uniswap from the end of November), upper daily Bollinger Band and the 50% Fibonacci correction of the downward impulse from November.
The downward reversal from this resistance area created the daily Shooting Star – which started the active impulse wave 3.
Given the clear daily downtrend, Uniswap cryptocurrency be expected to fall to the next strong support level 5.500 (low of the previous minor correction).

RIVER/USDT — Range Reaccumulation and Expansion SetupHey there!!
📈 RIVER/USDT — Range Reaccumulation and Expansion Setup
December 31, 2025
RIVER is currently trading inside a well-defined reaccumulation range after an initial impulse move.
Price action suggests the market is absorbing supply above the base, preparing for a potential continuation toward higher liquidity zones.
This structure often precedes trend resumption, not reversal.
🔍 Technical Overview
Current price: ~$8.32
4EMA cluster: ~$4.5–4.8
→ Price is comfortably above EMAs, confirming a bullish market regime.
Volume expansion is visible on recent rebounds from support, indicating renewed participation rather than weak corrective bounces.
📊 Market Structure Breakdown
1. Impulse move & distribution
RIVER previously printed a strong impulsive rally, followed by a distribution phase near the highs.
That process flushed late longs and reset momentum without breaking the broader structure.
2. Reaccumulation range
Price is now consolidating between:
Major support: ~$3.0–3.5
Range high / resistance: ~$9.0–9.5
This is a classic reaccumulation structure:
Higher timeframe trend intact
Sideways price action
Volatility compression
Smart money typically uses this phase to reload positions.
3. Compression + higher lows
Recent price action shows:
Rising local lows
Price respecting dynamic EMAs
Failed breakdown attempts below mid-range
This suggests buyers are in control, gradually tightening the range.
🧱 Key Levels
Major Support Zones
$3.0–3.5 → macro accumulation base
$5.5–6.0 → mid-range support / acceptance area
EMAs (~$4.5) → dynamic trend support
As long as RIVER holds above $5.5, the structure remains constructive.
Resistance / Targets Ahead
$9.0–9.5 → range high / breakout trigger
$15–16 → first major upside liquidity zone
$23–24 → higher timeframe target / supply zone
These levels align with prior inefficiencies and untouched liquidity.
🎯 Outlook
RIVER is not breaking out yet, but it is building pressure.
Bullish scenario:
Price holds above $5.5–6.0
Clean break and acceptance above $9.5
If confirmed, continuation toward $15+ becomes highly probable.
Bearish scenario:
Loss of $5.5,
which would imply extended consolidation, not trend failure.
🧠 Final Thought
This is the phase where price looks boring, but structure improves.
RIVER is compressing inside a bullish framework — and those are often the moves that expand the hardest once released.
Happy NewYear to all :-)

ZEC / USD – Daily – Structural Update (Bullish going into 2026)ZEC remains in a higher timeframe uptrend despite the recent pullback. The move lower from the recent highs is corrective in nature and fits within a rising channel structure that developed after the strong bounce from the $300 region. No daily lower low has formed, keeping the broader bullish structure intact.
The $300–310 zone remains the most important level on the chart. This area marks the macro breakout base and prior demand. As long as daily closes hold above this level, the bullish thesis remains valid and the trend favors continuation into 2026 rather than a full reversal.
Price is currently consolidating between roughly $450 and $550. This zone is acting as a compression area following the last impulse leg. Dips into the $420–450 region have been bought and continue to form higher lows, suggesting accumulation rather than distribution.
A sustained reclaim and hold above the $520–550 range would signal trend continuation and open the door for a move toward $600, followed by $680 and potentially the upper channel region near $750–800 over time.
Volume behavior supports this view, with expansion on upside moves and contraction on pullbacks. Momentum has cooled but remains constructive, resetting conditions for another expansion leg rather than signaling exhaustion.
The primary risk to this view is a daily close below $300, which would break the macro structure and invalidate the bullish continuation scenario. Until that occurs, this remains a buy-the-dip environment, favoring patience and entries on controlled pullbacks rather than chasing strength.
Overall bias remains bullish, with ZEC consolidating above its breakout base and positioning for potential continuation into 2026.

#POLYX/USDT Bullish Reversal in MAGICUSDT Accumulation Zone#POLYX
The price is moving in a descending channel on the 1-hour timeframe. It has reached the lower boundary and is heading towards a breakout, with a retest of the upper boundary expected.
We are seeing a bearish bias in the Relative Strength Index (RSI), which has reached near the lower boundary, and an upward bounce is expected.
There is a key support zone in green at 0.0480, and the price has bounced from this level several times. Another bounce is expected.
We are seeing a trend towards stabilizing above the 100-period moving average, which we are approaching, supporting the upward trend.
Entry Price: 0.0500
First Target: 0.0513
Second Target: 0.0536
Third Target: 0.0561
Remember a simple principle: Money Management.
Place your stop-loss order below the green support zone.
For any questions, please leave a comment.
Thank you.

#EDU/USDT Forming Bullish Momentum#EDU
The price is moving in a descending channel on the 1-hour timeframe. It has reached the lower boundary and is heading towards breaking above it, with a retest of the upper boundary expected.
We have a downtrend on the RSI indicator, which has reached near the lower boundary, and an upward rebound is expected.
There is a key support zone in green at 0.1418. The price has bounced from this zone multiple times and is expected to bounce again.
We have a trend towards consolidation above the 100-period moving average, as we are moving close to it, which supports the upward movement.
Entry price: 0.1441
First target: 0.1454
Second target: 0.1469
Third target: 0.1491
Don't forget a simple principle: money management.
Place your stop-loss order below the green support zone.
For any questions, please leave a comment.
Thank you.

ALICE USDT
📊 Technical Analysis – ALICE/USDT
(Structure-Based | No Entry / No TP / No SL)
🧠 Market Structure Overview
ALICE is currently trading inside a contracting structure formed by two white trendlines, creating a descending wedge / falling wedge–like formation.
Price is making lower highs and higher lows simultaneously.
Volatility is compressing.
Momentum is slowing near the lower boundary of the structure.
This type of compression often precedes a trend reversal or strong directional expansion.
📐 Pattern Interpretation (Key Focus)
Pattern Type: Descending Wedge / Contracting Structure
Key Observation:
The two white trendlines act like a wedge narrowing toward the right.
Price is currently moving toward the lower white trendline, which is a critical decision zone.
📌 Your expectation is technically valid:
Waiting for price to reach the lower white trendline and observing reaction is the correct and professional approach.
🔍 Price Behavior at the Lower White Trendline
The lower boundary represents:
Structural support
Potential demand re-entry zone
Area where sellers may lose control
Possible reactions at this level:
Strong bullish rejection (long wicks, impulsive candles)
Momentum shift
Break of internal micro structure
Only after reaction, continuation toward the upper boundary becomes valid.
🔄 Expected Market Logic
Compression → Liquidity builds
Test of lower trendline → Decision point
If support holds → Expansion to the upside
Upper white trendline becomes the next structural objective
📈 This is why this structure is often associated with trend transition from bearish to bullish.
📊 Indicator Context (Secondary Confirmation)
Momentum indicators are flat → confirms compression
No aggressive bearish momentum → selling pressure weakening
Indicators support patience, not anticipation
🧩 Summary (Clean & Post-Ready)
ALICE is compressing inside a descending wedge formed by two white trendlines.
Price is approaching the lower boundary of the structure.
This zone is critical for observing buyer reaction.
A confirmed hold and reaction can lead to a bullish expansion.
No prediction — only structure-based expectation.

2026...As we enter 2026, investors face a complex but opportunity-rich landscape shaped by shifting monetary policy, technological transformation, and global macroeconomic forces. Below is a comprehensive breakdown of top financial assets to watch, backed by reputable forecasts and trends.
Equities (Stocks)
U.S. Large-Caps & Technology
Why watch?
Strong corporate earnings growth expected to support equity markets, especially in the U.S. and tech sectors. Major investment banks see global equities rising in 2026 as rate cuts and robust earnings underpin valuations.
Artificial intelligence adoption continues to drive revenue growth and capital allocation within the technology sector, presenting structural growth beyond cyclicality.
Key Insight: Focus on market leaders in AI and tech but emphasize quality cash-flow profiles, given valuation dispersion expected next year.
Emerging Markets Equities
Why watch?
Emerging markets are poised to benefit from a weaker U.S. dollar, positioning their equities attractively compared with developed markets.
Regional growth, especially in Asia (e.g., India), is projected to outperform thanks to strong GDP growth and corporate earnings.
Takeaway: EM equities can capture both currency advantage and growth dynamics in 2026.
Fixed Income (Bonds)
Emerging Market Debt
Why watch?
A weaker dollar and improving fiscal conditions in many emerging economies could support local-currency bonds and yield spreads.
Euro area and select developed market sovereigns (e.g., German Bunds) may also present opportunities as inflation stabilizes, offering real yields for global investors.
Investment Grade & High Yield
Why watch?
Investment-grade corporate credit can still offer attractive carry, although tight spreads limit upside from risk compression alone.
High yield remains neutral overall, but specific issuers with strong fundamentals could outperform.
Takeaway: Bonds remain part of steady yield strategies — especially for income-oriented portfolios — but require meticulous credit selection.
Commodities
Gold & Precious Metals
Why watch?
Gold has rallied due to safe-haven demand, central bank purchases, and real-rate dynamics. Analysts project continued positive fundamentals into 2026.
Declining real rates and geopolitical uncertainties support the case for gold as a hedge.
Investor Implication: Gold remains a key diversifier and inflation hedge, though it doesn’t generate income.
Base & Strategic Metals
Why watch?
Metals like copper, tied to electrification and renewable energy demand, could benefit from structural drivers in energy transition and decarbonization.
Rare earths and specialized metals linked to AI and green tech offer niche long-term opportunities.
Currencies
U.S. Dollar
Why watch?
Forecasts point to a modest weakening of the U.S. dollar in 2026, opening potential carry opportunities in other major and emerging currencies.
Dollar trends will influence cross-asset returns and emerging markets’ relative attractiveness.
Digital Assets & Crypto
Bitcoin (BTC) and Crypto Leaders
Why watch?
Crypto is entering an “integration phase” where digital assets intersect with broader financial markets and tokenization grows.
Some asset managers project Bitcoin could rebound strongly as monetary policy becomes more accommodating.
Note: This market remains volatile and speculative, suitable for tactical exposure alongside traditional allocations.
Real Assets & Alternatives
Real Estate & Infrastructure
Why watch?
Real assets like real estate investment trusts (REITs) and global infrastructure often offer inflation-linked cash flows and diversification.
Long-term infrastructure trends (energy transition, digital infrastructure) are backed by policy initiatives, especially in Europe and Asia.
Private Markets
Why watch?
Private equity and direct lending sectors continue to show higher expected returns than many traditional assets, driven by structural growth and yield premia.
How to Use This Outlook
Diversification Strategy:
Core equity exposure to U.S. and emerging markets
Fixed income diversification with emerging debt and selective credit
Commodities & hedges via gold and strategic metals
Tactical digital assets for growth potential
Real assets & alternatives for long-term structural gains
Risk Management:
Expect dispersion across and within asset classes, manage through disciplined position sizing, stop levels, and macro awareness.
put together by : @currencynerd
