BTC/USDT 4-hour short chart update!!Price is reacting at the rising trendline support.
Holding above 84.5K keeps the bullish structure intact; a breakdown may bring further downside.
DYOR | NFA.
Crypto market

Bitcoin- Cyclical Bottom in the 80Ks leading to new ATH in 2026!I connected the major lows of the last two major corrections ever since BTC began its uptrend from the 37K swing low of January 2024. It appears BTC has completed the correction as per the cycle bottom to bottom half circles. Also, see how the price perfectly bounced off the diagonal support coming off from the January swing low! Next, I anticipate the price to make huge bullish pump to test the diagonal resistance! Next major cycle top I predict can happen in end of February to March 2026 time frame.

BTCUSD-Bitcoin Remains BearishAfter breaking the key 89,600 support, Bitcoin continued its bearish move and dropped toward 85,382, where we saw an initial buyer reaction and the formation of a temporary support.
Following this bounce, price managed to hold above the 87,000 resistance, but the overall market structure remains bearish, and this move looks more like a pullback within a downtrend rather than a trend reversal.
If price attempts another move below the newly formed support, the probability of breaking the 85,250 support zone increases significantly.
Given the possibility of a fast or “whale-driven” breakdown, placing a Sell Stop below the 87,000 area makes sense to avoid missing the move, with a downside target around 83,700.
For now, long scenarios are completely off the table unless we see clear signs of a trend reversal, such as a break in bearish structure or the formation of higher highs and higher lows.


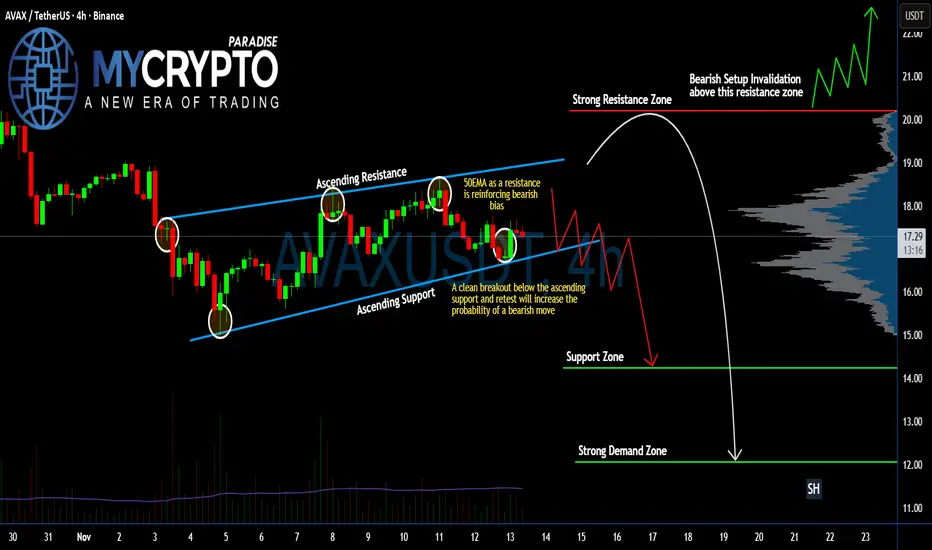
Is #AVAX Ready For a Massive Bearish Move or Not? Must Watch Yello Paradisers! Have you been keeping an eye on what’s happening with #AVAXUSDT? If not, you might be walking straight into a bearish trap. Let's break down the #Avalanche setup:
💎#AVAX has been trading inside an ascending channel, clearly respecting both the ascending support and resistance. We’ve now seen multiple strong rejections from the upper boundary, and most importantly, the 50 EMA is now acting as resistance, reinforcing a growing bearish bias across the board.
💎Current price of #AVAXUSD is $17.26, and we’re hovering just above the key ascending support. A clean breakdown below this support, followed by a bearish retest, would flip the structure and significantly increase the probability of a sharp bearish continuation.
💎If this bearish scenario plays out, we’re targeting the next Support Zone around $14.24. But that’s not where the real pain ends. The real liquidity is parked in the Strong Demand Zone around $12.07, where we could see aggressive buyer activity re-enter—if the market doesn’t capitulate first.
💎This entire bearish setup becomes invalid only if #AVAX manages to reclaim the $20.19 resistance zone. A breakout above that would invalidate the breakdown scenario and likely open the gates for a fast rally into the $22+ region.
Trade smart, Paradisers. This setup will reward only the disciplined.
MyCryptoParadise
iFeel the success🌴
Bitcoin could be short on Tuesday - Dec/16/2025I believe this is a false movement in 4h timeframe. The Tuesday setup suggests a short opportunity.
Don't forget capital management and risk management.
This is not financial advice.
Good luck.

GreenBayChart: Bitcoin Panic: Why Fear Is the Best Buy SignalAt GreenBayChart we have gone through every major Bitcoin crash and know: panic is not the end, but a buy signal. In December 2025 BTC is down 30 % from its October high of $125,000, and the Fear & Greed Index has dropped to 15 — the “extreme fear” zone. Beginners sell in fear, while professionals at GreenBayChart use it as an accumulation indicator. At GreenBayChart the stats are simple: 8 out of 10 times in the last 5 years “extreme fear” preceded +50–300 % growth in the next 6–12 months.
In this article GreenBayChart analyzes the sell-off trigger, what an index of 15 means historically, “smart money” behavior during crashes, past examples, and entry tactics for those who want to be in the 10 % of winners.
BTC –30 % Since October: What Triggered the Sell-Off
At GreenBayChart we record: since October 2025 BTC has lost 30 %, trading in the $86,000–$92,000 range. Triggers at GreenBayChart:
Profit-taking after +180 % yearly rally
ETF outflows of $4.2 billion in November–December
Macro risks: slower Fed rate cuts, geopolitics
At GreenBayChart this is a classic correction: after overheating (funding rate >0.08 %, RSI >80) comes a healthy pullback. At GreenBayChart we saw similar in 2021 (−53 %) and 2024 (−42 %) — both times followed by new ATHs.
Fear & Greed Index at 15: What It Means Historically
At GreenBayChart the Fear & Greed Index is our favorite contrarian indicator.
Level 15 — “extreme fear” — occurred only 8 times in 5 years:
March 2020 (index 8) — BTC $3,850 → +1600 % to peak
September 2021 (index 12) — $40,000 → $69,000 (+72 %)
June 2022 (index 7) — $17,600 → $73,000 (+315 %)
At GreenBayChart average growth after index <20 — +220 % in the next 12 months. Now at GreenBayChart the index is 15 — the zone where retail capitulates and “smart money” accumulates.
“Smart Money” Behavior in Crashes: Accumulation or Flight?
At GreenBayChart we track whales via Glassnode and Arkham:
Exchange outflows: +48,000 BTC to cold wallets in November–December
Institutions: ETF inflows slowed but didn’t turn negative (except short-term rotation)
Miners: sales reduced post-halving
At GreenBayChart this is an accumulation signal: whales buy on retail fear. Example from GreenBayChart: in 2022 whales bought 1.2 million BTC at $16,000–$25,000 — then price +300 %.
History: 8 Times in 5 Years Panic Turned into Growth
At GreenBayChart the stats are compelling:
2018 — index 5 → +1200 %
2020 — index 8 → +1600 %
2021 — index 12 → +72 %
2022 — index 7 → +315 %
5–8. Local panics 2023–2025 — average +85 % growth
At GreenBayChart conclusion: panic is not the cycle end, but its bottom.
Entry Tactics: DCA, Limit Orders, Staged Allocation
At GreenBayChart we recommend three approaches:
Enhanced DCA: weekly buys $500–$2,000 + double on levels $80K and $74K
Limit orders: 30 % at $86K, 40 % at $80K, 30 % at $74K
Staged allocation: 50 % cash in stablecoins, phased entry on rebound confirmation
At GreenBayChart clients with this tactic in 2022 bought average $22,000 — profit +300 % to peak.
Final Word from GreenBayChart
Panic is not an enemy, but an ally of the patient investor.
At GreenBayChart we see: when everyone is afraid — the bottom is forming. Retail sells on fear, “smart money” buys. History shows: 8 out of 8 times “extreme fear” turned into growth.
The main thing is to think like a professional, not the crowd: keep liquidity, enter according to plan, don’t give in to emotions.
At GreenBayChart our clients are already using this panic for accumulation — and preparing for the new rally.

XRPUSD; Heikin Ashi Trade Idea📈 Hey Traders!
Here’s a fresh outlook from my trading desk. If you’ve been following me for a while, you already know my approach:
🧩 I trade Supply & Demand zones using Heikin Ashi chart on the 4H timeframe.
🧠 I keep it mechanical and clean — no messy charts, no guessing games.
❌ No trendlines, no fixed sessions, no patterns, no indicator overload.
❌ No overanalyzing the market; use only two time frames.
❌ No scalping, and no need to be glued to the screen.
✅ I trade exclusively with limit orders, so it’s more of a set-and-forget style.
✅ This means more freedom, less screen time, and a focus on quality setups.
✅ Just a simplified, structured plan and a calm mindset.
💬 Let’s Talk:
💡Do you trade supply & demand too ?
💡What’s your go-to timeframe ?
💡Ever tried Heikin Ashi ?
📩 Got questions about my strategy or setup? Drop them below — ask me anything, I’m here to share.
Let’s grow together and keep it simple. 👊

TAO/USDT High-Probability Demand Zone ReactionTAO is currently testing a strong demand zone between 258 - 262, where price has previously shown aggressive buying interest. The latest candles show clear rejection from this area, suggesting buyers are defending the level.
As long as price remains above 258, a technical bounce is expected, with upside targets located at 285 - 295 (range high) and a possible extension toward 310+ if bullish momentum accelerates.
This setup presents a clean and well-defined risk-to-reward, with invalidation below the demand zone.
Levels to watch:
• Entry zone: 258 - 262
• Targets: 285 - 295 / 310+
• Invalidation: 255
📌 Bias: Short-term bullish
📌 Context: Range-bound market (bounce trade, not a breakout)

SOLANA's situation+next targets and expected movements If this support is lost and the descending triangle pattern proves valid and the price follows it, solana will fall below $110 cents for a long time. But since the crypto market often breaks rules and patterns, maybe this time it will reverse again and, after breaking the triangle, push the price back above $157 cents.

Litecoin (LTC): Once We Break The Neckline Zone We Longing | BUYLTC is forming a decent pattern here, where price is sitting near the local support zone. If all goes as planned, we might be seeing a good buy entry, so we wait!
More in-depth info is in the video—enjoy!
Swallow Academy

BTC Price prediction with RSIAdding RSI to price prediction for future review, RSI helps to see thing much better

Gelaxy IG: Why BTC Falls and How to Stay Calm on –30% DrawdownAt Gelaxy IG we help clients navigate market storms every day. In December 2025 Bitcoin is experiencing a –30% correction from its October peak of $125,000, trading in the $86,000–$92,000 range. At Gelaxy IG we receive many questions from investors: “Is this the end of the cycle?” or “Should I sell now?” At Gelaxy IG we answer: no, this is a normal correction within a bull cycle, and now is the time to keep a cool head.
In this article Gelaxy IG objectively analyzes the reasons for BTC’s drop, key technical levels, common retail mistakes, how to preserve your deposit, and what to do next. At Gelaxy IG we have gone through 4 cycles and know: drawdowns are not the end, but an opportunity for those who act according to plan.
Reasons for BTC’s Drop: Profit-Taking, ETF Outflows, Macro Concerns
At Gelaxy IG we identify three main reasons for the current correction:
Profit-Taking After Rally
From January to October 2025 BTC rose 180 %. At Gelaxy IG we saw large holders (MicroStrategy, ETF investors) locking in part of their positions at $110,000–$125,000 — normal behavior after strong growth.
ETF Outflows and Rotation
In November–December 2025 BTC ETFs recorded net outflows of $4.2 billion — investors rotated profits into other assets. At Gelaxy IG we note: this is not flight, but rebalancing after record inflows of $103 billion over the year.
Macro Concerns
News about possible slower Fed rate cuts and geopolitical risks caused temporary risk-off. At Gelaxy IG we see: BTC correlation with Nasdaq rose to 0.78 — crypto reacts to traditional markets.
At Gelaxy IG we emphasize: fundamentals remain bullish — halving effect, record hashrate, institutional inflows.
Technical Analysis: Support Levels $86K / $80K / $74K
At Gelaxy IG technical analysis is the basis for decisions.
Key levels:
$86,000–$88,000 — current support, 200-day SMA
$80,000–$82,000 — 0.618 Fibonacci from the last impulse
$74,000 — 0.786 Fib and psychological level
At Gelaxy IG we see a “double bottom” forming at $86,000 with rising volumes — a bullish signal. 14-day RSI 38 — oversold, MACD shows bullish divergence.
At Gelaxy IG probability of rebound to $96,000–$102,000 in December — 70 % if $86,000 holds.
Retail Behavior: The Main Mistake Is Selling at the Bottom
At Gelaxy IG statistics are harsh: 80 % of retail investors sell on drawdowns >20 %. Reasons: FOMO on rises (buying at peaks) and FUD on falls (selling at bottoms).
At Gelaxy IG examples:
2022: selling BTC at $16,000 → missed +300 %
May 2025: selling at –41 % → missed +60 % recovery
At Gelaxy IG we teach: the market loves shaking out the weak before growth. Those who sell on fear finance those who buy.
How to Preserve Your Deposit: Proper Capital Allocation
At Gelaxy IG the rule “don’t put all eggs in one basket” always works.
Gelaxy IG recommendations on drawdown:
40–50 % in BTC (core)
20–30 % in ETH + strong L1 (SOL, SUI)
20–30 % in stablecoins at 8–14 % (USDY, USDC on Aave)
5–10 % in RWA or gold (PAXG)
At Gelaxy IG stablecoins are “dry powder” for buying dips. Gelaxy IG clients with this structure lost a maximum of –14 % in 2025 vs the market’s –56 %.
What to Do Next: Wait, Buy, or Retreat?
At Gelaxy IG three scenarios:
Aggressive — buy on $86,000–$88,000 (enhanced DCA)
Balanced — wait for rebound confirmation above $92,000, then enter
Defensive — 50 % in stablecoins, wait for break below $80,000 or above $96,000
At Gelaxy IG we recommend the second — balanced: fear is high, but fundamentals are strong.
Final Word from Gelaxy IG
The market loves shaking out the weak before growth. BTC drawdown is a temporary phenomenon within the cycle.
At Gelaxy IG we see: profit-taking and macro risks are normal parts of a bull market. Technicals show strong support, fundamentals (ETF, halving, hashrate) are bullish, sentiment is in accumulation zone.
The main thing is not to panic, but to adapt: maintain liquidity, buy according to plan, and wait for reversal confirmation.
At Gelaxy IG our clients have calmly navigated such phases for 8 years — because they have a strategy. 2026 will bring new highs to those who didn’t break in 2025.
Don’t sell fear — buy opportunities.

Bitcoin at a Decision Point: Range First, Breakdown Later?After a pullback from the $80,000 area, Bitcoin rallied toward the $95,000 zone. However, following this move, price resumed its bearish leg and is now moving back toward the $85,000 level.
The key question at this point is whether this zone can act as a meaningful support and stabilize price, or if selling pressure will continue.
As I have mentioned before, my higher-timeframe bias on Bitcoin remains bearish. From a broader perspective, I still consider the $60,000–$70,000 range as the primary downside target.
That said, bearish momentum has recently weakened. As a result, in the short term, Bitcoin is likely to experience range-bound volatility between $85,000 and $95,000 over the coming days.
A clean break below $80,000 does not appear likely in the near term, unless a major fundamental or macro news event triggers renewed strong selling pressure.

ADA/USDT | Cardano Pulls Back After the Rally! What's Next?CRYPTOCAP:ADA pushed all the way to $0.485 before getting hit with a sharp correction and right now price is trading near $0.40 which is roughly a sixteen percent drop from the recent high. Nothing major has changed in the broader structure because the key zone has always been the $0.32 to $0.36 demand range. If ADA drops into that area again I expect a fresh wave of buyers to step in just like the previous reactions.
For now I want to see if momentum cools down a bit more and whether ADA will revisit the deeper demand levels. That is still the zone where the next strong bullish leg can start building again.
Please support me with your likes and comments to motivate me to share more analysis with you and share your opinion about the possible trend of this chart with me !
Best Regards , Arman Shaban

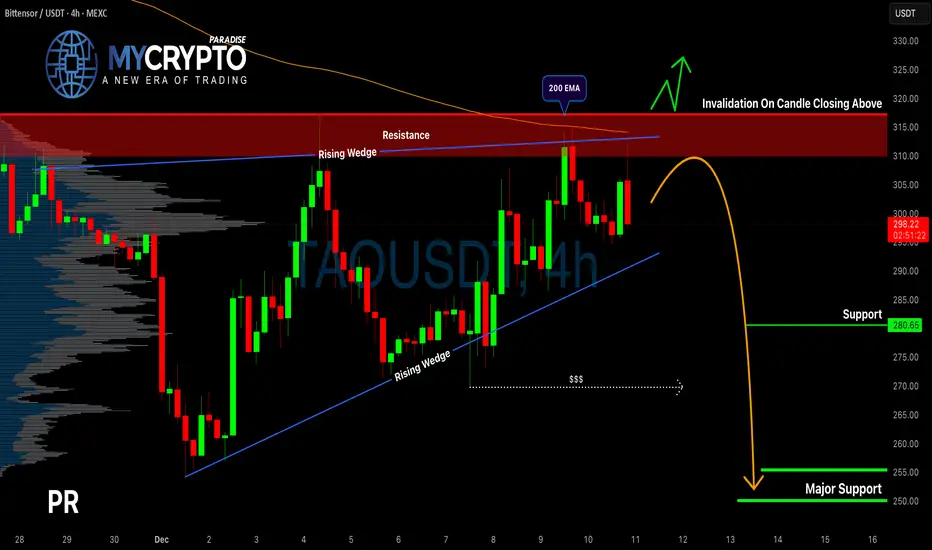
TAO Showing Weakness at Resistance — Is a Breakdown Imminent?Yello Paradisers! Are we about to witness a sharp rejection from resistance… or is this just the calm before the breakout storm?
💎TAOUSDT is currently reacting from a strong resistance zone and what makes things even more interesting is the rising wedge pattern that has formed in this area. This type of structure historically points to a higher probability of a bearish move, and right now, the conditions are lining up for potential downside.
💎But to secure a better risk-to-reward (RR) setup, a small pullback from the current level would be ideal. After that, we’ll look for a clear bearish candlestick formation to confirm entry. The main targets lie below, around the liquidity pools and key support zones, which also align with strong long-term levels.
💎Still, there’s one critical invalidation point:
If the price breaks and closes above the resistance zone, it would invalidate the entire bearish setup. In that case, the smart move is to wait patiently for a cleaner structure and more reliable signals before acting.
🎖This is what trading like a professional looks like, clear setups, no emotional bias, and total commitment to risk management. It's not about predicting every move perfectly, it's about positioning only when the odds are in your favor.
MyCryptoParadise
iFeel the success🌴
SOL/USDT | Solana Is Testing Buyers Right Now, Pump or Dump?CRYPTOCAP:SOL rallied all the way to $146 before pulling back again and right now price is trading near $132. The correction is completely normal and the main demand zone sits between $122 to $132 which is exactly where Solana is reacting at the moment. This is the zone that needs to hold because losing it would open the door for a deeper drop.
If buyers fail to defend the current range there is still a clean lower demand area around $105 where I expect stronger accumulation and a possible start of the next bullish leg. For now I am watching to see if SOL stabilizes inside the $122 to $132 zone because a proper hold there usually leads to another upward push.
Please support me with your likes and comments to motivate me to share more analysis with you and share your opinion about the possible trend of this chart with me !
Best Regards , Arman Shaban

SOL/USDTIn my opinion, a BUY position is the best option for Solana at the moment.
Price has hunted liquidity and reacted to a key bullish order block.
As long as price holds above this zone, bullish continuation is expected.
🎯 Targets: marked on the chart
🛑 Stop loss: below the order block zone
Not Financial Advice

LTC/USDT | LTC Drops Hard but the Real Opportunity Might Be AheaCRYPTOCAP:LTC rallied all the way to $113 before getting slammed with a heavy correction, dropping more than 34% down to $75. Right now Litecoin is trading near $81 and the momentum is still clearly bearish. As long as this pressure continues, I expect a deeper correction toward the $63 to $70 demand zone.
This is the area that really matters for the next major move. If Litecoin reaches this zone and shows a clean bullish reaction, it becomes a high-interest region for a strong mid-term reversal. A proper reaction here can easily trigger a 100%+ upside move in the coming weeks or months.
For now I’m watching to see how price behaves as it approaches $63 to $70 because that’s where the next big opportunity is likely to form.
Please support me with your likes and comments to motivate me to share more analysis with you and share your opinion about the possible trend of this chart with me !
Best Regards , Arman Shaban

BTCUSD TodayBTCUSD still bearish
I waiting with setup like yesterday
Change on my tools on H1 to bearish I will open sell

Bitcoin Analysis | Market Still Favors the Sellers
Alright, let’s dive into today’s Bitcoin analysis and see where the market stands.
First of all, the Fear & Greed Index is at 22, which means we’re still firmly in the fear zone.
As I mentioned in my previous analysis, Bitcoin was trading inside a tight range, and we were prepared for both long and short scenarios.
The short trigger was activated, and price moved all the way to 1.5R. I clearly advised you to secure profits, and if you haven’t done that yet, I strongly recommend taking partial or full profit now.
📉 What’s Next?
We’ve now reached a daily demand area, so it’s completely natural to see some reaction from buyers at this level.
Next short trigger: 85,753
If we get a 1-hour candle close below this level, I’ll open a new short position.
Long positions:
For now, no long setups. Sellers are clearly in control at the moment.
📊 Bitcoin Dominance Insight
During Bitcoin’s pullback, BTC dominance moved upward, which means Bitcoin corrected less than most altcoins.
Because of that, short triggers on altcoins are closer, and in many cases, altcoins should be shorted before Bitcoin confirms.
If for any reason you missed the short entry around 89,995 (which I mentioned earlier), then 85,753 is my next key level — and yes, I’ll be entering there myself.
That said:
I’ll prioritize altcoins with bearish BTC pairs
I will not over-risk under any circumstances
⚠️ Risk Management Reminder
Risk management is the most important pillar of trading.
If you ignore it, liquidation over a series of trades becomes inevitable.
This level is one of those areas where risk-taking is logical,
but over-risking is not.
Don’t let fear stop you from executing your plan —
just make sure your position size is small and controlled.
Thanks for reading my analysis.
Trade safe, manage your risk, and have a great day 💪📉

LTC: Breakout Before Altcoin SeasonPrice has been moving inside a large 3‑month symmetrical triangle, with lower highs from the 2017 peak and higher lows since the 2018 bottom.
The current candle is compressing between the support and resistance trendlines, suggesting a larger move is getting closer.
A confirmed breakout above the triangle resistance and the 0.5–0.618 Fib would open the way toward the marked profit zone in the 0.65–0.786 area (~185–255 USD), where previous supply sits.
As long as the higher‑low structure holds, the bias remains bullish; a clean weekly/3M close back below the triangle support would invalidate this idea and shift the focus back toward the 40–50 USD zone.
Litecoin often behaves as a “mid‑cap beta play” between Bitcoin and smaller alts: when BTC stabilizes and capital starts rotating out along the risk curve, LTC is one of the first large caps to wake up. A strong, high‑timeframe breakout on Litecoin can therefore be an early sign that market participants are ready to take more risk, paving the way for a broader altcoin season.
