EURUSD: Bullish Structure Holds - Market Eyes 1.1810 ResistanceHello everyone, here is my breakdown of the current EURUSD setup.
Market Analysis
EURUSD is trading within a well-defined bullish structure after breaking out of a descending triangle formation, signaling a clear shift in control from sellers to buyers. The initial breakout was followed by a brief consolidation phase, where price formed a tight range, suggesting accumulation rather than distribution. After this pause, the pair continued higher and successfully broke above the triangle resistance line, confirming bullish continuation.
Currently, EURUSD is trading above a rising trend line, which continues to act as dynamic support. The market recently tested the Resistance Zone around 1.1810, where selling pressure appeared, leading to a short-term pullback. This retracement is now developing toward the Support Zone near 1.1760, which aligns with the previous breakout area and the ascending structure. As long as price holds above this support, the broader bullish trend remains intact and the pullback appears corrective.
My Scenario & Strategy
My primary scenario remains bullish while EURUSD holds above the 1.1760 Support Zone. I expect buyers to defend this area and push price higher for another attempt toward the 1.1810 Resistance Zone.
Therefore, a clean breakout and acceptance above resistance would confirm bullish continuation and open the way for further upside expansion. However, a decisive breakdown below support would weaken the structure and signal a deeper correction. For now, price action continues to favor buyers as long as the ascending structure holds.
That's the setup I'm tracking. Thank you for your attention, and always manage your risk.
Forex market

EURUSD Failed Break Above 1.1800 Opens Path to 1.1740Hello traders! Here’s my technical outlook on EURUSD (4H) based on the current chart structure. EURUSD is trading within a broader bullish structure after breaking above a descending resistance formation earlier on the chart, signaling a clear shift in market control from sellers to buyers. Following this breakout, price entered a consolidation phase, forming a well-defined range, which reflected temporary balance before trend continuation. The subsequent upside breakout from this range, supported by a rising trend line, confirmed renewed bullish momentum and continuation of the upward structure. Currently, price is testing a key Resistance Level near 1.1800, where a fake breakout has already occurred, suggesting potential exhaustion of buyers at the highs. This resistance aligns with a descending resistance line, increasing the probability of seller reaction. Below current price, the former resistance has flipped into a Support Level around 1.1740, overlapping with the Buyer Zone and the previous breakout area, making it a critical demand region. My scenario: as long as price is rejected from the 1.1800 resistance, a corrective move toward 1.1740 is likely (TP1). A clean breakdown below support would open the door for a deeper pullback. A confirmed breakout above 1.1800 would invalidate the short bias and signal further upside. Please share this idea with your friends and click Boost 🚀

EURAUD Price Update – Clean & Clear ExplanationEUR/AUD moving inside a descending (falling) channel, which means the overall trend has been bearish in recent sessions. Price was making lower highs and lower lows, respecting the channel boundaries.
Price has now reached the lower boundary of the falling channel, which is an important support zone around 1.7520–1.7550, there is strong demand/support, where buyers have started to step in a bullish reaction can be seen from this area, suggesting selling pressure is weakening.
If price holds above the support zone, a pullback upward is likely first upside target is around 1.7650–1.7700, which is a previous resistance / supply zone a successful break and hold above this area could push price higher toward 1.7770–1.7800, as shown by the projected move. if price fails to hold the support and breaks below 1.7500, the bearish trend may continue toward 1.7470 or lower.
If you find it please like and comments for this post and share thanks.

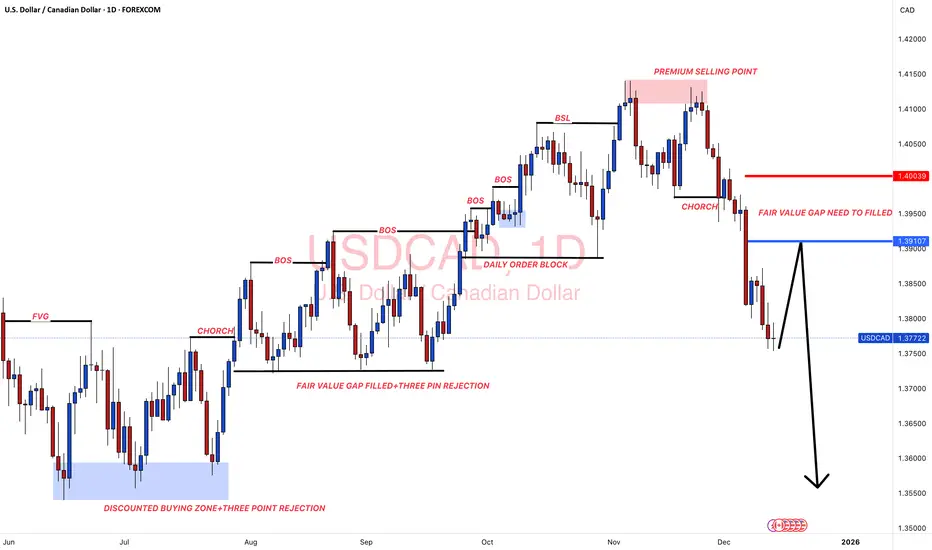
#USDCAD: A Perfect Selling Zone For The Week 15/12/2025Dear Traders,
Overview On USDCAD📈
🔺Price has left a great area of selling zone which need to be filled; we already have given an entry point and an exit point for you to identify the selling zone easily. USD is likely to show some minor bullish behaviour which will push the price of USDCAD to our point of interest.
🔺There is only one swing selling target that we currently have, this is not a long term trade instead or intraday trade.
Entry and Stop Loss Planning📊
🔺You must use your own knowledge to establish trading plan successfully, entry at the area as described in the chart only if it matches your bias.
🔺Use 'Red Line' as a exit point or as a stop loss also trade with accurate lot size based on your account.
🔺Take Profit Set at the 'Black Arrow' Ends.
Support and Encouragement ❤️🏆
If you like our idea then please like and comment which will encourage us to post such more ideas. Also share your views in the comment sections.
Tean Setupsfx_
USDJPY is Nearing a Strong Resistance!Hey Traders,
In today’s trading session, we are monitoring USDJPY for a potential selling opportunity around the 156.200 zone.
Technically, the pair remains in a broader downtrend and is currently in a corrective move, retracing back toward the 156.20 area, which aligns with trend resistance and a key support/resistance flip. This zone has previously acted as a reaction level and now serves as a potential area for sellers to re-engage.
As long as price remains capped below this region, the prevailing bearish structure stays intact, with rallies viewed as corrective rather than impulsive.
Watching closely for price reaction and bearish confirmation around 156.200 before any continuation lower.
Trade safe,
Joe

GBP/USD – A Pullback Before the Uptrend ContinuesHello everyone, my name is Camila.
Observing the GBP/USD chart on the H3 timeframe, I assess that the market is moving in line with the characteristics of a healthy uptrend. Price is trading steadily within an ascending channel, with a clear higher high – higher low structure maintained consistently since the beginning of December. This indicates that the dominant capital flow is still supporting the British pound, and the current pullbacks are more technical corrections rather than signals of a trend reversal.
From a structural perspective, after approaching the resistance area around 1.3520, price has started to face short-term profit-taking pressure and moved into a corrective phase. This is a completely natural reaction when the market reaches the upper boundary of an ascending channel. I do not see clear signs of distribution at this stage; instead, selling pressure appears to be weakening, suggesting that sellers are not strong enough to break the existing trend structure.
The key area to focus on lies at the 1.3420 – 1.3450 support zone. This is a significant confluence area between the ascending channel’s trendline support and a prior demand zone, where price previously consolidated and broke out strongly. If GBP/USD continues to pull back into this area with slowing downside momentum, accompanied by long lower wicks or confirming price action signals, I expect buying interest to return and defend the medium-term bullish structure.
From a fundamental perspective, the current macro backdrop remains slightly supportive of GBP. Recent U.S. economic data have failed to provide fresh upside momentum for the USD, while the market continues to adjust expectations toward a more cautious Federal Reserve rate policy outlook. Major outlets such as Reuters and Bloomberg have also noted that the U.S. dollar is lacking strong bullish catalysts as year-end risk sentiment improves. In contrast, the Bank of England has maintained a relatively firm stance on inflation, helping the pound retain a more stable underlying foundation.
My preferred short-term scenario is for GBP/USD to decline and retest the 1.3420 – 1.3450 zone to rebalance supply and demand. From there, if buying pressure emerges as expected, price could rebound toward the 1.3520 area, with further upside potential toward 1.3580 – 1.3600, aligning with the upper boundary of the ascending channel.
In summary, I maintain a bullish bias on GBP/USD. The current market conditions are not ideal for chasing sell positions at resistance, but rather favor a buy-on-dips strategy at support, trading in alignment with the prevailing structure and the dominant capital flow guiding the market.
Wishing you successful trading!

AUDUSD – Bullish Buy Setup | 4H Timeframe📈 AUDUSD – Bullish Buy Setup | 4H Timeframe
AUDUSD is in a strong bullish trend on the 4H chart, supported by a bullish EMA crossover.
🔁 Technical Confirmation:
• EMA 20 has crossed above EMA 50, signaling bullish momentum
🟢 Buy Entry Zone:
• Buying opportunity around 0.66600, aligning with trend support
🎯 Technical Target:
• Target 1: 0.67300
📊 Market Bias: Bullish
⏱ Timeframe: 4H
⚠️ Use proper risk management and trade responsibly. Confirmation is always recommended before entry.
👍 Like • Follow • Comment • Share
📢 Stay connected with our community for consistent, professional market insights!

EURUSD Bearish Continuation After Trend BreakQuick Summary
EURUSD remains bearish after the strong sell-off since the start of the week, the Price is expected to continue lower toward 1.17028 after this level Buy positions will only be considered as a mitigation move if a clear retracement target appears
As long as no corrective objective is visible the bearish view remains valid especially after the H4 bullish trendline break
Full Analysis
After the strong downside move that started at the beginning of the week EURUSD continues to show clear bearish strength
The break of the bullish trendline on the H4 timeframe confirms that the previous upside structure has weakened and that sellers currently showed their strength
Based on the current structure price is expected to continue its decline toward the low at 1.17028
This level will be important to monitor as it may act as a reaction zone
From my perspective any buying opportunity would only be considered as a corrective move and not a trend reversal
This means that long positions will only make sense if a clear retracement target or liquidity objective becomes visible.
If price reaches 1.17028 without showing a clear corrective setup or reaction then the bearish bias will remain unchanged
Until proven otherwise the expectation stays aligned with continued downside pressure following the H4 structure break


EURUSD Staging a massive correction.The EURUSD pair has been rejected on the 2025 Resistance Zone, while at the same time its 1D RSI got rejected on its Lower Highs trend-line.
This is technically a preparation for a massive long-term bearish reversal but even on the shorter term, such rejections have declined by at least -3.46%. This targets directly Support 2 at 1.14000.
---
** Please LIKE 👍, FOLLOW ✅, SHARE 🙌 and COMMENT ✍ if you enjoy this idea! Also share your ideas and charts in the comments section below! This is best way to keep it relevant, support us, keep the content here free and allow the idea to reach as many people as possible. **
---
💸💸💸💸💸💸
👇 👇 👇 👇 👇 👇

Lingrid | USDCHF Potential Continuation of Current TrendFX:USDCHF remains capped below a well-defined descending trendline, with price printing lower highs and failing to regain the former range support near 0.7900. The recent push higher looks corrective in nature, as momentum continues to fade each time price tests the trendline from below.
If price stalls again inside this supply zone, bearish pressure may resume toward the 0.7862 support area, where prior demand and the lower boundary align. Until buyers reclaim the trendline with strength, downside continuation remains the preferred path.
➡️ Primary scenario: rejection near 0.7900 → move toward 0.7862
⚠️ Risk scenario: firm acceptance above the trendline invalidates the sell setup and shifts bias neutral
If this idea resonates with you or you have your own opinion, traders, hit the comments. I’m excited to read your thoughts!

EURUSD Bearish Bias With CautionQuick Summary
The bearish view on EURUSD remains valid and A clear orderflow has formed on the M15 timeframe which supports further downside, However this orderflow may also act as trendline liquidity and attract price higher
Selling should only be considered with a clear reversal signal like a rejection candle with long wick
Full Analysis
The bearish outlook on EURUSD continues to develop as price has formed a clear orderflow on the 15 minute timeframe
This structure is typically a strong indication of bearish pressure and suggests that sellers are still in control
Despite this bearish signal it is important to remain cautious
This type of orderflow can sometimes represent trendline liquidity which may attract price upward before the actual downside move resumes
For this reason entering sell positions without confirmation carries risk
A clear reversal signal is required to validate bearish continuation and confirm that the move is not simply a liquidity grab to the upside

EURUSD: 1.1800 proved to be a strong resistance zone so farEURUSD: 1.1800 proved to be a strong resistance zone so far
It seems that EURUSD found a very strong resistance zone near 1.1800, as I explained in our previous analysis.
The price was rejected several times over the past two weeks, and near this area the chances of a move down increase.
Perhaps the USD could become stronger during January, given that the overall USD picture points to a strong USD.
The targets remain the same as before: 1.1675; 1.1595 and 1.1540
You may find more details in the chart!
Thank you and Good Luck!
PS: Please support with a like or comment if you find this analysis useful for your trading day

EURUSD: Extended rally into daily supplyOver the past few weeks, EURUSD has continued to extend higher, pushing deep into a daily supply zone that overlaps with a previous distribution area. The ascending channel is still intact, but I’m starting to see some loss of momentum and the first signs of selling pressure within the 1.1780–1.1850 range.
On the daily chart, price has left a potential imbalance open, with a more interesting demand structure sitting between 1.1700 and 1.1650. If recent lows are taken out, I would expect price to rotate back into that zone to fill liquidity and test buyer strength. Only a clean break and hold above 1.1850 would invalidate the corrective scenario and reopen the path toward higher highs.
The COT data shows:
Non-commercials remain net long on the euro, but positioning is not increasing as aggressively as in previous months.
On the Dollar Index, non-commercials still hold a meaningful short exposure, but they’ve been gradually reducing it.
In my view, this suggests a market that may have already priced in much of the pro-euro bias, creating room for a short-term technical reset.
Seasonality
Historically, December tends to be positive for EURUSD, but the final part of the month often brings volatility and rebalancing flows — consistent with the idea of a pullback before any renewed extension.
Retail sentiment
Current sentiment shows roughly 81% of retail traders short.
Typically, that’s a contrarian bullish signal. However, given that we’re trading inside supply and the structure is stretched, I interpret it as the uptrend is still alive, but the risk of a corrective phase is increasing.
Invalidation
This corrective view is invalidated with daily closes above 1.1850 and strong continuation inside the channel.

GBPUSD is showing a clear bullish trend on the 1H chart📈 GBPUSD – Bullish Trend Setup | 1H Timeframe
GBPUSD is showing a clear bullish trend on the 1H chart, supported by strong price structure and demand.
🟢 Key Buy Zone:
• Strong support holding around 1.34500, presenting a potential buying opportunity
🎯 Technical Target:
• Target 1: 1.35300
📊 Market Bias: Bullish
⏱ Timeframe: 1H
⚠️ Bullish continuation remains valid as long as price holds above the key support zone. Always manage risk and trade with confirmation.
👍 Like & follow our community for more professional market insights and trade setups!

EURUSD Consolidation amid bullish trend EUR/USD has recently broken out from a support-based consolidation, signalling a shift toward a bullish trading range. Following the breakout, price action has entered a well-defined consolidation zone, with buyers continuing to defend the range effectively. At present, the pair is testing the upper boundary of this structure.
Technically the US dollar advanced on Tuesday ahead of the release of the minutes from the Federal Reserve’s December meeting, as investors attempt to assess the future path of US monetary policy. This has provided short-term support to the dollar but has not yet invalidated the broader bullish structure in EUR/USD.
As long as price fails to achieve a clean rejection or decisive breakout to the downside, the bullish bias remains intact. A sustained hold above the consolidation support keeps the door open for further upside continuation. A confirmed bullish breakout would expose resistance in the 1.17800–1.18002 zone.
You may find more details in the chart,
Trade wisely best of luck buddies.
Ps; Support with like and comments for better analysis thanks for supporting.


Holding Firm at Higher Levels, H4 Structure Remains IntactHello everyone,
On the H4 chart, EURUSD has delivered a clear expansion from the 1.155 area up toward 1.180. After this advance, price did not reverse sharply lower but instead shifted into a sideways consolidation, holding above the key EMA levels. This behavior suggests that current selling pressure is not strong enough to disrupt the short-term bullish structure.
During this consolidation phase, there are no signs of a structural breakdown or meaningful distribution. Pullbacks have been orderly, with narrow ranges and quick absorption, indicating that buyers are still holding positions rather than actively exiting the market.
Overall, the current price action looks more like post-rally consolidation than a weak rebound within a downtrend. As long as price remains above the EMAs, the H4 uptrend is preserved, while the market likely needs more time to rebalance supply and demand before defining its next directional move.
Wishing you all effective and successful trading!

EURUSD Is Not Breaking Out Yet — It’s Still Balancing Hello everyone,
On the H1 timeframe, the key focus right now is not an immediate bullish breakout, but the fact that EURUSD remains locked inside a clearly defined range, rotating between strong resistance and a well-respected support base.
After multiple attempts into the upper resistance zone around 1.1800–1.1820, price has repeatedly failed to gain acceptance above this area. Each push higher has been met with selling pressure, resulting in sharp rejections and a return back into the range. This behavior confirms that supply remains active overhead and that buyers are not yet strong enough to force a directional expansion.
From a structural perspective, the market is printing overlapping highs and lows, which is a classic sign of balance rather than trend. There is no clean sequence of higher highs to validate an uptrend, and at the same time, sellers have been unable to drive price decisively below support. This tells us that both sides are active, but neither is in control.
The support zone around 1.1750–1.1760 continues to act as a demand area. Every test into this zone has been absorbed, leading to short-term rebounds rather than continuation lower. As long as this support holds, downside risk remains contained, and the market stays in a consolidation phase.
The projected path on the chart reflects this logic well: a possible dip into support to test demand, followed by another rotation higher toward resistance. Only a clean breakout and acceptance above the resistance zone would confirm bullish continuation and open the door for a move toward higher levels. Conversely, a decisive breakdown below support would invalidate the range structure and shift the bias bearish.
Until one of those scenarios plays out, EURUSD is not trending. It is rebalancing and building liquidity inside the range, and patience remains essential.
Wishing you all effective and disciplined trading.

GBPUSD 1H Intraday Outlook: Sweep Into SupportGBPUSD 1H Intraday Outlook: Sweep Into Support, Reclaim Setup Toward 1.3500+
GBPUSD on the 1H chart printed a sharp selloff from the upper range, then dipped into a well-defined demand pocket before bouncing back. This is the classic “liquidity sweep + reclaim attempt” structure: price sold hard, tagged support, and is now trying to rebuild higher lows for a push back into the prior distribution near 1.3500.
Today’s edge is not guessing direction in the middle. The edge is trading the reclaim: either buyers defend the base and reclaim 1.3500, or the bounce fails and price rotates back into the lower demand zone.
Key Support and Resistance Levels (From the Chart)
Support Zones
1.3430–1.3420: intraday base after the drop (current decision area).
1.3390–1.3378: major demand zone (lower green box). If price returns here, it becomes the highest-probability buy location.
1.3360: breakdown continuation level if the 1.3378 demand fails with acceptance.
Resistance Zones
1.3480–1.3490: first resistance cluster (often a pause zone during rebounds).
1.3500–1.3510: key supply / prior range base (upper green box). This is the main reclaim trigger.
1.3525–1.3540: next upside objective if 1.3500 breaks and holds.
Fibonacci Confluence (Using the Drop High to Drop Low)
From the visible impulsive leg down (swing high around 1.353x to swing low around 1.343x), the rebound levels to track:
0.382: 1.3470 area (first “real” resistance in a corrective bounce)
0.50: 1.3480–1.3485 (midpoint magnet)
0.618: 1.3495–1.3500 (most important reclaim zone, aligns with the boxed resistance)
0.786: 1.3510–1.3515 (last gate before a run to 1.3525–1.3540)
This explains why the 1.3500 handle matters: it is a Fib 0.618 zone plus a structural supply line.
Trendline and Structure Read (1H)
The selloff created a steep short-term bearish leg, but the rebound suggests sellers may be exhausting into demand.
For a true bullish shift, GBPUSD needs to reclaim 1.3500 and build acceptance above it (multiple closes, not just one wick).
If price fails under 1.3500 and starts making lower highs again, treat the bounce as corrective and expect a rotation back toward 1.3390–1.3378.
EMA and RSI Checklist (Practical Confirmation)
EMA (20/50/200 approach)
Bullish continuation improves if price reclaims EMA20 first, then flips EMA50 into support on a retest.
If EMA20/EMA50 keep capping rallies around 1.3480–1.3500, the rebound is still corrective.
RSI (1H)
A sustainable rebound usually shows RSI reclaiming and holding above 50 during pullbacks.
If RSI stays below 50 while price tests 1.3500, rejection odds increase.
Intraday Trade Plans (Clear Triggers, Clean Invalidations)
Plan A: Buy the Base, Target the Reclaim
Best when price holds above the current base and builds higher lows.
Entry idea: 1.3430–1.3420 on bullish rejection or a higher-low confirmation
Invalidation: 1H acceptance below 1.3390
Targets:
TP1: 1.3470
TP2: 1.3485
TP3: 1.3495–1.3500
TP4: 1.3525–1.3540 if 1.3500 flips to support
Plan B: Breakout Buy Above 1.3500 (Confirmation Setup)
This is the cleaner momentum trade if you want less chop.
Trigger: 1H close above 1.3500, then retest holds (support flip)
Invalidation: back below 1.3485 after the breakout
Targets:
TP1: 1.3525
TP2: 1.3540
Plan C: Sell Rejection at 1.3500 (If Reclaim Fails)
High probability if price taps 1.3500 and prints weak closes with RSI heavy.
Trigger: rejection wicks + failure to close above 1.3500, preferably RSI failing under 50
Invalidation: 1H acceptance above 1.3515
Targets:
TP1: 1.3470
TP2: 1.3430
TP3: 1.3390–1.3378 demand zone
Plan D: Buy the Deeper Demand (1.3390–1.3378)
If the market dips again, this is the premium “location trade.”
Entry idea: 1.3390–1.3378 with bullish rejection
Invalidation: 1H close below 1.3360
Targets:
TP1: 1.3430
TP2: 1.3470
TP3: 1.3500
What to Watch During the Session
Holding above 1.3430 keeps the rebound thesis alive.
The session’s main decision point is 1.3500: reclaim and hold favors continuation to 1.3525–1.3540.
Repeated failure at 1.3500 shifts the advantage back to sellers and increases the odds of a rotation into 1.3390–1.3378.
Risk Note
This analysis is for educational purposes, not financial advice. Intraday volatility can spike around reclaim zones and supply/demand edges. Keep risk fixed per trade and avoid overtrading inside the middle of the range.
If you want more session-based GBPUSD plans built around Fibonacci, trendline structure, EMA, and RSI confirmation, follow and save this idea for the next updates.

Buy Trend Clean Retest From Demand Zone EURUSD | 30M 📈
Price is holding at strong demand zone 1.1750–1.1770, showing bullish continuation potential.
Buy around 1.1755–1.1745 → Targets: 1.1785 / 1.1807
Bias remains bullish above demand, manage risk properly.

EURUSD Long: Demand at 1.1720 Sets Up a Push Toward 1.1770Hello traders! Here’s a clear technical breakdown of EURUSD (2H) based on the current chart structure. After forming a solid pivot low, EURUSD transitioned into a bullish trend, supported by a rising trend line that guided price action higher. Following this move, the market entered a consolidation range, signaling temporary balance before the next expansion phase. Price later broke out of the range to the upside, confirming renewed buyer strength. However, upon reaching the upper Supply Zone near 1.1770–1.1780, EURUSD experienced a fake breakout, followed by rejection and increased selling pressure. This rejection highlighted active sellers defending supply. Despite this, buyers managed to push price higher again, leading to another breakout attempt above supply, though momentum remained limited.
Currently, EURUSD is pulling back from the supply area and is trading near the Demand Zone around 1.1720, which aligns with the rising demand line and prior breakout structure. This zone represents a key decision area, where buyers may attempt to defend the bullish structure.
My scenario: as long as EURUSD holds above the 1.1720 Demand Zone, the broader bullish structure remains intact, and the pullback can be considered corrective. A strong reaction from demand could lead to another test of the 1.1770 Supply Zone. However, a decisive breakdown below demand would signal a loss of bullish control and open the door for a deeper corrective move. For now, price is at a critical level, with demand acting as the key area to watch. Manage your risk!

EURUSD 1H Intraday AnalysisEURUSD 1H Intraday Analysis: Holding 1.173 Demand, Upside Path Toward 1.180
EURUSD is sitting on a clean 1H demand/reclaim area around 1.173, after a steady pullback from the 1.180 swing high. The chart shows a classic “support test + bounce attempt” structure: if buyers can keep price accepted above 1.173, the next rotation targets the mid-range first, then a retest of 1.180.
Today’s game plan is straightforward: trade the 1.173 decision zone, and let price confirm whether this is a continuation bounce or a breakdown setup.
Key Support and Resistance Levels (Most Important Today)
Support
1.1730–1.1740 (Main demand / decision zone): the green box on your chart, must hold for bullish continuation.
1.1700 (Major floor): prior swing low; break and hold below shifts bias bearish.
1.1685–1.1665 (Deeper support): only in play if 1.170 fails cleanly.
Resistance
1.1760–1.1770 (First supply / pullback cap): first area to react during the bounce.
1.1780 (Structure level): break above improves odds of a run to highs.
1.1800 (Key resistance): top line on the chart, major target and likely sell-response area.
Fibonacci Confluence (Swing High 1.180 to Swing Low 1.170)
Using the visible swing from 1.180 → 1.170, the most useful intraday Fib cluster aligns well with the current structure:
0.382: ~1.1738 (right inside the 1.173 demand area)
0.50: ~1.1750 (first magnet if bounce holds)
0.618: ~1.1762 (key mid resistance)
0.786: ~1.1779 (often the “last gate” before highs)
This makes 1.173 the pivot: if it holds, Fib levels above become natural step targets.
Trendline Read (Market Structure)
The move down from the 1.180 peak forms a short-term descending pressure line (lower highs).
Bulls need a break and hold above 1.176–1.178 to confirm the trendline break and shift the intraday structure back to bullish.
If price keeps rejecting under 1.176–1.178, expect choppy rotations back into 1.173.
EMA + RSI Checklist (Confirmation Tools)
EMA (20/50/200 approach)
If price is below EMA50 on 1H, rallies often stall at resistance first (1.176–1.178).
Bullish continuation quality increases if:
price reclaims EMA20, then
holds above EMA50 on retests (support flip behavior).
If price rejects repeatedly at EMA20/EMA50, treat bounces as corrective.
RSI (1H)
Bullish confirmation: RSI reclaims and holds above 50 during pullbacks.
Bearish continuation: RSI stays heavy under 50, especially if 1.173 breaks.
High-Probability Trade Plans (Intraday)
Plan A: Buy the 1.173 Demand Retest (Best Risk-to-Reward)
Entry idea: 1.1730–1.1740 after bullish rejection (wicks + stronger closes)
Invalidation: below 1.1700
Targets:
TP1: 1.1750
TP2: 1.1762–1.1770
TP3: 1.1780
TP4: 1.1800
Plan B: Breakout Buy Toward 1.180 (Confirmation Setup)
Trigger: 1H close above 1.1780, then a retest that holds
Invalidation: back below 1.1760 after the breakout
Targets:
TP1: 1.1800
Extension: only if momentum is strong and 1.180 breaks cleanly
Plan C: Sell Rejection Into 1.176–1.178 (If Bounce Looks Weak)
Trigger: rejection wicks + failure to close above 1.1762/1.1780, RSI unable to hold 50
Invalidation: close above 1.1780 with acceptance
Targets:
TP1: 1.1740
TP2: 1.1730
TP3: 1.1700
Plan D: Breakdown Sell Below 1.170 (Continuation Bearish)
Trigger: clean break and 1H acceptance below 1.1700
Invalidation: reclaim back above 1.1700
Targets:
TP1: 1.1685
TP2: 1.1665
What to Watch During the Session
If 1.173 holds and price prints higher lows: expect step-by-step upside through 1.175 → 1.1762 → 1.178 → 1.180.
If 1.173 fails and price accepts below 1.170: the bullish idea is invalidated and the path opens lower.
The cleanest momentum signal today is a reclaim and hold above 1.178.
Risk Note
This is a technical analysis perspective for education, not financial advice. Intraday conditions can turn volatile quickly, so keep risk fixed per trade and avoid forcing entries in the middle of the range.
If this EURUSD level map helps, follow and save the idea so you can reference the zones and session plans later.
