EURUSD: Extended rally into daily supplyOver the past few weeks, EURUSD has continued to extend higher, pushing deep into a daily supply zone that overlaps with a previous distribution area. The ascending channel is still intact, but I’m starting to see some loss of momentum and the first signs of selling pressure within the 1.1780–1.1850 range.
On the daily chart, price has left a potential imbalance open, with a more interesting demand structure sitting between 1.1700 and 1.1650. If recent lows are taken out, I would expect price to rotate back into that zone to fill liquidity and test buyer strength. Only a clean break and hold above 1.1850 would invalidate the corrective scenario and reopen the path toward higher highs.
The COT data shows:
Non-commercials remain net long on the euro, but positioning is not increasing as aggressively as in previous months.
On the Dollar Index, non-commercials still hold a meaningful short exposure, but they’ve been gradually reducing it.
In my view, this suggests a market that may have already priced in much of the pro-euro bias, creating room for a short-term technical reset.
Seasonality
Historically, December tends to be positive for EURUSD, but the final part of the month often brings volatility and rebalancing flows — consistent with the idea of a pullback before any renewed extension.
Retail sentiment
Current sentiment shows roughly 81% of retail traders short.
Typically, that’s a contrarian bullish signal. However, given that we’re trading inside supply and the structure is stretched, I interpret it as the uptrend is still alive, but the risk of a corrective phase is increasing.
Invalidation
This corrective view is invalidated with daily closes above 1.1850 and strong continuation inside the channel.
Forex market

GBPUSD LONG IDEAGBPUSD have been maintaining a bullish structure and now we are on a point of re-accumulation. Looking for demand zone is the best idea

EURUSD - AnalysisHere is an analysis on EURUSD, expecting bullish prices. There is some nice confluence of PD Arrays on many different timeframes. Of course, it being the end of the year, there could be some major volatility OR major consolidation until the next year where we may see some Seek & Destroy profile happen.
Either way, be safe during this time. (And at all times =))
- R2F Trading

Bearish momentum to extend further?Loonie (USD/CAD) is rising towards the pivot, which is a pullback resistance, and could drop to the 1st support.
Pivot: 1.3773
1st Support: 1.3655
1st Resistance: 1.3773
Disclaimer:
The opinions given above constitute general market commentary and do not constitute the opinion or advice of IC Markets or any form of personal or investment advice.
Any opinions, news, research, analyses, prices, other information, or links to third-party sites contained on this website are provided on an "as-is" basis, are intended to be informative only, and are not advice, a recommendation, research, a record of our trading prices, an offer of, or solicitation for, a transaction in any financial instrument and thus should not be treated as such. The information provided does not involve any specific investment objectives, financial situation, or needs of any specific person who may receive it. Please be aware that past performance is not a reliable indicator of future performance and/or results. Past performance or forward-looking scenarios based upon the reasonable beliefs of the third-party provider are not a guarantee of future performance. Actual results may differ materially from those anticipated in forward-looking or past performance statements. IC Markets makes no representation or warranty and assumes no liability as to the accuracy or completeness of the information provided, nor any loss arising from any investment based on a recommendation, forecast, or any information supplied by any third party

USDJPY H4 Market Structure Analysis: Bullish BiasCurrent Price: 156.02
Trend Context: After a strong bullish impulse, price corrected downward, swept liquidity, and is now consolidating near a key demand zone.
Key Technical Points
Liquidity Sweep : Price dipped below previous lows (marked as “Liquidity Sweep”), clearing stop orders and signaling smart money accumulation.
QML Zone (Quasimodo Level) : Around 156.00, acting as a strong demand area where buyers are likely to step in.
ChoCH (Change of Character) : Occurred when price broke above the previous lower high, indicating a potential shift from bearish correction to bullish continuation.
Potential Higher Low Formation : Price respected the QML zone and formed a higher low, strengthening bullish sentiment.
Buy-side Liquidity Target : 157.786 – marked as the next probable destination for price.
Bias: Bullish
Reasoning:
Liquidity sweep cleared weak hands.
QML zone held as support.
ChoCH and higher low confirm bullish intent.
Projection: Expect a rally toward 157.78 if price breaks above minor resistance (~156.50).
Entry: Look for bullish confirmation near 156.00–156.20.
Stop-loss: Below 155.50 (under liquidity sweep low).
Take-profit: Around 157.78 (buy-side liquidity zone).

GBPUSD Recap & Setup: Previous Scenario Played Out PreciselyGBPUSD Analysis – Tuesday, December 30
Welcome traders! 👋
We analyze the market every single day to stay aligned with clean structure, liquidity, and high-probability setups.
Let’s dive into today’s GBPUSD analysis 👇
🔍 Market Overview
As mentioned in the previous analysis, price moved exactly as anticipated and delivered a clean, perfect target — great execution for those who followed the plan 🎯
GBPUSD remains in a strong bullish trend across the weekly, daily, and 4H timeframes.
Higher highs and higher lows are clearly intact, and buyers continue to control the overall market structure.
Despite the bullish bias, remember that we are in end-of-year conditions, where liquidity manipulation and sudden moves are more common. Patience and confirmation are key.
📌 Today’s Trading Scenarios (Tuesday – Dec 30)
✅ Scenario 1 – Liquidity Sweep → POI → Bullish Continuation (Preferred)
Price may:
• First create liquidity
• Sweep the Asia session low liquidity
• Tap into the POI
• And from there, continue the bullish expansion
💡 This scenario aligns perfectly with the dominant bullish structure and offers a high-probability continuation setup.
🔄 Scenario 2 – Buy-Side Sweep → OBS → POI → Continuation
Alternatively, price may:
• First take out buy-side liquidity above
• Tap into the OBS
• Then retrace toward the POI
• And from there, resume the bullish movement
This scenario allows for a deeper retracement before continuation.
⚠️ Risk & Execution Notes
• The market is never 100% predictable
• Always wait for confirmation before entry
• Apply strict risk management, especially in low-liquidity conditions
• Let structure + liquidity + confirmation guide your trades
I’d love to hear your thoughts 💬
Do you see the same continuation, or are you waiting for a deeper pullback?
📘 Educational Note:
This analysis is for educational and illustrative purposes only.
Always follow your own plan, confirm with your strategy, and manage risk carefully.
Success in trading comes from discipline, patience, and consistency. 💪
🚀 Empowering traders through clarity, confidence & clean charts.
Follow 👉 parisa_tl for more SMC setups and weekly insights 💙
#GBPUSD #ForexAnalysis #SmartMoneyConcepts #LiquiditySweep #BullishMarket #POI #OrderBlock #MarketStructure #PriceAction #FXTrading #ForexEducation #TradingView #DailyAnalysis #RiskManagement #parisa_tl

Bearish drop off 50% Fib resistance?USD/JPY has rejected off the pivot and could drop to the 1st support, which has been identified as an overlap support.
Pivot: 156.68
1st Support: 155.31
1st Resistance: 157.26
Disclaimer:
The opinions given above constitute general market commentary and do not constitute the opinion or advice of IC Markets or any form of personal or investment advice.
Any opinions, news, research, analyses, prices, other information, or links to third-party sites contained on this website are provided on an "as-is" basis, are intended to be informative only, and are not advice, a recommendation, research, a record of our trading prices, an offer of, or solicitation for, a transaction in any financial instrument and thus should not be treated as such. The information provided does not involve any specific investment objectives, financial situation, or needs of any specific person who may receive it. Please be aware that past performance is not a reliable indicator of future performance and/or results. Past performance or forward-looking scenarios based upon the reasonable beliefs of the third-party provider are not a guarantee of future performance. Actual results may differ materially from those anticipated in forward-looking or past performance statements. IC Markets makes no representation or warranty and assumes no liability as to the accuracy or completeness of the information provided, nor any loss arising from any investment based on a recommendation, forecast, or any information supplied by any third party

Bearish drop off?Swissie (USD/CHF) could rise to the pivot, which is a pullback resistance that aligns with the 50% Fibonacci retracement and could reverse to the pullback support.
Pivot: 0.7922
1st Support: 0.7861
1st Resistance: 0.7968
Disclaimer:
The opinions given above constitute general market commentary and do not constitute the opinion or advice of IC Markets or any form of personal or investment advice.
Any opinions, news, research, analyses, prices, other information, or links to third-party sites contained on this website are provided on an "as-is" basis, are intended to be informative only, and are not advice, a recommendation, research, a record of our trading prices, an offer of, or solicitation for, a transaction in any financial instrument and thus should not be treated as such. The information provided does not involve any specific investment objectives, financial situation, or needs of any specific person who may receive it. Please be aware that past performance is not a reliable indicator of future performance and/or results. Past performance or forward-looking scenarios based upon the reasonable beliefs of the third-party provider are not a guarantee of future performance. Actual results may differ materially from those anticipated in forward-looking or past performance statements. IC Markets makes no representation or warranty and assumes no liability as to the accuracy or completeness of the information provided, nor any loss arising from any investment based on a recommendation, forecast, or any information supplied by any third party

Could we see a reversal on the Kiwi?Kiwi (NZD/USD) is rising towards the pivot, which is a pullback resistance that aligns with the 61.8% FIbonacci retracement and could reverse to the 1st support.
Pivot: 0.5822
1st Support: 0.5798
1st Resistance: 0.5834
Disclaimer:
The opinions given above constitute general market commentary and do not constitute the opinion or advice of IC Markets or any form of personal or investment advice.
Any opinions, news, research, analyses, prices, other information, or links to third-party sites contained on this website are provided on an "as-is" basis, are intended to be informative only, and are not advice, a recommendation, research, a record of our trading prices, an offer of, or solicitation for, a transaction in any financial instrument and thus should not be treated as such. The information provided does not involve any specific investment objectives, financial situation, or needs of any specific person who may receive it. Please be aware that past performance is not a reliable indicator of future performance and/or results. Past performance or forward-looking scenarios based upon the reasonable beliefs of the third-party provider are not a guarantee of future performance. Actual results may differ materially from those anticipated in forward-looking or past performance statements. IC Markets makes no representation or warranty and assumes no liability as to the accuracy or completeness of the information provided, nor any loss arising from any investment based on a recommendation, forecast, or any information supplied by any third party

Falling towards pullback support?Cable (GBP/USD) is falling towards the pivot which acts as a pullback support that lines up with the 38.2% Fibonacci retracement and could bounce to the swing h igh resistance.
Pivot: 1.3439
1st Support: 1.3383
1st Resistance: 1.3534
Disclaimer:
The opinions given above constitute general market commentary and do not constitute the opinion or advice of IC Markets or any form of personal or investment advice.
Any opinions, news, research, analyses, prices, other information, or links to third-party sites contained on this website are provided on an "as-is" basis, are intended to be informative only, and are not advice, a recommendation, research, a record of our trading prices, an offer of, or solicitation for, a transaction in any financial instrument and thus should not be treated as such. The information provided does not involve any specific investment objectives, financial situation, or needs of any specific person who may receive it. Please be aware that past performance is not a reliable indicator of future performance and/or results. Past performance or forward-looking scenarios based upon the reasonable beliefs of the third-party provider are not a guarantee of future performance. Actual results may differ materially from those anticipated in forward-looking or past performance statements. IC Markets makes no representation or warranty and assumes no liability as to the accuracy or completeness of the information provided, nor any loss arising from any investment based on a recommendation, forecast, or any information supplied by any third party

USDJPY Market Structure
The pair previously made a bullish impulse, but recent price action shows loss of momentum.
Current structure is range-bound to mildly bearish on the intraday timeframe.
Price is trading below recent highs and reacting weakly around the 156.15–156.25 area.

My Thoughts #018What I see is more upside for the pair...
Here is the low down
Since on the higher time frame, the momentum is still bullish, the market just made a HL now making a new HH in line with the overall movement, and still waiting for a choch to take my trade so let's wait and see...
Use proper risk management let's do the most...

EURJPY and Elliott Wave PrinciplesIt is important to note that price is around the 2.618 Fibonacci level. The full context of this move was shared to my members. A confirmation at the current location would trigger a Wave 4(Red).

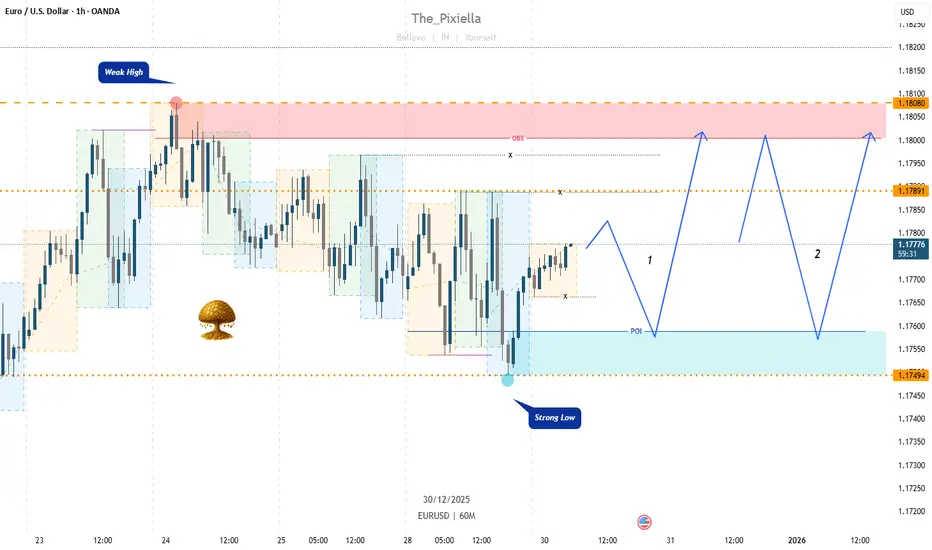
EURUSD Clean Structure, Clear Liquidity – High-Probability SetupEURUSD Analysis – Tuesday, December 30
Welcome traders! 👋
We analyze the market every single day to stay aligned with clean structure, liquidity, and high-probability setups.
Let’s dive into today’s EURUSD analysis 👇
🔍 Market Overview
EURUSD moved exactly as we expected and remains in a strong bullish trend across the weekly, daily, and 4H timeframes.
The higher-timeframe structure is intact, and buyers are still clearly in control.
Yesterday’s pullback was healthy and constructive, allowing price to rebalance before the next potential expansion. These retracements are essential in strong trends and often create the best opportunities when aligned with structure and liquidity.
⚠️ Important context:
We are approaching the end of the year, so volatility may be lower than usual. Expect slower price delivery, potential fake moves, and liquidity-driven behavior.
📌 Today’s Scenarios (Dec 30)
✅ Scenario 1 – Liquidity Sweep Below → POI → Bullish Continuation (Higher Probability)
Price may:
.Create additional liquidity,
.Sweep sell-side liquidity below,
.Tap into the POI,
.And from there, continue the dominant bullish movement.
💡 This scenario aligns perfectly with the higher-timeframe bullish bias and offers a classic continuation setup.
🔄 Scenario 2 – Liquidity Sweep Above → OBS → POI → Continuation
Alternatively, price may:
.Sweep buy-side liquidity above (previous daily high),
.React from the OBS,
.Retrace toward the POI,
.And then resume the bullish trend.
📉 This scenario suggests a deeper retracement before continuation and requires patience and confirmation.
⚠️ Risk & Execution Notes
.The market is never 100% predictable
.Year-end conditions can distort normal price behavior
.Always wait for confirmation before entry
.Apply strict risk management at all times
I’d love to hear your view 💬
Do you agree with the bullish continuation, or are you expecting more consolidation first?
📘 Educational Note:
This analysis is for educational and illustrative purposes only.
Always follow your own plan, confirm with your strategy, and manage risk carefully.
Success in trading comes from discipline, patience, and consistency. 💪
🚀 Empowering traders through clarity, confidence & clean charts.
Follow 👉 parisa_tl for more SMC setups and weekly insights 💙
#EURUSD #ForexAnalysis #SmartMoneyConcepts #LiquiditySweep #BullishTrend #POI #OrderBlock #MarketStructure #PriceAction #FXTrading #ForexEducation #TradingView #DailyAnalysis #RiskManagement
Short GBPAUD on a new 50-low signalGBPAUD has been in a daily downtrend for a long time now and the price on H4 failed to make a new higher high. So My thinking is we go lower. I sold on price crossing below the moving average
Daily chart to identify trend direction:

Big Moves Ahead ~ The Follow-UpThis is a follow up of a previous post shown below. As of now, whats left is confirmation at the 4.236 Fibonacci level. This is part of a broader multi-timeframe Elliott Wave framework shared with members.

Bullish continuation setup?Fiber (EUR/USD) has bounced off the pivot and could potentially rise to the 1st resistance.
Pivot: 1.1749
1st Support: 1.1725
1st Resistance: 1.1806
Disclaimer:
The opinions given above constitute general market commentary and do not constitute the opinion or advice of IC Markets or any form of personal or investment advice.
Any opinions, news, research, analyses, prices, other information, or links to third-party sites contained on this website are provided on an "as-is" basis, are intended to be informative only, and are not advice, a recommendation, research, a record of our trading prices, an offer of, or solicitation for, a transaction in any financial instrument and thus should not be treated as such. The information provided does not involve any specific investment objectives, financial situation, or needs of any specific person who may receive it. Please be aware that past performance is not a reliable indicator of future performance and/or results. Past performance or forward-looking scenarios based upon the reasonable beliefs of the third-party provider are not a guarantee of future performance. Actual results may differ materially from those anticipated in forward-looking or past performance statements. IC Markets makes no representation or warranty and assumes no liability as to the accuracy or completeness of the information provided, nor any loss arising from any investment based on a recommendation, forecast, or any information supplied by any third party

EURUSD | Structure vs Momentum at a Weekly ResistanceMarket Structure & Context Overview
Price is currently developing within a well-defined ascending channel , forming a sequence of higher highs and higher lows , which reflects sustained bullish structure.
At the same time, RSI momentum shows a wide divergence , suggesting a shift in momentum behavior while price structure remains intact.
Importantly, this entire structure is approaching a higher-timeframe (weekly) resistance zone , adding a broader contextual layer to the analysis.
This chart highlights how price structure, momentum behavior, and higher-timeframe context can be observed together — without relying on predictions or trade instructions.
Shared strictly for educational and analytical purposes.
No financial advice. No guarantees.
All decisions remain the sole responsibility of the reader and should align with their own ethical, legal, and religious principles.

EURUSD – H2 Analysis..EURUSD – H2 Analysis (based on My chart)
Market Structure
Clear ascending channel → bullish trend intact.
Price is holding trendline + Ichimoku cloud support.
Current move looks like a pullback before continuation.
Buyers are defending the 1.1735–1.1760 area.
📈 Buy Setup (Trend Continuation)
Buy Zone: 1.1735 – 1.1760
🎯 Target Points
Target 1: 1.1810
Target 2: 1.1840 (upper channel / My marked target)
❌ Invalidation
H2 close below 1.1710 → bullish setup weakens.
📌 Trade Summary
Pair: EURUSD
Timeframe: H2
Bias: BUY
Targets: 1.1810 → 1.1840
📍 If price reaches 1.1840, expect partial profit-taking or rejection.

USDJPY – H1 Analysis ...USDJPY – H1 Analysis (based on My chart)
Market Structure
Price is inside a symmetrical triangle (compression).
Currently testing the upper trendline with Ichimoku support.
Bias is bullish on breakout.
📈 Buy Scenario (Breakout Play)
Buy Entry:
On H1 close above 156.35 – 156.40
🎯 Target Points
Target 1: 156.90
Target 2: 157.60 (main liquidity / my marked target)
❌ Invalidation
H1 close below 155.90 → breakout fails, avoid buys.
📌 Trade Summary
Pair: USDJPY
Timeframe: H1
Bias: BUY on breakout
Targets: 156.90 → 157.60
If price rejects the upper trendline, expect range trading back toward 155.80 – 155.60 before next move.

Technical Analysis for GBP/USD (30-minute timeframe) I 12/30Trend and Price Structure
Main Trend: The price is in a recovery phase with a bullish bias after forming a bottom around the 1.3470 area.
Structure: The price is moving along an ascending trendline. Every time the price touches this line, buying demand reappears to push the price up, indicating that buyers are striving to maintain the upward momentum.
Volume Profile Analysis The liquidity zones on the chart are acting as critical checkpoints:
VAH (Value Area High) - 1.35095 area: This is the upper resistance zone. The price has attempted to break above this area but is meeting selling pressure and showing signs of a slight rejection.
POC (Point of Control) - around 1.35030: The current price is fluctuating right at the POC. This is the area with the highest traded volume, suggesting the market is in a temporary state of equilibrium and awaiting a clear breakout.
VAL (Value Area Low) - 1.34900 area: This is the strong support zone below. If the price undergoes a deep correction, this is where buyers are expected to re-enter the market.
Future Scenarios Based on the visual data, keep an eye on these levels:
Bullish Scenario (Continuation): If the price stays above the trendline and breaks through the VAH (1.35095), the next target will be the previous highs around 1.35250. Staying above the POC is a positive signal for buyers.
Bearish Scenario (Correction): If a 30-minute candle closes below the ascending trendline, the short-term uptrend will be threatened. In this case, the price is likely to head toward the VAL (1.34900) or deeper toward the Daily Open near 1.34845.
Summary and Notes:
Current Status: The price is in a tug-of-war phase right at the POC.
Reference Strategy: Watch the reaction at the trendline. If a long-wick candle forms here, a Buy order toward the VAH could be considered. A high-volume breakout above the VAH would confirm the continuation of the uptrend. Conversely, if the trendline is broken, it is better to stay sidelined or wait for opportunities at the VAL.

EURJPY – M30 Analysis ....EURJPY – M30 Analysis (based on My chart)
Market Structure
Price has been moving under a descending trendline.
Now we see a break & retest attempt with support from the Ichimoku cloud.
Momentum is shifting bullish intraday.
This looks like a trendline breakout → upside continuation.
📈 Buy Setup
Buy Zone: 183.80 – 184.10
🎯 Target Points
Target 1: 184.80
Target 2: 185.40 (major resistance / liquidity zone – your marked target)
❌ Invalidation
M30 close below 183.50 → bullish setup fails.
📌 Clean Signal Summary
Pair: EURJPY
Timeframe: M30
Bias: BUY
Targets: 184.80 → 185.40
If price hits 185.40, expect profit booking / possible reversal from there.

USDNOK (DAILY HEAD AND SHOULDERS RETEST)(USDNOK) Is coming back for a potential retest the daily is bearish the weekly is bearish everything in sink
