GBPUSD(20251230)Today's AnalysisMarket News:
Last week, Trump posted a lengthy statement on social media, which he called the "Trump Rule." He stated that the Federal Reserve, led by his soon-to-be-nominated new chairman, should lower interest rates to help keep the stock market and economy thriving, even at the risk of stimulating inflation. Trump posted, "I expect my new Fed chair to lower interest rates when the markets are doing well, not to destroy them without reason."
Technical Analysis:
Today's Buy/Sell Threshold:
1.3497
Support and Resistance Levels:
1.3543
1.3526
1.3515
1.3480
1.3469
1.3452
Trading Strategy:
If the price breaks above 1.3515, consider buying, with a first target price of 1.3526.
If the price breaks below 1.3497, consider selling, with a first target price of 1.3480.
Forex market

Buy USD/CAD at minor support.The USD/CAD pair has gained some 500 pips without any retracement and with other majors showing signs of a correction some USD strength might be just around the corner. The Daily RSI is still over sold so there is a chance of limited downside first before a long awaited correction starts. Entry will be at first minor support and profit at underside of cluster resistance. Please be aware, this trade must enter first before hitting target or trade is void.
Buy Limit : 1.3575 same as minor support
Stop : 1.3510 under yearly low
Profit : 1.3710 tag minor resistance
Risk 1 : 2.5 / Stop 65 pips.

Buy EUR/USD at 50 4Hour Moving Average.The EUR/USD trend is up and my target is 78.6% Fib retracement of Sept/Nov25 move as a first target and then see what happens to the structure. I don't usually trade so much over the holiday periods, so this is a smaller risk trade than normal. Buy at the 50 4Hour Moving Average into my target. Happy New year everyone and good luck for nest year!
Buy Limit : 1.1752 50 4H MA / ascending trendline
Stop : 1.1682 under cluster support
Profit : 1.1822 78.6% Fib retracement
Risk 0.5 : 0.5 / stop is 70 pips.

USDCHF - Bias BearishUSDCHF is carrying a bearish bias for today based on higher-timeframe daily price action.
The previous daily candle showed clear signs of selling pressure at premium levels, confirming that sellers are in control. This aligns with a bearish daily narrative, suggesting that price is more likely to seek lower levels rather than continue higher.
As long as price remains below yesterday’s key highs, the expectation is for bearish continuation, with any intraday retracements viewed as potential sell opportunities in line with the daily bias.
Looking the fact that the weekly profile is inline with the daily, adds extra level of conviction.
So during active trading session, we wait for Internal Range Liquidity to be mitigated (such case the 1h FVG as seen in the video), and then can confidently apply the ICT 2022 Module.
📌 Bias only. Execution is refined on lower timeframes.

GBPJPY-2H SETUP Strong impulsive move created bullish market structure
Price is holding above key support / demand
Consolidation after impulse = continuation likely
Plan
🟢 Buy from support
🎯 Targets: Previous highs → extension higher
❌ Invalidation: Clean close below support
Bias
Short–mid term: Bullish
Hold above support → continuation higher.

USDJPY 15m – Descending Channel Breakout SetupUSDJPY is trading inside a descending channel and holding above a key support zone, with price now pressing the channel’s upper trendline— a confirmed breakout above this structure could trigger a bullish reversal toward the marked resistance/target zone, while failure keeps the bearish structure intact.

NZD/USD long trade ideaBased on the same macro framework, I am re-entering a NZD/USD long position after the previous trade was stopped out at -0.5% risk.
NZD fundamentals remain unchanged: Growth has stabilized (-0.2% → 0.0%), inflation remains sticky (5.2%–5.3%), and yield expectations are improving (2.7% → 3.0%). The RBNZ’s rate cut (2.50% → 2.25%) has not altered the inflation persistence or the broader NZD macro thesis.
USD fundamentals also remain unchanged: Labor data continues to weaken (-105k vs +64k), inflation momentum is fading despite elevated CPI (4.4%–4.6%), and bond yields are compressing (3.0% → 2.7% and 3.0% → 2.6%). The Fed’s easing bias (4.00% → 3.75%) remains intact.
The prior stop-out was execution-level noise, not a macro invalidation. The directional thesis is still valid, and the market context remains aligned with NZD strength versus USD weakness.
Accordingly, I am re-entering NZD/USD long, maintaining strict risk control and discipline, treating this as a continuation of the same macro trade idea rather than a new thesis.

AUD-JPY Free Signal! Buy!
Hello,Traders!
AUDJPY has tapped into a well-defined horizontal demand zone after a sell-side liquidity sweep. Strong bullish displacement confirms smart money absorption, with price holding structure and aiming for continuation toward the next buy-side liquidity pool above.
--------------------
Stop Loss: 103.88
Take Profit: 105.13
Entry: 104.39
Time Frame: 5H
--------------------
Buy!
Comment and subscribe to help us grow!
Check out other forecasts below too!
Disclosure: I am part of Trade Nation's Influencer program and receive a monthly fee for using their TradingView charts in my analysis.

GBPAUD FREE SIGNAL|SHORT|
✅GBPAUD has traded into a premium supply zone after internal buy-side liquidity was engineered. Weak bullish continuation and rejection from premium suggest smart money distribution, favoring a downside expansion toward resting sell-side liquidity below.
—————————
Entry: 2.0180
Stop Loss: 2.0203
Take Profit: 2.0150
Time Frame: 2H
—————————
SHORT🔥
✅Like and subscribe to never miss a new idea!✅

EUR-JPY Will Grow! Buy!
Hello,Traders!
EURJPY has delivered a clean sell-side liquidity sweep into a well-defined horizontal demand area. Smart money absorption is evident after the grab, with price stabilizing and preparing for a bullish continuation toward the next buy-side liquidity pool above structure. Time Frame 2H.
Buy!
Comment and subscribe to help us grow!
Check out other forecasts below too!
Disclosure: I am part of Trade Nation's Influencer program and receive a monthly fee for using their TradingView charts in my analysis.


Day 1- failedGot crushed on day 1, big reason why is I forgot to include the margins needed for high variance assets such as gold and eth. Each trade was about 30% of available risk and was complete gambling. Mistakes made, lesson learned.
Moving forward, we're going to look at small stable forex pairs with low spread. Primarily Forex Majors with AUDNZD and EURGBP for some variety.
Attempt 2 tomorrow.

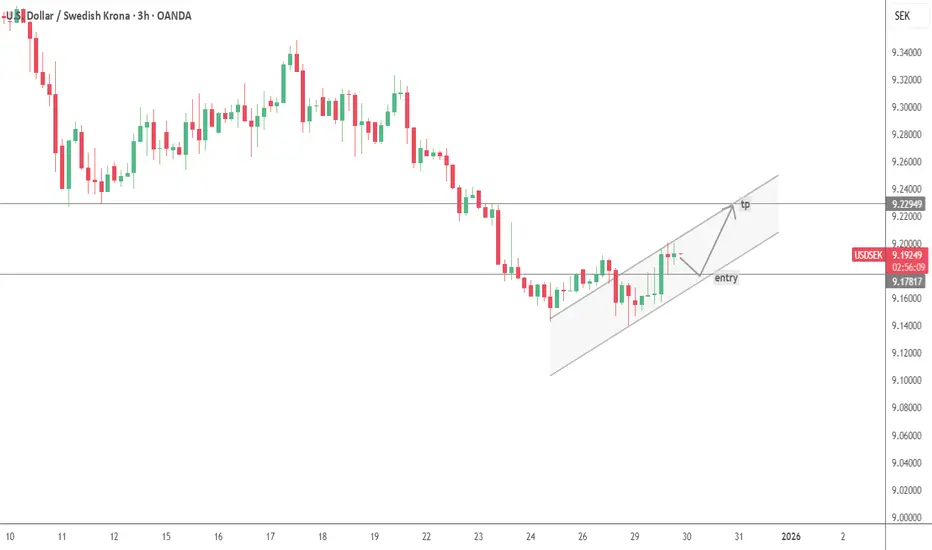
Will the upward trend continue?Will the uptrend continue?
As you can see on the chart, the price is in an ascending channel.
The first good support and resistance are drawn on the chart.


USDJPY-LONG IDEAUSDJPY has formed a divergence on 1 hour timeframe and broke the recent structure forming a higher high now the high low has been formed as it is in the bullish trend on higher timeframe this structural shift can take it toward upside.

The Beginner's Blueprint to Custom Trading Indicators
Your First AI‑Assisted Indicator Doesn't Need to Be Perfect - It Just Needs to Be Yours
In the AI era, you don't have to be "a coder" to build tools that actually match how you see the market.
You just need:
A clear idea
Basic Pine Script concepts
AI to help with the heavy lifting, while you fine tune/debug it.
This post is about turning that first idea into a real indicator on your chart.
---
Step 1: Start With One Sharp Idea, Not Ten Vague Ones
Instead of:
"I want an indicator that tells me when to buy and sell."
try:
"I want a trend filter that only shows long signals when price is above a 200‑MA and volatility is not extreme."
The sharper your idea, the easier it is for both you and AI to build something useful.
---
Step 2: Break the Idea Into Building Blocks
Most indicators combine a few simple components:
Trend (moving averages, higher highs/lows)
Momentum (RSI, rate of change)
Volatility (ATR, bands)
Volume (OBV, volume filters)
Your job is to decide:
Which components matter for your idea
How they should interact (AND, OR, weights)
Then you can tell AI exactly what to code instead of saying "make me something cool".
---
Step 3: Talk to AI Like a Developer, Not a Customer
When you ask AI for Pine code, be specific:
"Overlay indicator on price chart"
"Inputs for fastMA, slowMA, ATR length, ATR multiplier"
"Plot trend filter as a colored background"
"Create longCondition and shortCondition booleans"
You can even sketch the structure:
indicator("My Trend Filter", overlay = true)
// 1. Inputs
// 2. Calculations
// 3. Conditions
// 4. Plots
AI will happily fill in the gaps.
---
Step 4: Understand Before You Trust
AI can write the code, but you are still responsible for:
Reading each block and asking, "What does this do?"
Checking signals on different timeframes and markets
Confirming the indicator behaves like your original idea
Think of AI as an ultra‑fast junior dev. You’re still the lead.


GBPUSD H1 Tf trading idea for Bullish scenario Bullish Continuation | Structure + Location Setup
GBPUSD remains in a higher-timeframe of 4H uptrend, and current H1 price action shows healthy consolidation above key support, not reversal.
Context
• Trend: Bullish (H4 HH–HL intact)
• Market Phase: Advancing → pause / compression
• Location: Holding above 1.3430–1.3450 (value area)
• Structure: Flag / compression after impulsive move
Trend + structure remain bullish unless support breaks.
Trade Plan (H1 – Bullish Only)
Entry: Aggressive entry at current levels or Buy on bullish H1 confirmation (engulfing or pinbar) above support
Stop Loss: Below structure & support 1.3420
Take Profit : TP1 at 1:2 RR and TP as top of the flag pole
Invalidation
• H1 close below 1.3430
• No bullish follow-through after confirmation

GBP/USD - Reversal Setup at Key Support LevelEntry Point: The price is approaching a strong support level around 1.34918. This zone has previously acted as a support, offering a good entry point for a potential reversal.
Target: A potential move toward the resistance area near 1.35100 is the key target, providing a clear zone for profit-taking.
Market Sentiment: After consolidating near the support level, the price shows signs of potential upward movement, aiming for a test of the resistance.
Trade Setup: Consider entering near the support for an upward move toward resistance. Watch for confirmation of price action and any further signals of a reversal from support.

AUDNZD My Opinion! SELL!
My dear subscribers,
AUDNZD looks like it will make a good move, and here are the details:
The market is trading on 1.1523 pivot level.
Bias - Bearish
Technical Indicators: Both Super Trend & Pivot HL indicate a highly probable Bearish continuation.
Target - 1.1469
About Used Indicators:
The average true range (ATR) plays an important role in 'Supertrend' as the indicator uses ATR to calculate its value. The ATR indicator signals the degree of price volatility.
Disclosure: I am part of Trade Nation's Influencer program and receive a monthly fee for using their TradingView charts in my analysis.
———————————
WISH YOU ALL LUCK

GBPUSD-2H SetupPrevious sell impulse pushed price down, then failed to continue
Price returned to range highs and formed divergence
Clear distribution near resistance
Expecting downside continuation
Plan
🔴 Sell from current / resistance zone
🎯 Targets: Previous lows & liquidity below
❌ Invalidation: Strong close above resistance
Bias
Short–mid term: Bearish
Failure to continue up + divergence = downside favored.
