GBPUSD SHORT Market structure bearish on HTFs DW
Entry at Both Weekly and Daily AOi
Weekly rejection at AOi
Weekly Previous Structure point
Daily Rejection at AOi
Previous Structure point Daily
Around Psychological Level 1.34000
H4 Candlestick rejection
Levels 4.8
Entry 95%
REMEMBER : Trading is a Game Of Probability
: Manage Your Risk
: Be Patient
: Every Moment Is Unique
: Rinse, Wash, Repeat!
: Christ is King.
Forex market

AUDCAD SHORT Market structure bearish on HTFs 3
Entry at both Daily and Weekly AOi
Weekly Rejection at AOi
Previous Weekly Structure Point
Daily Rejection at AOi
Previous Structure point Daily
Around Psych Level 0.89500
H4 Candlestick rejection
Rejection from Previous structure
Levels 4.18
Entry 120%
REMEMBER : Trading is a Game Of Probability
: Manage Your Risk
: Be Patient
: Every Moment Is Unique
: Rinse, Wash, Repeat!
: Christ is King.

GBPUSD LongGBP/USD prices could potentially increase from the 1.3146 level within the Fair Value Gap (FVG) zone, with the next likely target being an upper FVG zone as a potential objective.

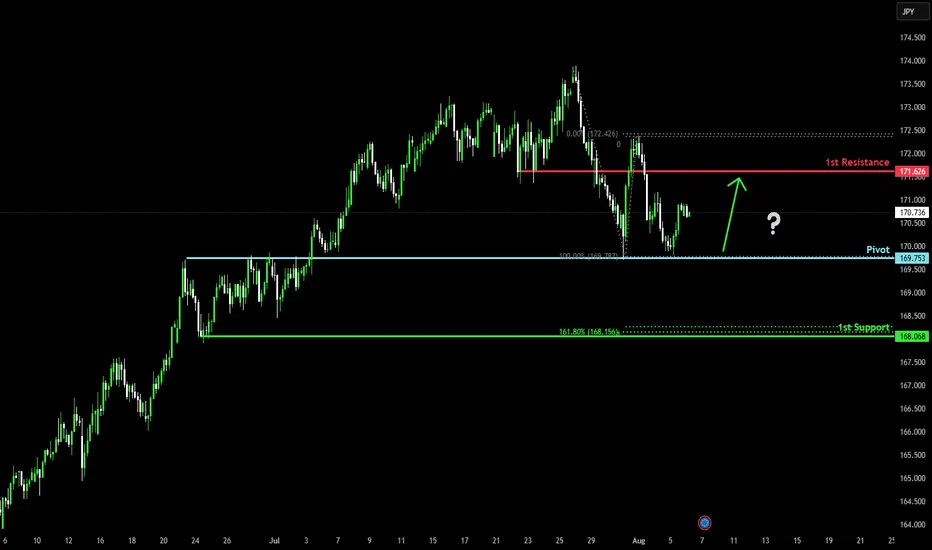
Bullish bounce off?EUR/JPY has bounced off the pivot which has been identified as an overlap support and could rise to the 1st resistance.
Pivot: 169.75
1st Support: 168.06
1st Resistance: 171.62
Risk Warning:
Trading Forex and CFDs carries a high level of risk to your capital and you should only trade with money you can afford to lose. Trading Forex and CFDs may not be suitable for all investors, so please ensure that you fully understand the risks involved and seek independent advice if necessary.
Disclaimer:
The above opinions given constitute general market commentary, and do not constitute the opinion or advice of IC Markets or any form of personal or investment advice.
Any opinions, news, research, analyses, prices, other information, or links to third-party sites contained on this website are provided on an "as-is" basis, are intended only to be informative, is not an advice nor a recommendation, nor research, or a record of our trading prices, or an offer of, or solicitation for a transaction in any financial instrument and thus should not be treated as such. The information provided does not involve any specific investment objectives, financial situation and needs of any specific person who may receive it. Please be aware, that past performance is not a reliable indicator of future performance and/or results. Past Performance or Forward-looking scenarios based upon the reasonable beliefs of the third-party provider are not a guarantee of future performance. Actual results may differ materially from those anticipated in forward-looking or past performance statements. IC Markets makes no representation or warranty and assumes no liability as to the accuracy or completeness of the information provided, nor any loss arising from any investment based on a recommendation, forecast or any information supplied by any third-party.
EURUSD DAILY TIMEFRAME ANALYSIS 📊 Key Observations:
1. Uptrend and Trendline Support:
The pair was following a strong ascending trendline.
Price respected this trendline until it broke downwards, indicating a break of bullish market structure.
2. Break of Structure (BoS):
The chart marks a clear Break of Structure (BoS) below the trendline, signifying that buyers lost control and sellers stepped in.
This often suggests a potential trend reversal or at least a deeper correction.
3. Fair Value Gap (FVG):
A Fair Value Gap (imbalance) is highlighted between ~1.1680–1.1830.
This area represents a liquidity void where price moved too quickly in one direction and may return to "fill the gap".
Price is likely to retrace into this FVG, possibly touching the underside of the broken trendline (now resistance).
4. Bearish Retest Zone:
The FVG and trendline intersection make this a strong bearish retest zone.
If price reaches this level, it could act as a supply zone or area of resistance for further downside continuation.
---
🔁 What Could Happen Next:
✔️ Bullish Scenario (less likely without fundamentals):
Price breaks above the FVG and reclaims the trendline.
If that happens, bullish momentum could resume with 1.20+ as the target.
❌ Bearish Scenario (currently more probable):
Price retraces into the FVG zone and rejects.
This retest confirms the trendline as resistance.
Bearish continuation toward 1.1400, 1.1300, or even 1.1100 is likely.
---
🔑 Key Technical Levels:
Level Type Price Level (Approx)
FVG Upper Bound 1.1830
FVG Lower Bound 1.1680
Support 1 1.1400
Support 2 1.1300
Support 3 1.1065
---
🧠 Conclusion:
This chart shows a classic Smart Money Concept (SMC) setup:
Break of structure ➝ Retrace to FVG ➝ Potential bearish continuation. Watch how price reacts around 1.1680–1.1830. That zone will reveal if sellers are still in control.

USDJPY 1H BEARS STILL IN CONTROLUJ fail to TRADE ABOVE 147.90 and still trade below 50EMA (EMA50 CAN ACT AS CONTINUATION)
I have 2 TPS (AS SHOWN ON THE CHART)
Second tp if we get there can be very good buying area (WITH CANDLE CONFIRMATION OF COURSE)
Will update along the way
REMEMBER: IS NOT HOW MUCH YOU LOST WHEN YOU LOOSE A TRADE,BUT HOW MUCH YOU GAIN WHEN YOU WIN (RISK/REWARD ITS YOUR ONLY SAVIER IN THIS GAME)

Trade Plan: GBP/JPY — 4H AnalysisTrade Plan: GBP/JPY — 4H Analysis
Market Context
Pair: GBP/JPY
Timeframe: 4H
Date: 6th August 2025
Key Observation:
Price attacked weekly sell-side liquidity (PML).
CISD (Closed Inside Swing Demand) formed, showing bullish reaction.
Higher timeframe weekly buyside liquidity (PMH) is intact and a potential long-term target.
Bias: Bullish
Key Levels
PML (Weekly Sell-Side Liquidity): Price tapped into it and reversed.
PMH (Weekly Buyside Liquidity): Near 200.000, long-term target.
Fair Value Gaps (FVGs): Two bearish FVGs (red boxes) are marked as potential reaction zones.
Entry Criteria
Entry Zone: After confirmation of bullish dealing range above CISD.
Trigger: Price breaking above minor resistance (current consolidation zone near 196.143).
Confirmation: Lower timeframe bullish FVG inside context area.
Target
Short-Term Target: 1st FVG (near 197.300–197.700).
Mid-Term Target: 2nd FVG (near 198.200–198.700).
Long-Term Target: PMH near 200.000.
Stop Loss
Below recent swing low formed during liquidity sweep (below 195.000).
Notes
Patience Required: As title suggests, wait for bullish confirmation candle to close before entry.
Risk Management: Target minimum 2R reward before scaling out.
Invalidation: Price closing below CISD and not showing bullish FVG in lower timeframe.

Buying opportunities on EURUSDEURUSD is currently in an uptrend.
Following Friday’s news, we saw a bounce and a higher low.
The target is a retest and breakout above the previous highs around 1,1800.
The exact entry point can be identified on the lower timeframes after a reaction.
This idea becomes invalid if the price drops below 1.1388!

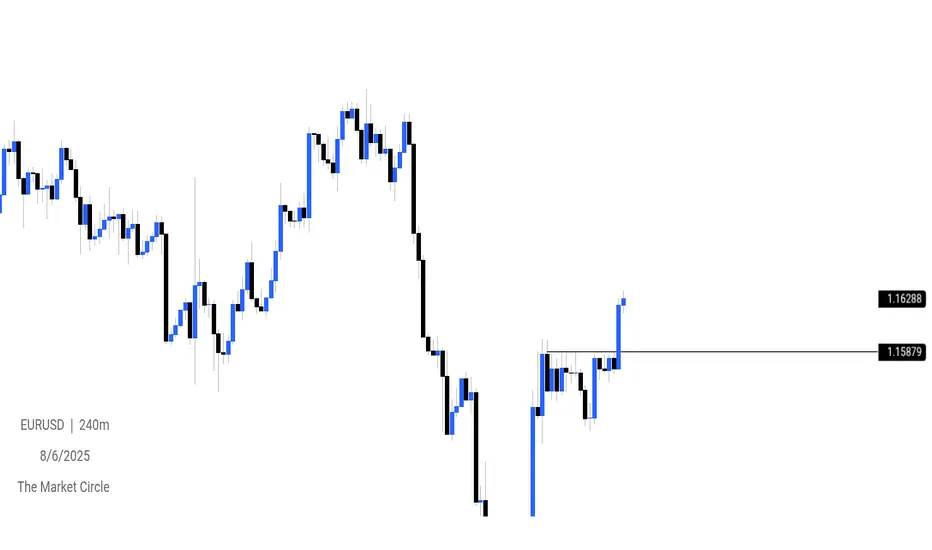
EURUSD OUTLOOKEUR/USD is expected to show bullish sensitivity around the 1.15879 level, indicating a key support area where buyers may step in.
EURUSD 60/15Current state is ranging before a huge green.
Game plan:
1. 15m is showing bullish, if 1h could BOS, then will go long.
2. If cannt BOS then will go for short. Make sure 15m has BOS too.

100% Guaranteed EURUSD Long time buy Position .Eur Usd long time buy position . Next profit will be 50 to 100 pips .
Take 1st tp 50 pips and wait for next 100 pips
If you have any question fell free ask my any question

EURUSD SHORTThe current EUR/USD exchange rate is 1.1604, with a 0.24% increase (0.0028) from the previous closing rate. Here's a breakdown of the rate's movement¹:
- *Current Rate*: 1 EUR = 1.16 USD
- *Daily Change*: +0.0028 (0.24%)
- *Daily High*: 1.15886
- *Daily Low*: 1.15640
Some analysts predict a potential decline in EUR/USD due to various factors, including² ³:
- *Federal Reserve Interest Rate Decisions*: Expectations of a rate cut may impact the USD.
- *US Tariff Policies*: Renewed concerns over tariffs could influence the EUR/USD rate.
- *Economic Indicators*: Weak US job data and Eurozone sentiment may affect the rate.
Keep in mind that forex markets can be highly volatile, and rates may fluctuate rapidly. For the most up-to-date information, consider checking financial news websites like FXStreet etc

ENTRY USDCADDisclaimer:
This is merely a chart-based analytical trading idea and is not considered investment advice. Please manage your risks carefully and conduct your own research before making any trading decisions.

NZDUSD Will Go Higher! Long!
Here is our detailed technical review for NZDUSD.
Time Frame: 1D
Current Trend: Bullish
Sentiment: Oversold (based on 7-period RSI)
Forecast: Bullish
The market is testing a major horizontal structure 0.592.
Taking into consideration the structure & trend analysis, I believe that the market will reach 0.602 level soon.
P.S
Overbought describes a period of time where there has been a significant and consistent upward move in price over a period of time without much pullback.
Disclosure: I am part of Trade Nation's Influencer program and receive a monthly fee for using their TradingView charts in my analysis.
Like and subscribe and comment my ideas if you enjoy them!

EURUSD - approaching the Resistance ClusterFurther for my previous idea on EURUSD - we are getting to the Resistance cluster, which if respected will constitute the Bearish Validation for trend reversal to downtrend.
The level will most likely be reached on the today's session, then I need to see the price crossing down SMA20 (4H) to confirm the reaction.
Just my humble opinion.


CAD_JPY STRONG UPTREND|LONG|
✅CAD_JPY is trading in an uptrend
Along the rising support line
Which makes me bullish biased
And the pair is already making
A bullish rebound from the support
So a further move up is expected
With the target of retesting the
Level above at 107.705
LONG🚀
✅Like and subscribe to never miss a new idea!✅

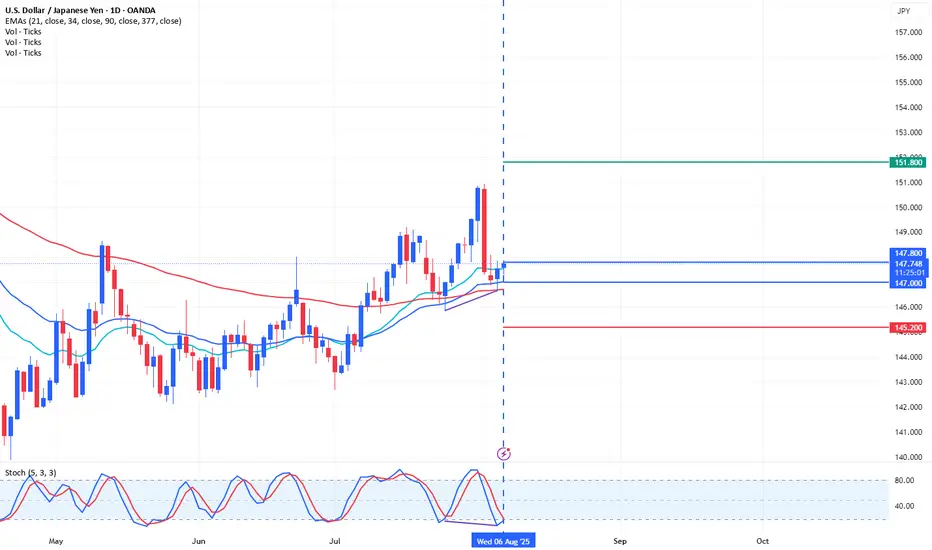
Trading Ideas USDJPY 1D [Disc On]Technical Analysis:
There is a hidden bullish stochastic divergence on the 1D timeframe, indicating a potential continuation of the previous trend. The price has also entered the Fibonacci 0.618 retracement area.
Conclusion:
There is a high probability of seeking BUY positions in the range of 147.800 – 147.000, with a Take Profit target at 151.800 and a Stop Loss at 145.200.
Pushing Hard To RisePrice has been butting up against the 1.1585 level for days. I believe a large breakout is brewing.
Weekly point of control and the dailies are all in a similar area. Still that huge fair value gap from last week below, but I believe this will stay for now.
I believe the highs at 1.1800 will be tested again and possibly broken. There seems to be little faith in the USD at the moment.

Could the price bounce from here?EUR/CAD has bounced off the pivot which is a pullback support, and could rise to the 1st resistanc,e which is a multi-swing high.
Pivot: 1.58922
1st Support: 1.57671
1st Resistance: 1.61066
Risk Warning:
Trading Forex and CFDs carries a high level of risk to your capital and you should only trade with money you can afford to lose. Trading Forex and CFDs may not be suitable for all investors, so please ensure that you fully understand the risks involved and seek independent advice if necessary.
Disclaimer:
The above opinions given constitute general market commentary, and do not constitute the opinion or advice of IC Markets or any form of personal or investment advice.
Any opinions, news, research, analyses, prices, other information, or links to third-party sites contained on this website are provided on an "as-is" basis, are intended only to be informative, is not an advice nor a recommendation, nor research, or a record of our trading prices, or an offer of, or solicitation for a transaction in any financial instrument and thus should not be treated as such. The information provided does not involve any specific investment objectives, financial situation and needs of any specific person who may receive it. Please be aware, that past performance is not a reliable indicator of future performance and/or results. Past Performance or Forward-looking scenarios based upon the reasonable beliefs of the third-party provider are not a guarantee of future performance. Actual results may differ materially from those anticipated in forward-looking or past performance statements. IC Markets makes no representation or warranty and assumes no liability as to the accuracy or completeness of the information provided, nor any loss arising from any investment based on a recommendation, forecast or any information supplied by any third-party.

USDCAD's Opportunity Bell Is Ringing — Don’t Miss Out!Hey there, my valued friends!
I’ve prepared a fresh USDCAD analysis just for you.
📌 If the 1.37245 level breaks, the next target will be 1.38000.
Every single like you send my way is the biggest motivation behind sharing these analyses.
🙌 Huge thanks to each and every one of you who supports me!
Would you like to add a visual or a catchy headline to boost engagement even more? I can help with that too.

1h chart look outAUD/USD breaks out of the falling wedge pattern with strong bullish momentum. Price is aiming toward the next key resistance zone around 0.6600 – 0.6650. A successful retest of the breakout could confirm further upside potential.

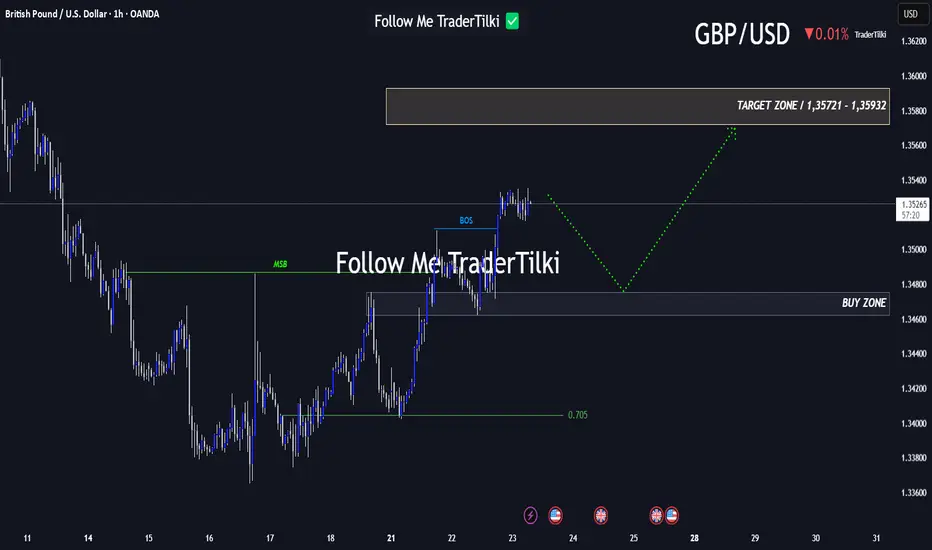
Every Like Is a Boost: This GBPUSD Analysis Is Just for You!Good morning, friends 🌞
Due to the recent shift in GBPUSD’s market structure, I plan to enter a buy position when price reaches the 1.34753 – 1.34623 range.
Target levels: 1.35721 and 1.35932 📈
Every like you send fuels my motivation to share fresh analyses. Thank you to everyone who’s supporting this journey ❤️