EURUSD at a Crossroads: The Battle at the 78.6% Fib LevelMarkets rarely move in a straight line. After a powerful rally was stopped by monthly supply, EURUSD has arrived at a critical crossroads. The higher timeframe trend is still bullish, but a potential daily downtrend is emerging. This analysis focuses on the single high-probability short setup that could define the next major move.
After the price found support at the 50% Fibonacci retracement level of the weekly structure , which coincided with the daily structure's break level, further decline was prevented by negative NFP news last Friday, which pushed the dollar index down. The long scenario from this level, which I detailed in my previous analysis " EURUSD: The Logic of Institutional Capital Unveiled ", is still active. An entry directly from that level was impossible due to the reversal occurring on highly volatile news, but it's still possible from the manipulation zone in the form of the bullish order block below.
This current analysis is a continuation of that one, but from the perspective of looking for short positions , as the price has shown its intention to first reach a zone of interest above. So, let's try to further unravel the logic and the next step of large capital.
The global uptrend of the pair was halted by a monthly supply zone , from which a correction began and subsequently reversed at the 50% weekly level. One might expect the uptrend to continue and only look for long entries. However, the fact that the price found its pivot point in a monthly supply zone and has since shown the potential genesis of a bearish daily structure allows us to consider counter-trend short trades, with fresh footprints from "smart money" to guide us.
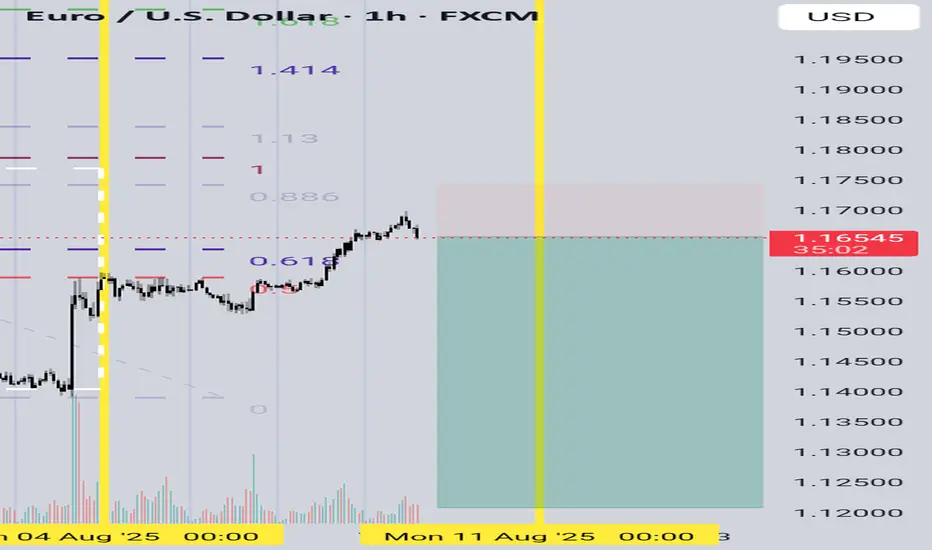
On its continued ascent, the price will face resistance in the form of a bearish order block in conjunction with the 78.6% retracement level of the new, potentially bearish structure. Everything will depend on whether this level and order block hold and show a reversal reaction. The entry condition for a short will be the mitigation of this order block concurrently with reaching the 78.6% level, followed by price finding acceptance below it .
► Invalidation: Invalidation of the short scenario would be a break of the 78.6% level with the price finding acceptance above it.
In the case of a short setup forming and an entry being confirmed, the minimum target for the price will be the bullish daily order block below, which was formed during the liquidity sweep of the daily structure's break level.
A key global context for EURUSD to consider upon the mitigation of the daily bearish order block is the Dollar Index (DXY) . After breaking its bearish daily structure (BOS D) to the upside, it also began a correction after NFP. The target and potential reversal zone for DXY is the same as EURUSD's but a mirror image: the 78.6% Fibonacci retracement level in conjunction with a daily order block . It is highly probable that the potential setup formation on these two instruments will occur synchronously. Given their strong inverse correlation, a potential short setup on the euro pair would receive additional confirmation if a long setup forms on the Dollar Index.
~~~~~~~~~~~~~~~~~~~~~~~~~~~~~~~~~~~~~~~~~~~~~~~~~~~~~~~~~~~~~~~~~
The principles and conditions for forming the manipulation zones I show in this trade idea are detailed in my educational publication, which was chosen by TradingView for the "Editor's Picks" category and received a huge amount of positive feedback from this insightful trading community. To better understand the logic I've used here and the general principles of price movement in most markets from the perspective of institutional capital, I highly recommend checking out this guide if you haven't already. 👇
P.S. This is not a prediction of the exact price direction. It is a description of high-probability setup that become valid only if specific conditions are met when the price reaches the marked POI. If the conditions are not met, the setup are invalid. No setup has a 100% success rate, so if you decide to use this trade idea, always apply a stop-loss and proper risk management. Trade smart.
~~~~~~~~~~~~~~~~~~~~~~~~~~~~~~~~~~~~~~~~~~~~~~~~~~~~~~~~~~~~~~~~~
If you found this analysis helpful, support it with a Boost! 🚀
Have a question or your own view on this idea? Share it in the comments. 💬
► Follow me on TradingView for timely updates on THIS idea (entry, targets & live trade management) and not to miss my next detailed breakdown.
~~~~~~~~~~~~~~~~~~~~~~~~~~~~~~~~~~~~~~~~~~~~~~~~~~~~~~~~~~~~~~~~~
Forex market

AUDJPY Potential UpsidesHey Traders, in the coming week we are monitoring AUDJPY for a buying opportunity around 94.900 zone, AUDJPY is trading in an uptrend and currently is in a correction phase in which it is approaching the trend at 94.900 support and resistance area.
Trade safe, Joe.

EURUSD - NEW BREAKOUT!Hello Traders!
The EURUSD price formed a rectangle pattern.
At the moment, the resistance level (1.15971 - 1.15830) is broken!
So, I expect a bullish move🚀
__________
TARGET: 1.17390🎯

GBPUSD SWING: SHORT OPPORTUNITYHi there,
Of all the USD pairs, I think GBPUSD is the weakest and I speculate lower prices.
At the very least, to hunt the equal lows the market created by not taking the previous low just before the monthly FVG. That action is suspect - it will induce buyers and drop more shorts on them.
Anyways, watch out for my next post.
Cheers,
Jabari

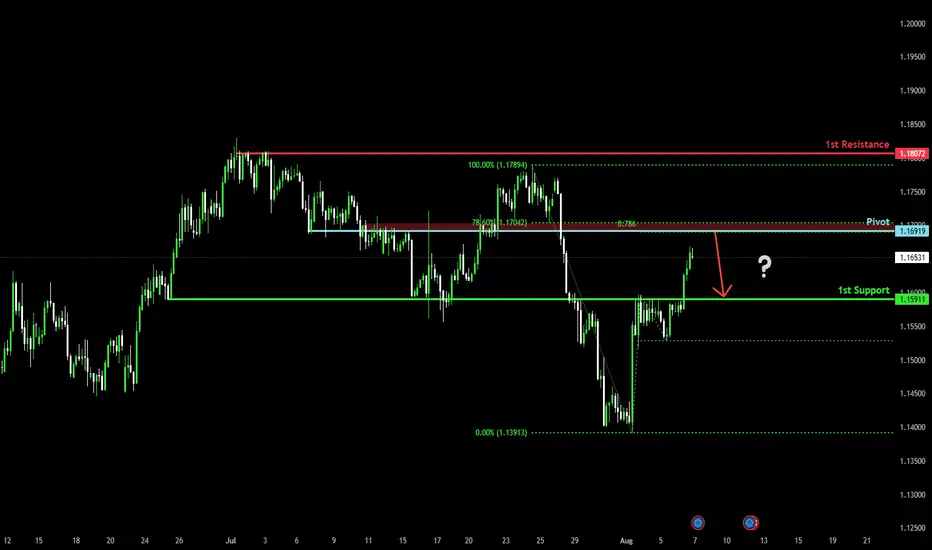
Bearish reversal for the Fiber?The price is rising towards the pivot and could reverse to the 1st support which is an overlap support.
Pivot: 1.1691
1st Support: 1.1591
1st Resistance: 1.1807
Risk Warning:
Trading Forex and CFDs carries a high level of risk to your capital and you should only trade with money you can afford to lose. Trading Forex and CFDs may not be suitable for all investors, so please ensure that you fully understand the risks involved and seek independent advice if necessary.
Disclaimer:
The above opinions given constitute general market commentary, and do not constitute the opinion or advice of IC Markets or any form of personal or investment advice.
Any opinions, news, research, analyses, prices, other information, or links to third-party sites contained on this website are provided on an "as-is" basis, are intended only to be informative, is not an advice nor a recommendation, nor research, or a record of our trading prices, or an offer of, or solicitation for a transaction in any financial instrument and thus should not be treated as such. The information provided does not involve any specific investment objectives, financial situation and needs of any specific person who may receive it. Please be aware, that past performance is not a reliable indicator of future performance and/or results. Past Performance or Forward-looking scenarios based upon the reasonable beliefs of the third-party provider are not a guarantee of future performance. Actual results may differ materially from those anticipated in forward-looking or past performance statements. IC Markets makes no representation or warranty and assumes no liability as to the accuracy or completeness of the information provided, nor any loss arising from any investment based on a recommendation, forecast or any information supplied by any third-party.
USDJPY Is Showing a Potential Head & Shoulders PatternUSDJPY Is Showing a Potential Head & Shoulders Pattern
After the decline and speculation created by the US NFP, we can see that the USD wants to recover again. It seems that the buyers have returned and did not change the direction of the USDJPY just for the employment data.
However, it was all old in my opinion, despite the aggressive selling of the USD.
During the early European morning, the Japanese Yen lost momentum as disappointing wage data increased economic concerns in Japan.
Labor income in Japan grew by 2.5% year-on-year in June, although it came in below the expected growth of 3.2%.
On the other hand, the BOJ is not serious about raising interest rates again in order to fight inflation and this is still creating some pressure on the JPY.
In the short term, USDJPY looks set to rise as shown in the chart with targets at 148.60 and 149.50.
You may find more details in the chart!
Thank you and Good Luck!
PS: Please support with a like or comment if you find this analysis useful for your trading day
Disclosure: I am part of Trade Nation's Influencer program and receive a monthly fee for using their TradingView charts in my analysis.

EURUSD Potential UpsidesHey Traders, in today's trading session we are monitoring EURUSD fora buying opportunity around 1.15800 zone, EURUSD is trading in an uptrend and currently is in a correction phase in which it is approaching the trend at 1.15800 support and resistance area.
Trade safe, Joe.

Is USDCHF correction over?✏️USDCHF in the medium term is still in an uptrend. After a retest wave of Fibonacci 0.5 some buying pressure was present in the European session today with the confirmation of the H4 candle Full bullish force. The reaction at Fibonacci is also the support zone for break out in the past. This is considered an important point in the structure of the bullish wave. The BUY point is triggered with the expectation that USDCHF will break the peak of last week and head towards higher levels.
📉 Key Levels
BUY now 0.80800 (confirmation of candle at the support zone)
BUY DCA trigger Break the peak 0.816
Target 0.830
Leave your comments on the idea. I am happy to read your views.

EUR/JPY Channel Formation (6.08.2025) The EUR/JPY Pair on the M30 timeframe presents a Potential Selling Opportunity due to a recent Formation of a Channel Pattern. This suggests a shift in momentum towards the downside in the coming hours.
Possible Short Trade:
Entry: Consider Entering A Short Position around Trendline Of The Pattern.
Target Levels:
1st Support – 169.74
2nd Support – 169.25
🎁 Please hit the like button and
🎁 Leave a comment to support for My Post !
Your likes and comments are incredibly motivating and will encourage me to share more analysis with you.
Best Regards, KABHI_TA_TRADING
Thank you.
Disclosure: I am part of Trade Nation's Influencer program and receive a monthly fee for using their TradingView charts in my analysis.

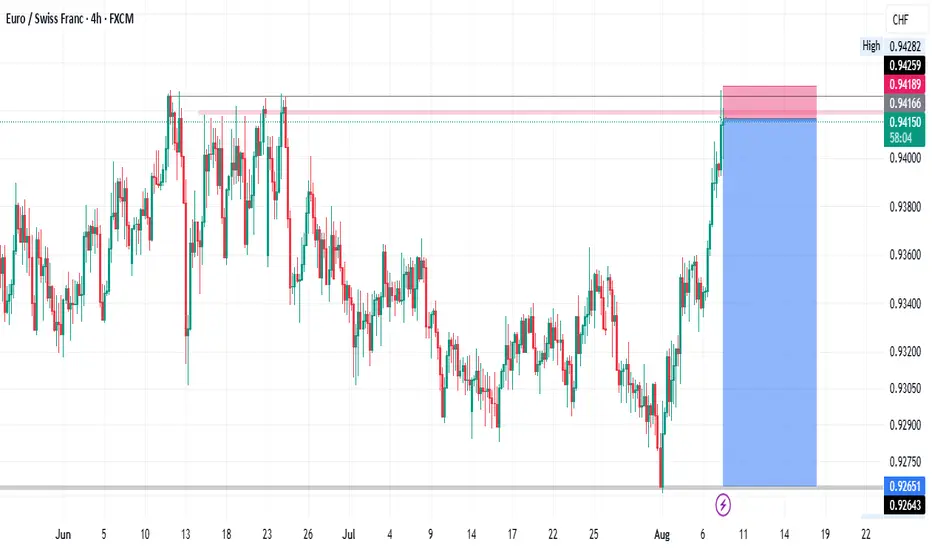
EURCHF: Intraday Bearish Move?! 🇪🇺🇨🇭
EURCHF reached a key horizontal resistance level.
I think that there is a high probability that the price
will retrace from that.
The closest intraday support is 0.93825,
it will be the goal for the sellers.
❤️Please, support my work with like, thank you!❤️
I am part of Trade Nation's Influencer program and receive a monthly fee for using their TradingView charts in my analysis.

EURUSD Holds Above 1.1600 – Where Will The Upside Go?Hey everyone, do you think EURUSD will continue to rise?
Yesterday, EUR/USD had a strong rally, breaking through the 1.1600 level, and it’s currently holding its gains in today’s European session.
The main reason behind this rise is an improved risk sentiment, making it harder for the US dollar to gain traction. Investors are awaiting comments from Fed officials, which is providing support to EURUSD.
In the short term, the market seems ready for another push higher. The next key resistance level to watch is 1.1800, and if it breaks through, the path towards 1.19XX could open up.
What do you think? Will EURUSD continue this strong upward momentum? Share your thoughts below!
Good luck with your trading!

GBPUSD Head & Shoulder Pattern for sell target 1.3100#GBPUSD daily head & shoulder pattern has been formed. price broke below neckline last week which is 1.30705 level. Price is moving upside as a pullback without volume. Institutional traders did profit target in their short position. Institutions are waiting price test their supply zone for another leg lower. split your risk into two positions i.e 1st order as 1.3529, 2nd order as 1.3574, stop loss: 1.3605. Medium term target: 1.3100, while 1.3215 is also level of interest for profit taking.

EUROUSD NEW OUTLOOKAccording to M15 analysis EUROUSD Market is running in side wave from last few hours now market will be go down RESISTANCE LEVEL So if you are intersted then Go sell from RESISTANCE LEVEL TRADE AT YOUR OWN RISK

Supply in Sight: AUDUSD Gearing Up for a Reversal?Hello TradingView Family / Fellow Traders. This is Richard, also known as theSignalyst.
📈AUDUSD has been overall bullish trading within the rising channel marked in red and it is currently retesting the upper bound of the channel acting as an over-bought zone.
Moreover, the blue zone is a strong supply.
📚 As per my trading style:
As #AUDUSD approaches the red circle zone, I will be looking for bearish reversal setups (like a double top pattern, trendline break , and so on...)
📚 Always follow your trading plan regarding entry, risk management, and trade management.
Good luck!
All Strategies Are Good; If Managed Properly!
~Rich
Disclosure: I am part of Trade Nation's Influencer program and receive a monthly fee for using their TradingView charts in my analysis.

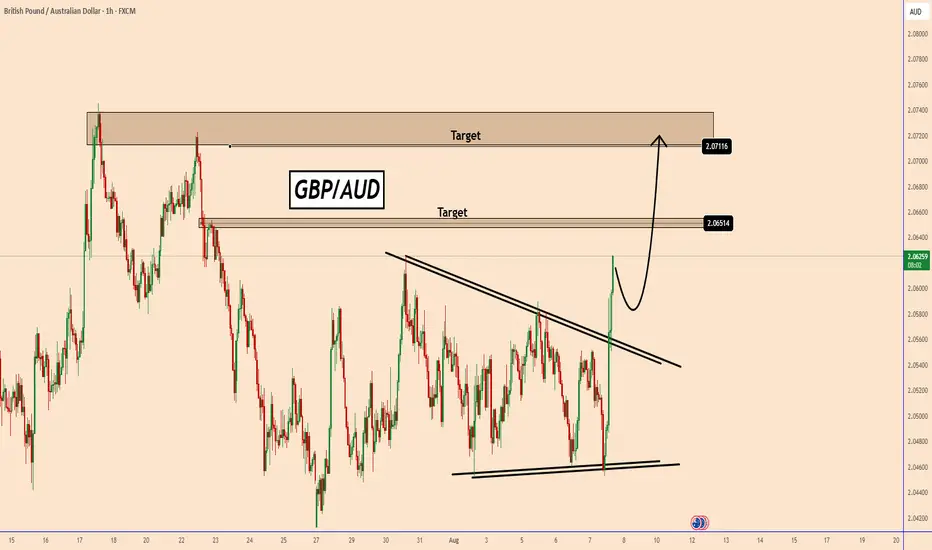
GBPAUD started an uptrend movement after BOE rate decisionGBPAUD started an uptrend movement after BOE rate decision
Today, the Bank of England cut interest rates by 25 basis points to 4% from 4.25%.
BoE Governor Bailey explained that he has not changed his view on the direction of the interest rate path, the question is the timeframe. The BoE is hinting at prolonged higher rates, weighing on growth, sending an aggressive signal to the market.
GBPAUD strengthened after the rate decision was released and has risen further since then.
GBPAUD broke out of this bullish triangle pattern. The breakout looks strong and the volume that the price has increased was high.
I expect a small pause before GBPAUD moves further to 2.0650 and possibly higher to 2.0700, where it was also rejected several times, but where it was also tested several times.
You may find more details in the chart!
Thank you and Good Luck!
PS: Please support with a like or comment if you find this analysis useful for your trading day
Rebuy position* We set **entry above the current price**, at **147.150**, to avoid false breakouts and confirm bullish momentum continuation.

DeGRAM | EURUSD returned to the channel📊 Technical Analysis
● EURUSD broke above the descending channel resistance and reclaimed the 1.1567 level, signaling a potential reversal after defending 1.1446 support.
● The price is forming a bullish sequence of higher lows, and a breakout above 1.1592 could open the path toward the 1.1765 resistance zone.
💡 Fundamental Analysis
● A weaker-than-expected US ISM Services report triggered USD selling, while hawkish ECB remarks from Nagel supported euro recovery.
● Markets are pricing in fewer Fed hikes as job data cools, reducing dollar appeal and favoring EUR upside.
✨ Summary
Long bias above 1.1446. Breakout targets 1.1592 ➜ 1.1765. Setup valid while structure holds above prior resistance-turned-support.
-------------------
Share your opinion in the comments and support the idea with a like. Thanks for your support!

EURGBP Short high probabilityWe have been overextended on all the oscillators on the higher TF. I suspect we need to re test the average price before we can continue up, if we reverse then we are still on the right foot for our speculation. I would add positions every candle or every other candle until we hit Sl and lets take TP based on VWAP or just above VWAP

EURCHF - Low risk High Probability IdeaIn higher time frames EURCHF is in a downtrend, but for some time including the daily and intra day timeframes we have been in an uptrend (higher time frame counter trend).
Currently prices being at a strong monthly level, we are expecting a shift of the current intraday uptrend situation.
We are capitalizing the opportunity without forgetting to be risk cautious.
DISCAIMER: This is meant for educational purpose and not a financial advice.
Regards, relentlessforex.
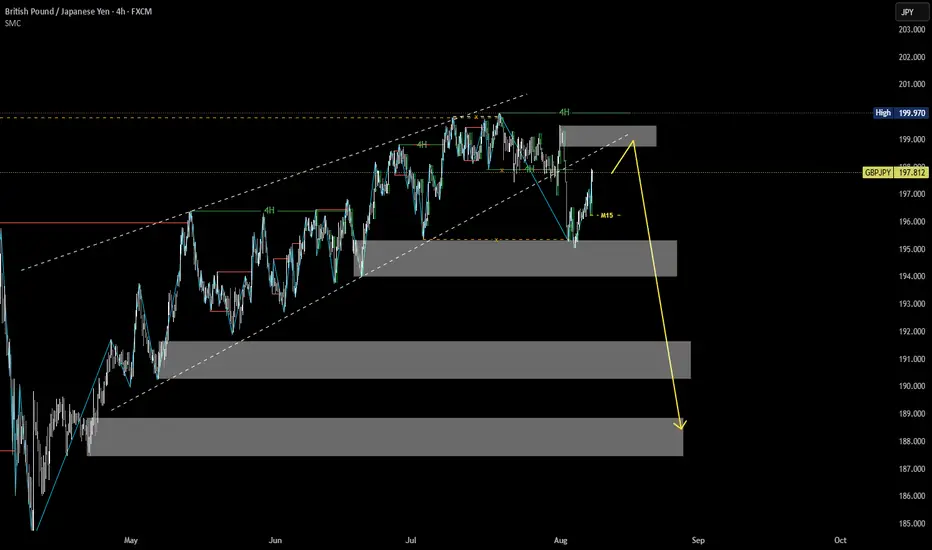
Market Structure Analysis of GBPJPY on the 4H TimeframeMulti-Timeframe Context (HTF: 4H, LTF: M15)
The main trend on the 4H chart is bearish.
Price is currently in a retracement phase (pullback).
On the M15, price is in a bullish short-term structure.
We monitor the M15 market structure closely to look for signs of weakness and identify high-probability short entries in alignment with the 4H downtrend.
EuRUsD Downtrend continuation after pullback.EURUSD has seen considerable drop after massive gain through the year. Previous weeks downtrend is a clear directional significance for a pullback from all that gain. Looking forward to a continuation down in the following days... Please leave a like.

GBP/JPY Trap? Smart Money Might Be Setting Up the Next Drop📊 1. Technical Overview
Price broke the bullish structure decisively, closing below a key demand zone between 195.00–196.00, leaving a large unfilled imbalance.
Last week's recovery candle suggests a potential pullback toward 197.40–197.80, now acting as a resistance confluence.
The descending channel and weak RSI further support a continuation of the bearish trend.
Bearish targets: 193.50 and 192.20
📈 2. COT (Commitment of Traders) Report
GBP:
Non-commercials are cutting long positions (–5,961) and adding shorts (+6,637) → Bearish divergence developing on GBP.
JPY:
Non-commercials are heavily increasing short exposure (+15,113), but remain strongly net-long overall, indicating a potential exhaustion of bullish JPY positioning.
💭 3. Retail Sentiment
Positioning is neutral: 51% long / 49% short.
This balance suggests no excessive retail bias, leaving room for directional moves without immediate contrarian pressure.
📆 4. Seasonality
August is historically bearish for GBP/JPY:
• –2.82% (20Y average)
• –3.04% (15Y average)
• –1.44% (5Y average)
The data shows a consistent historical bias to the downside during this month.
🎯 5. Strategic Outlook
• Primary Bias: Bearish below 197.40–197.80
• Invalidation: Weekly close above 198.10
• Targets: 195.00 > 193.50 > 192.20
The confluence of technical rejection, bearish COT dynamics, neutral sentiment, and negative seasonality supports a corrective scenario for August.
