AUDNZD LONG 7/8/2025Axy : bullish
zxy : bearish
trend : bullish
divergence : n/a
continuation : break of consolidation box
currently retracing
trade plan
buy limt
Forex market

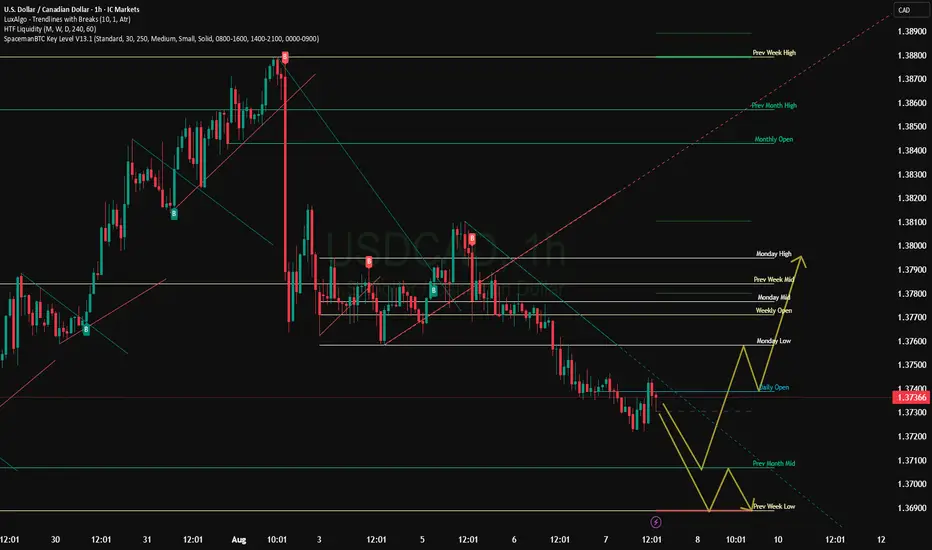
USDCAD - Big Picture and MomentumBig Picture and Momentum
USD/CAD is trading comfortably above the 50-day EMA (~1.3728) and above the 9-day EMA, indicating continued bullish momentum. The 14-day RSI is above the 50 level, confirming the positive market sentiment.
Key Support and Resistance
Resistance: 1.3770–1.3798 range is the current target, a break of which could open the way to the January high around 1.4016.
Support:
50-day EMA (~1.3728) is the first line of defense.
Next is the 9-day EMA (~1.3679).
A further weakening could see a decline to 1.3560, and a strong correction could see a decline to the February 2024 lows (~1.3420).
Market Behavior Scenarios
Bullish scenario: holding above EMA with RSI > 50 creates good conditions for a move up to 1.3770-1.3800, and then to 1.4016, with increasing momentum.
Bearish scenario: falling below EMA, especially below 1.3679, can lead to a deeper decline - to 1.3560 and then to 1.3420.
Recommendations for traders
Long position: can be considered for entry when holding above 1.3728, with a target of 1.3770-1.3800, and a stop just below the EMA.
Short position: justified when falling below 1.3728-1.3679, with a target of 1.3560, and a stop just above the EMA level.
CAD/SGD – Watchlist Update The recent break of structure wasn’t convincing enough for us to consider it a valid shift.
There was no strong momentum behind the move, and price failed to show commitment to the downside.
We’ll continue to watch for a more decisive break, followed by a clean pullback into resistance.
Only then will we begin evaluating the setup through the lens of the VMS strategy.
📌 No need to force it. Patience will always protect your edge.

USDCAD going for a lower lowIf we patiently look at USDCAD we will notice that theres still some bearish momentum its goin to take some time before it will go up but make sure you aet your Sls right

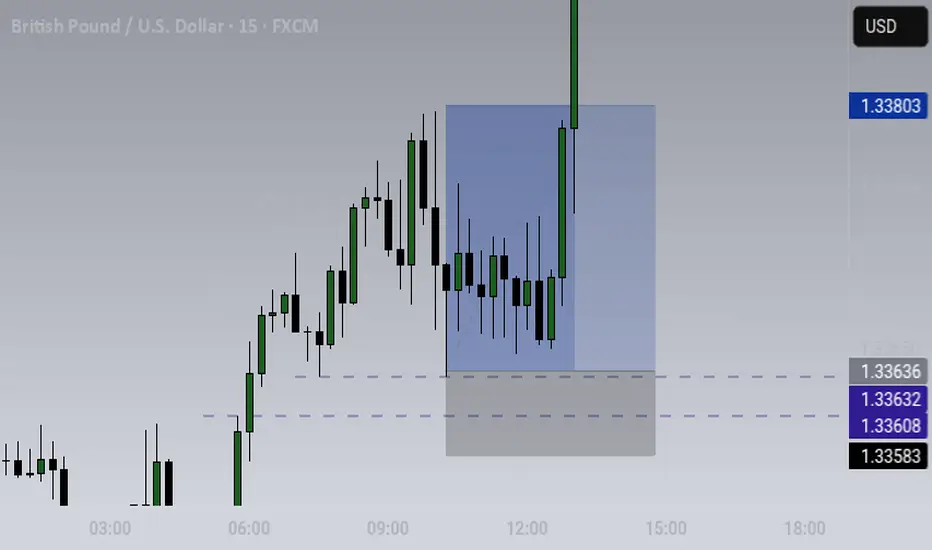
GBPUSDNo surprises. As you know, cable and fibre move together! What we need to see is about a 50 pip move to reach the highlighted FVGs. The BoE was used to trigger the move and I still expect it to see it got higher, clearing the 1 hour equal highs!
Stay safe and don't blow your account!

Let see if this will work out.Triple top, RSI divergence and strong news with huge engulfing bearish candle. Hope to get a pullback to that lower lever but everything is possible as always. I have took risk on this trade.

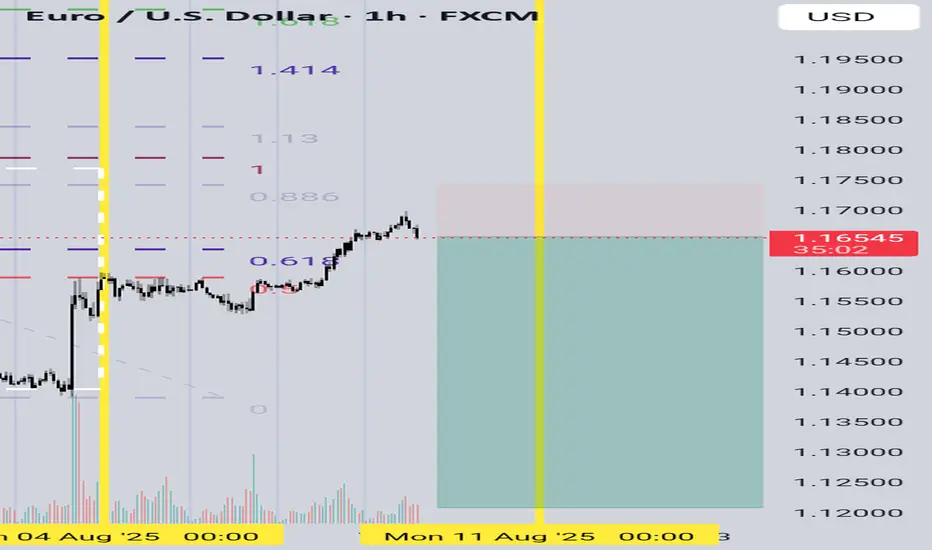
EURUSD | Eyes on the 50EMA — One Bold Candle and I’m All InThe 1-hour chart has carved a beautiful bullish range from 1.1565 to 1.1696. A little 15-minute pullback tried to test our love, but I’ve got all the signs — the retracement is over, and the ride is calling again.
WHAT TO DO
Just one confident Marubozu closing above the 50EMA, and I’m jumping in — no hesitation, no second thoughts. Let’s ride this story back to the top.
TP1: 1.1696 (where the heart first skipped)
TP2: 1.1716 (where dreams begin)
SL: If that candle speaks loud and clear, my stop loss will be just below it — because love deserves a little risk, but never recklessness.
WHAT IF IT WONT CROSS?
This is day trading setup. While watching 15m candle to bear below 50EMA also I glance 1hr chart. This setup will be valid as long as 1hr chart is still in bearing range.
Wish me luck — this might just be the ride of the day! 💞📈

EURGBP Long ProjectHi guys...😎
It's time to do a Long Project on EURGBP with 3 key reasons:
1. Price Drivers: Daily Demand
2. Trend: up
3. Momentum: bullish
Action: waiting for entry on the intraday timeframe (entry will be published further)


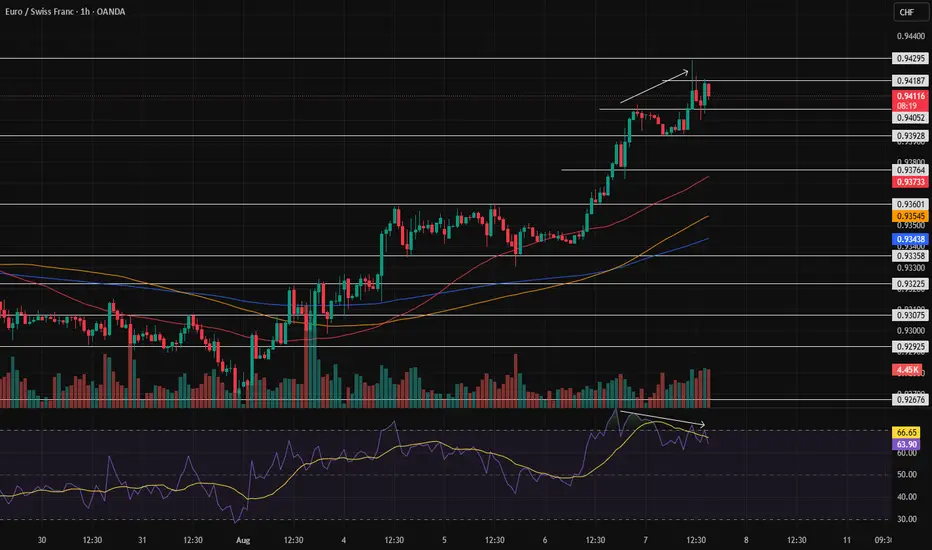
Possibility of correction and rangingThe weakness in the bullish trend and the divergence are giving us signals of a deep correction or price ranging. With these signs, the chances of the price moving higher this week have significantly decreased.
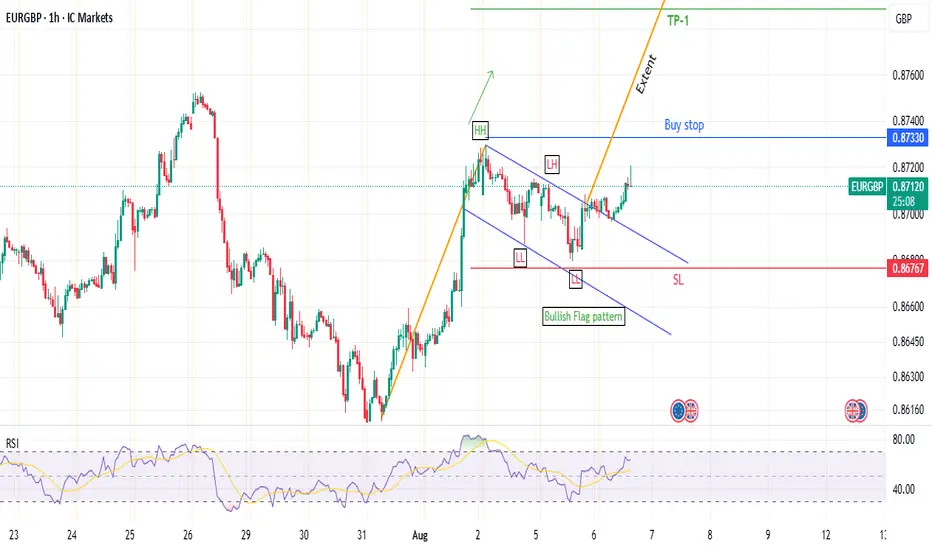
EUR/GBP: Bull Flag Forming for a Potential Breakout?Hey everyone,
Sharing my view on EUR/GBP on the 1-hour chart. I've spotted what looks like a classic Bullish Flag pattern developing after a strong upward surge. This is a continuation pattern, and I'm looking to trade the breakout.
My Game Plan: I'm playing this with a conservative entry, waiting for a clear break of the top of Flag pole. Here are the specific levels for my trade plan:
🎯 Entry (Buy Stop): $0.8733
🛡️ Stop Loss: $0.8677 (A break below here would invalidate the bullish setup for me)
💰 Take Profit 1: $0.8789 (A clean 1:1 Risk/Reward)
🏆 Take Profit 2: $0.8822 (Length of the flag pole)
CADJPYIt will follow till tomorrow midday.
Let´s see.
Blessings.
Check "passiveincomes" at signal start.
thanks

AUD overbought versus CHFBased on currency strengths, the AUD is weaker than the CHF and AUDCHF has reached a significant level. The odds are of a retracement.

Trading EURUSD AUDUSD | Judas Swing Strategy 05/08/2025The Judas Swing strategy kicked off the new week with two solid setups on Monday, this time on OANDA:AUDUSD and FX:EURUSD While both played out beautifully from a structure and liquidity perspective, let’s walk through the reasoning behind each trade and how they unfolded
The first setup of the day formed on EURUSD during the early part of the New York session. Price had been ranging during the London hours, setting clear highs and lows. Just as expected, NY brought the liquidity sweep a sharp push above the range high, baiting breakout buyers and triggering stops.
That was our cue. Once the sweep completed, we watched closely for the break of structure to confirm the reversal. It came swiftly, followed by a retrace into the freshly formed Fair Value Gap the same confluence we wait for every time.
As price tapped into the imbalance and printed a bearish close, we executed the short. Risk: 1%. Target: 2R. Price moved cleanly in our direction, offering little drawdown and ultimately hitting our target in due time. A disciplined start to the week with a solid +2% gain.
Not long after we entered the FX:EURUSD position, OANDA:AUDUSD served up a nearly identical setup. Once again, we had a clear range established during the Judas Swing sessions. Then came the sweep price spiked above the range high, taking out buy-side liquidity before quickly reversing.
We marked our structure break and noted the FVG left behind. Just like before, we waited for the retrace no chasing.
Price pulled back, tapped the imbalance, and gave us a strong bearish entry signal. We entered short with the same parameters: 1% risk, aiming for a 2R return. The market delivered. The trade ran smoothly to target, netting our second +2% win of the day.

NZD/CAD Potential Bullish Move in the makingHi Traders.
1. HTF BUllish Impulse
2. Correction Pattern
3. Falling Wedge Breakout
4. LTF Correction is forming . Wait for the current correction to finish to confirm this setup

ENTRY EURGBPDisclaimer:
This is merely a chart-based analytical trading idea and is not considered investment advice. Please manage your risks carefully and conduct your own research before making any trading decisions.

CHFJPYCHFJPY Sell Plan
SL Entry Tp Partial booking metioned in charts lets print $$$
Key Fundamental Points:
Export Shock Hits Japanese Corporates
FX Pressure Could Weaken the Yen Further — or Bolster It Short-Term
U.S.–Japan trade talks may include FX discussions, but no strong pressure is expected to strengthen the yen. Trump’s tariffs continue to weigh down Japan’s growth and could further tilt downward.

Pound short-term technical signals suggest a potential downtrendWhile the long-term technical outlook for the pound remains bullish, short-term signals point to a potential downtrend. The price may be in the midst of a reversal.
Technical Perspective GBPUSD pulled back and found a dynamic support at the EMA200, which suggests the long-term uptrend is still intact. This is supported by EMAs' bullish signal, although they are converging.
After RSI Bearish Divergence, GBPUSD retreated and has been forming a series of lower swings, indicating a developing bearish trend on a secondary timeframe. A confirmed break and close below both the EMA200 and the 1.3100 support would confirm a long-term trend reversal to a downtrend.
The current rebound is a critical test. If the price fails to break above 1.3600, it would be a bearish signal, suggesting a continuation of the downtrend.
Macroeconomic Perspective
On August 7th meeting, the BoE cut its policy rate by 0.25% to 4.0%, the fifth such reduction since mid-2024. This decision reflects a slowing economy and a weakening labor market.
However, with inflation still above the 3.6% target, the bank's "gradualist" approach has raised concerns among investors about future rate cuts, weighing on the pound in the short term.
The broader UK economy remains fragile, with weak industrial and retail GDP data has yet to show a recovery. Recent labor market data show rising unemployment and decelerating wage growth, further dampening sentiment.
Historically, the pound tends to weaken in August due to seasonal effects. The market is bracing for increased volatility from key economic releases and the possibility of a rate cut from the US central bank in September.
Conclusion
Over the next two weeks, the pound is likely to consolidate sideways or weaken further. This is due to pressure from the Bank of England's dovish stance, the slow recovery of the UK economy, capital inflows into safe-haven assets, and bearish technical signals.
Analysis by: Krisada Yoonaisil, Financial Markets Strategist at Exness

EuRUsD Downtrend continuation after pullback.EURUSD has seen considerable drop after massive gain through the year. Previous weeks downtrend is a clear directional significance for a pullback from all that gain. Looking forward to a continuation down in the following days... Please leave a like.
EURUSD Looks Persuasive To Go LongPrevious Day Closed strongly bullish coming of off a daily imbalance. We will be looking to long during London Open (2:00am - 5:00am). At this time we want to see Asian Session Lows being taken and I will be looking for my entry to taken PDH (Previous Day High).

CADJPY Is Bearish! Sell!
Take a look at our analysis for CADJPY.
Time Frame: 2h
Current Trend: Bearish
Sentiment: Overbought (based on 7-period RSI)
Forecast: Bearish
The market is approaching a key horizontal level 107.345.
Considering the today's price action, probabilities will be high to see a movement to 106.396.
P.S
We determine oversold/overbought condition with RSI indicator.
When it drops below 30 - the market is considered to be oversold.
When it bounces above 70 - the market is considered to be overbought.
Disclosure: I am part of Trade Nation's Influencer program and receive a monthly fee for using their TradingView charts in my analysis.
Like and subscribe and comment my ideas if you enjoy them!

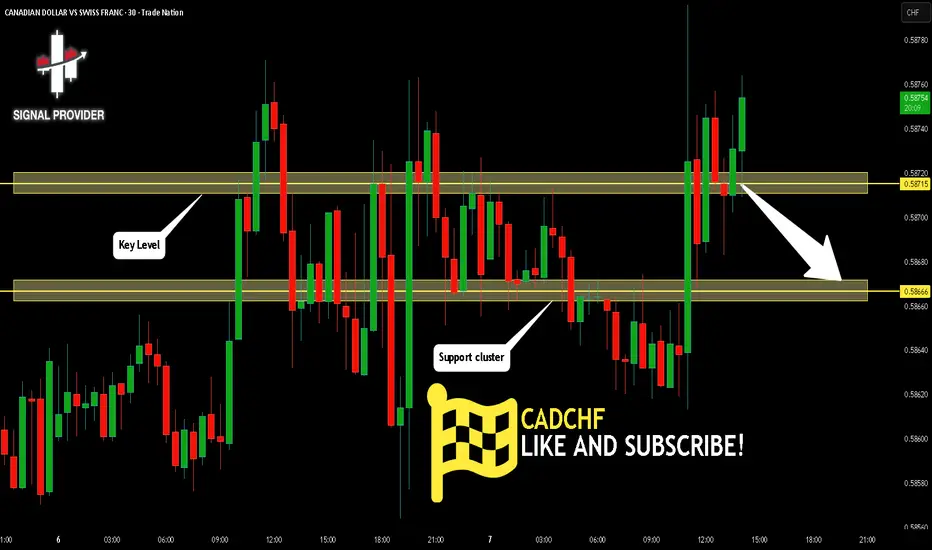
CADCHF Is Very Bearish! Short!
Please, check our technical outlook for CADCHF.
Time Frame: 30m
Current Trend: Bearish
Sentiment: Overbought (based on 7-period RSI)
Forecast: Bearish
The market is approaching a significant resistance area 0.587.
Due to the fact that we see a positive bearish reaction from the underlined area, I strongly believe that sellers will manage to push the price all the way down to 0.586 level.
P.S
Overbought describes a period of time where there has been a significant and consistent upward move in price over a period of time without much pullback.
Disclosure: I am part of Trade Nation's Influencer program and receive a monthly fee for using their TradingView charts in my analysis.
Like and subscribe and comment my ideas if you enjoy them!
CABLE M15Beautiful delivery. Intraday Order Flow. The IR worked in the favour of the trade. Still bullish, will see how it reacts at the next Daily FVG