BREAKOUT SPOTTED ON USDCADI will go with the trend and of course its short the USDCAD..
Tripple top is still valid, followed by strong rejection, and some consolidation and now breakout is coming!
CHEEERRRSSSS...!!!
Forex market

cadchfpotential buy setup. if this give valid confirmation by london session tomoro, this is a good buy

NZD/CAD Daily AnalysisPrice broke out of the descending channel on 26th November this year.
We then saw a correction take place and price is now potentially breaking out for another bullish impulse.
Look for a trade that meets your strategy rules.

GBPJPY Bullish Flag GBPJPY will continue to move higher after a great performance last week. Price has begun printing a bullish flag pattern with price rushing towards the resistance trend line to offer a sell opportunity towards the main move entry

AUDSGD (DAILY INVERSE HEAD AND SHOULDERS POTENTIAL RETEST *4H)(AUDSGD) Is currently properly retesting on the neckline of the inverse head and shoulders but if you look at the 4H when it broke the neckline of the daily inverse it never had a proper retest only on the lower time frames and now it is at a point where it can have the proper retest with an engulfing on the 4H.

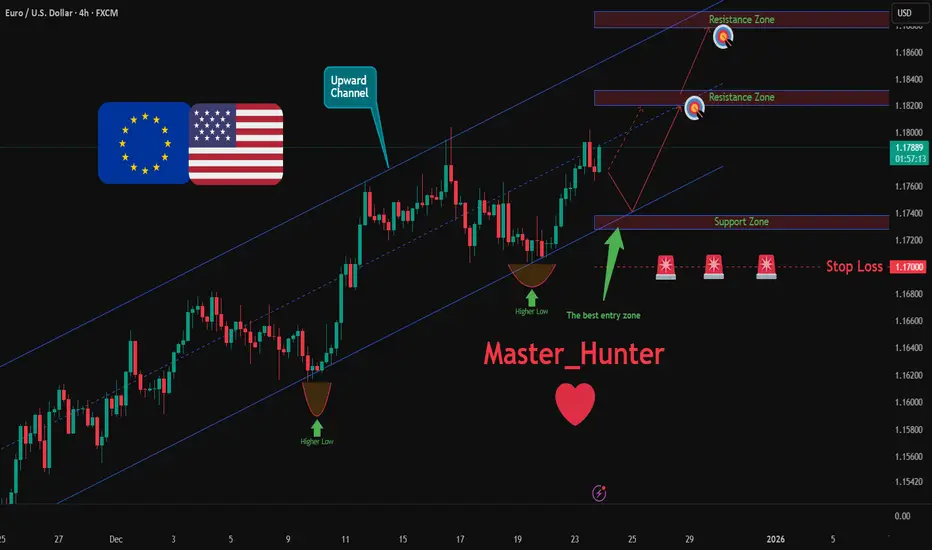
EURUSD: Bullish Push to 1.1878?As the previous analysis worked exactly as predicted, FX:EURUSD is eyeing a bullish breakout on the 4-hour chart , with price rebounding from higher lows in an upward channel after a breakout candle, converging with a potential entry zone that could ignite upside momentum if buyers push through short-term resistance amid recent volatility. This setup suggests a continuation opportunity in the uptrend, targeting higher levels with overall risk-reward exceeding 1:3.5 .🔥
Entry between 1.1728–1.1738 for a long position. Targets at 1.1820 (first), 1.1878 (second). Set a stop loss at a daily close below 1.1700 , yielding a risk-reward ratio of more than 1:3.5 in total . Monitor for confirmation via a bullish candle close above entry with rising volume, leveraging the pair's momentum in the channel.🌟
Fundamentally , EURUSD is trading around 1.178 in late December 2025, with key US Dollar events this week potentially weakening USD if data underperforms, favoring euro strength. For the US Dollar, Tuesday, December 23 at 05:30 AM UTC brings GDP Growth Rate QoQ Q3 (forecast 3.3%, previous 4.3%), Core PCE Prices QoQ Q3 (forecast 2.9%, previous 2.9%), PCE Prices QoQ Q3 (forecast 2.8%, previous 2.8%), and Real Consumer Spending QoQ Q3 (previous 3.5%); followed by CB Consumer Confidence DEC at 07:00 AM UTC (forecast 91, previous 89.1). No major high-impact events for the Euro this week, leaving the pair sensitive to USD catalysts. 💡
📝 Trade Setup
🎯 Entry (Long):
1.1728 – 1.1738
(Entry at these levels is valid with proper risk & capital management.)
🎯 Targets:
• 1.1820 (TP1)
• 1.1878 (TP2)
❌ Stop Loss:
• Daily close below 1.1700
⚖️ Risk-to-Reward:
• > 1:3.5 (total)
💡 Your view?
Does EURUSD defend the channel and push toward 1.1878 — or do we see deeper consolidation before continuation? 👇
SHORT ENTRY OPPORTUNITY IN USDCADThis could be a good short opportunity because the price might drop significantly.

GBPUSD SELL | Day Trading AnalysisYou can expect a reaction in the direction of selling from the specified resistance zone
GBPUSD moving higher as it tests the strong resistance level..
We expect a bearish move from the confluence zone.
Hello Traders, here is the full analysis.
I think we can soon see more fall from this range! GOOD LUCK! Great SELL opportunity GBPUSD
I still did my best and this is the most likely count for me at the moment.
-------------------
Traders, if you liked this idea or if you have your own opinion about it, write in the comments. I will be glad 🤝


BUY STOP EURJPY 184+Buy stop , Eurjpy use proper techniques to manage your trades (50/50+Trial Stop)

GBPUSD 23 Dec 2025Reasons for entering the trade:
1- Daily static resistance
2- Break of the last 15-minute high/low structure
3- The 1H move was bullish above the green Kumo
4- 1H Bermuda Kumo
Entry: 1.34718
TP: 1.33918
SL: 1.34918


Heading towards pullback resistance?USD/JPY is rising towards the resistance level, which is a pullback resistance that aligns with the 61.8% Fibonacci retracement and could reverse from this level to our take profit.
Entry: 156.92
Why we like it:
There is a pullback resistance level that aligns with the 61.8% Fibonacci retracement.
Stop loss: 157.75
Why we like it:
There is a swing high resistance level.
Take profit: 155.93
Why we like it:
There is an overlap support level.
Enjoying your TradingView experience? Review us!
Please be advised that the information presented on TradingView is provided to Vantage (‘Vantage Global Limited’, ‘we’) by a third-party provider (‘Everest Fortune Group’). Please be reminded that you are solely responsible for the trading decisions on your account. There is a very high degree of risk involved in trading. Any information and/or content is intended entirely for research, educational and informational purposes only and does not constitute investment or consultation advice or investment strategy. The information is not tailored to the investment needs of any specific person and therefore does not involve a consideration of any of the investment objectives, financial situation or needs of any viewer that may receive it. Kindly also note that past performance is not a reliable indicator of future results. Actual results may differ materially from those anticipated in forward-looking or past performance statements. We assume no liability as to the accuracy or completeness of any of the information and/or content provided herein and the Company cannot be held responsible for any omission, mistake nor for any loss or damage including without limitation to any loss of profit which may arise from reliance on any information supplied by Everest Fortune Group.

Bullish reversal setup?USD/CHF has bounced off the support level which is a pullback support that is slightly above the 78.6% Fibonacci projections and could rise from this level to our take profit.
Entry: 0.7873
Why we like it:
There is a pullback support level, which is slightly above the 78.6% Fibonacci projection.
Stop loss: 0.7831
Why we like it:
There is a support level at the 100% Fibonacci projection.
Take profit: 0.7935
Why we like it:
There is a pullback resistance level.
Enjoying your TradingView experience? Review us!
Please be advised that the information presented on TradingView is provided to Vantage (‘Vantage Global Limited’, ‘we’) by a third-party provider (‘Everest Fortune Group’). Please be reminded that you are solely responsible for the trading decisions on your account. There is a very high degree of risk involved in trading. Any information and/or content is intended entirely for research, educational and informational purposes only and does not constitute investment or consultation advice or investment strategy. The information is not tailored to the investment needs of any specific person and therefore does not involve a consideration of any of the investment objectives, financial situation or needs of any viewer that may receive it. Kindly also note that past performance is not a reliable indicator of future results. Actual results may differ materially from those anticipated in forward-looking or past performance statements. We assume no liability as to the accuracy or completeness of any of the information and/or content provided herein and the Company cannot be held responsible for any omission, mistake nor for any loss or damage including without limitation to any loss of profit which may arise from reliance on any information supplied by Everest Fortune Group.


sell eurousd toward 4h fvgi think in long term,we have a buy apportunity but first we can sell it as i show u.good luck

EUR USD after attaining TP we can witness a good selling pressure.
HOW MANY OF U HAVE BOOKED PROFIT??
how many have followed the trend line
need your comments

Bullish bounce off pullback support?GBP/USD is falling towards the support level, which is a pullback support that is slightly below the 50% Fibonacci retracement and could bounce from this level to our take profit.
Entry: 1.3427
Why we like it:
There is a pullback support level that is slightly below the 50% Fibonacci retracement.
Stop loss: 1.3386
Why we like it:
There is a pullback support that aligns with the 78.6% Fibonacci retracement.
Take profit: 1.3517
Why we like it:
There is a pullback resistance.
Enjoying your TradingView experience? Review us!
Please be advised that the information presented on TradingView is provided to Vantage (‘Vantage Global Limited’, ‘we’) by a third-party provider (‘Everest Fortune Group’). Please be reminded that you are solely responsible for the trading decisions on your account. There is a very high degree of risk involved in trading. Any information and/or content is intended entirely for research, educational and informational purposes only and does not constitute investment or consultation advice or investment strategy. The information is not tailored to the investment needs of any specific person and therefore does not involve a consideration of any of the investment objectives, financial situation or needs of any viewer that may receive it. Kindly also note that past performance is not a reliable indicator of future results. Actual results may differ materially from those anticipated in forward-looking or past performance statements. We assume no liability as to the accuracy or completeness of any of the information and/or content provided herein and the Company cannot be held responsible for any omission, mistake nor for any loss or damage including without limitation to any loss of profit which may arise from reliance on any information supplied by Everest Fortune Group.

EURJPY RECAPEURJPY has hit all time highs as expected and predicted and gave us a nice long super buy and new prices 184+ more still to come stay tuned and remember to follow to be able trade with us

Falling towards 50% Fib support?EUR/USD is falling towards the support level, which is an overlap support that aligns with the 50% Fibonacci retracement and could bounce from this level to our take profit.
Entry: 1.1753
Why we like it:
There is an overlap support that aligns with the 50% Fib retracement.
Stop loss: 1.1727
Why we like it:
There is a pullback support lines up with the 78.6% Fib retracement.
Take profit: 1.1799
Why we like it:
There is a multi-swing high resistance.
Enjoying your TradingView experience? Review us!
Please be advised that the information presented on TradingView is provided to Vantage (‘Vantage Global Limited’, ‘we’) by a third-party provider (‘Everest Fortune Group’). Please be reminded that you are solely responsible for the trading decisions on your account. There is a very high degree of risk involved in trading. Any information and/or content is intended entirely for research, educational and informational purposes only and does not constitute investment or consultation advice or investment strategy. The information is not tailored to the investment needs of any specific person and therefore does not involve a consideration of any of the investment objectives, financial situation or needs of any viewer that may receive it. Kindly also note that past performance is not a reliable indicator of future results. Actual results may differ materially from those anticipated in forward-looking or past performance statements. We assume no liability as to the accuracy or completeness of any of the information and/or content provided herein and the Company cannot be held responsible for any omission, mistake nor for any loss or damage including without limitation to any loss of profit which may arise from reliance on any information supplied by Everest Fortune Group.

EUR-JPY Bearish Bias! Sell!
Hello,Traders!
EURJPY is reacting to a well-defined horizontal supply area after a strong impulsive sell-side move. The current bullish pullback appears corrective, likely forming a mitigation into prior supply where smart money may re-enter shorts. Time Frame 1H.
Sell!
Comment and subscribe to help us grow!
Check out other forecasts below too!
Disclosure: I am part of Trade Nation's Influencer program and receive a monthly fee for using their TradingView charts in my analysis.

USDCAD BEARISH BREAKOUT|SHORT|
✅USDCAD delivers a clean bearish displacement below a key supply zone, confirming a structural break in favor of sell-side continuation. Price is now trading in discount after a decisive breakout, with weak bullish response suggesting further draw toward lower liquidity pools and imbalance below. Time Frame 12H.
SHORT🔥
✅Like and subscribe to never miss a new idea!✅

AUD/USD Looking bullish from key support area 📈 AUDUSD – Bullish Setup (1H Timeframe) 🇦🇺🇺🇸
AUDUSD is showing bullish momentum on the 1-hour timeframe.
Price is holding above a key support zone at 0.65900, indicating potential continuation to the upside.
🔹 Key Support: 0.65900
🎯 Technical Targets:
• 0.66300
• 0.66500
📊 As long as price respects the support area, bullish bias remains valid.
⚠️ Risk Management is key — always manage your lot size and use proper stop-loss levels.
👍 Like | 👣 Follow | 💬 Comment | 🔁 Share
🚀 Trade smart, trade safe!
