EURCAD | Eyes on the 50EMA — One Bold Candle and I’m All In💌 Still in Love with the Trend — Just Waiting for My Candle to Say “Yes”
1-hour chart has already whispered sweet nothings — a clean buy range has formed, and we’ve just dipped into a lovely little retracement. But guess what?
All my signals say the pullback is over — and it’s almost time to get back on this romantic ride! 😍
💘 WHAT TO DO NOW
✨Entry : I’m waiting for one bold Marubozu candle to confidently close above my 50EMA — no hesitation. Once that happens, I’m jumping in like it’s the last dance of the night. 💃🕺
🛡️Stop Loss:
If the candle is strong and healthy — like a partner I can trust — I’ll place my SL just below it.
If not, I’ll let it go… there’s always another setup waiting with love. ❤️
TP: 1.5985
❓WHAT IF PRICE REFUSES TO COMMIT?
No worries — this is a day trading love story.
While I keep an eye on the 15m chart flirting with the 50EMA, I’ll also glance at the 1-hour to make sure the romantic spark (a.k.a. bullish range) is still alive.
As long as the 1H trend is holding strong, this setup is still valid. 💍
Wish me luck… and may the markets fall in love with me today! 📈💕
Forex market

USDCHF resistance at 0.8130The USD/CHF pair is currently trading with a bearish bias, aligned with the broader downward trend. Recent price action shows a retest of the falling resistance, suggesting a temporary relief rally within the downtrend.
Key resistance is located at 0.8130, a prior consolidation zone. This level will be critical in determining the next directional move.
A bearish rejection from 0.8130 could confirm the resumption of the downtrend, targeting the next support levels at 0.7970, followed by 0.7930 and 0.7900 over a longer timeframe.
Conversely, a decisive breakout and daily close above 0.8130 would invalidate the current bearish setup, shifting sentiment to bullish and potentially triggering a move towards 0.8160, then 0.8200.
Conclusion:
The short-term outlook remains bearish unless the pair breaks and holds above 0.8045. Traders should watch for price action signals around this key level to confirm direction. A rejection favours fresh downside continuation, while a breakout signals a potential trend reversal or deeper correction.
This communication is for informational purposes only and should not be viewed as any form of recommendation as to a particular course of action or as investment advice. It is not intended as an offer or solicitation for the purchase or sale of any financial instrument or as an official confirmation of any transaction. Opinions, estimates and assumptions expressed herein are made as of the date of this communication and are subject to change without notice. This communication has been prepared based upon information, including market prices, data and other information, believed to be reliable; however, Trade Nation does not warrant its completeness or accuracy. All market prices and market data contained in or attached to this communication are indicative and subject to change without notice.

USDCAD support at 1.3730The USDCAD remains in a bullish trend, with recent price action showing signs of a corrective pullback within the broader uptrend.
Support Zone: 1.3730 – a key level from previous consolidation. Price is currently testing or approaching this level.
A bullish rebound from 1.3730 would confirm ongoing upside momentum, with potential targets at:
1.3830 – initial resistance
1.3860 – psychological and structural level
1.3890 – extended resistance on the longer-term chart
Bearish Scenario:
A confirmed break and daily close below 1.3730 would weaken the bullish outlook and suggest deeper downside risk toward:
1.3716 – minor support
1.3690 – stronger support and potential demand zone
Outlook:
Bullish bias remains intact while the WTI Crude holds above 1.3730. A sustained break below this level could shift momentum to the downside in the short term.
This communication is for informational purposes only and should not be viewed as any form of recommendation as to a particular course of action or as investment advice. It is not intended as an offer or solicitation for the purchase or sale of any financial instrument or as an official confirmation of any transaction. Opinions, estimates and assumptions expressed herein are made as of the date of this communication and are subject to change without notice. This communication has been prepared based upon information, including market prices, data and other information, believed to be reliable; however, Trade Nation does not warrant its completeness or accuracy. All market prices and market data contained in or attached to this communication are indicative and subject to change without notice.

USDCAD (sell)USDCAD has broken a previous bullish trendline (green line) and started to fall.
My entry idea is to wait for a pullback and a bounce of the 61% fib level before heading back down to the previous low.
for added confluence you can wait for an overbought level on the stochastic oscillator indicator once it reaches the 61% fib level

NZDUSD LONG 6-8-2025zxy : bullish
dxy : bearish
trend : bearish
divergence : bullish
continuation : n/a
reversal : bullish divergence
failed to break lat ll
sentiments : neutral 84 % long


USDCAD SELL OPPORTUNITY Price just formed and broke the symmetrical triangle pattern which is a sign of bearish continuation from the pullback resistance of 1.38550 therefore, a sell opportunity is envisaged from the current market price. Target price is 1.36918

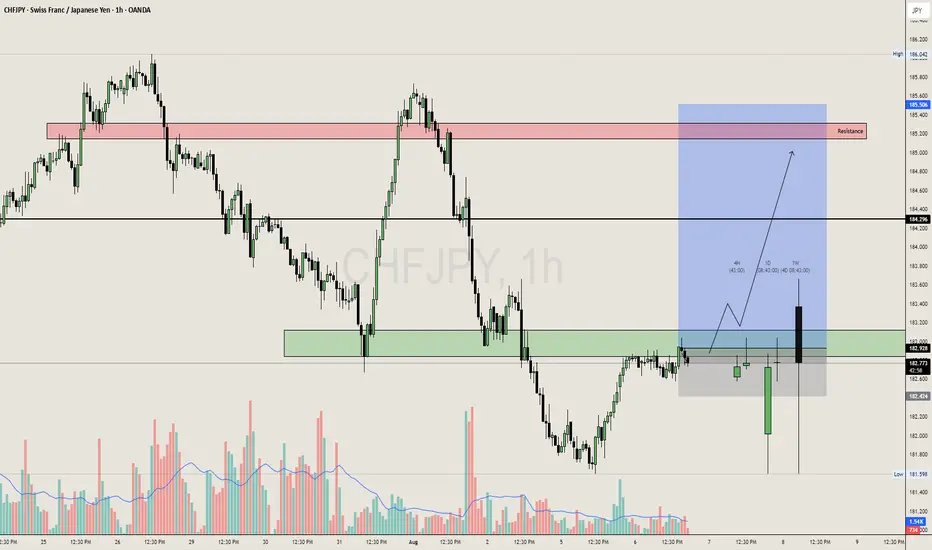
CHFJPY is about to break!!After a fall in CHFJPY, it holding at retest zone which is not a good sign for sellers, if the breakout was for real then it should have give the move downside but the consolidation saying it inviting the sellers and could potentially break upside after sweeping the liquidity of buyers.
AUD/USD Long SetupMarket structure just flipped bullish after sweeping liquidity around the 0.64200 zone.
Entry triggered on bullish break & retest, aiming for 0.65290.
SL well-protected below recent low.
🧠 Smart money move or trap?
Let the market prove you right, not your emotions.
No PAIN | no GAIN. Let the market DECIDE.

EURUSD: Bearish Continuation & Short Trade
EURUSD
- Classic bearish formation
- Our team expects pullback
SUGGESTED TRADE:
Swing Trade
Short EURUSD
Entry - 1.1603
Sl - 1.1617
Tp - 1.1575
Our Risk - 1%
Start protection of your profits from lower levels
Disclosure: I am part of Trade Nation's Influencer program and receive a monthly fee for using their TradingView charts in my analysis.
❤️ Please, support our work with like & comment! ❤️

NZD/CAD SENDS CLEAR BEARISH SIGNALS|SHORT
NZD/CAD SIGNAL
Trade Direction: short
Entry Level: 0.815
Target Level: 0.811
Stop Loss: 0.819
RISK PROFILE
Risk level: medium
Suggested risk: 1%
Timeframe: 4h
Disclosure: I am part of Trade Nation's Influencer program and receive a monthly fee for using their TradingView charts in my analysis.
✅LIKE AND COMMENT MY IDEAS✅

AUD/CAD BEARS ARE GAINING STRENGTH|SHORT
Hello, Friends!
AUD/CAD pair is trading in a local uptrend which we know by looking at the previous 1W candle which is green. On the 6H timeframe the pair is going up too. The pair is overbought because the price is close to the upper band of the BB indicator. So we are looking to sell the pair with the upper BB line acting as resistance. The next target is 0.891 area.
Disclosure: I am part of Trade Nation's Influencer program and receive a monthly fee for using their TradingView charts in my analysis.
✅LIKE AND COMMENT MY IDEAS✅

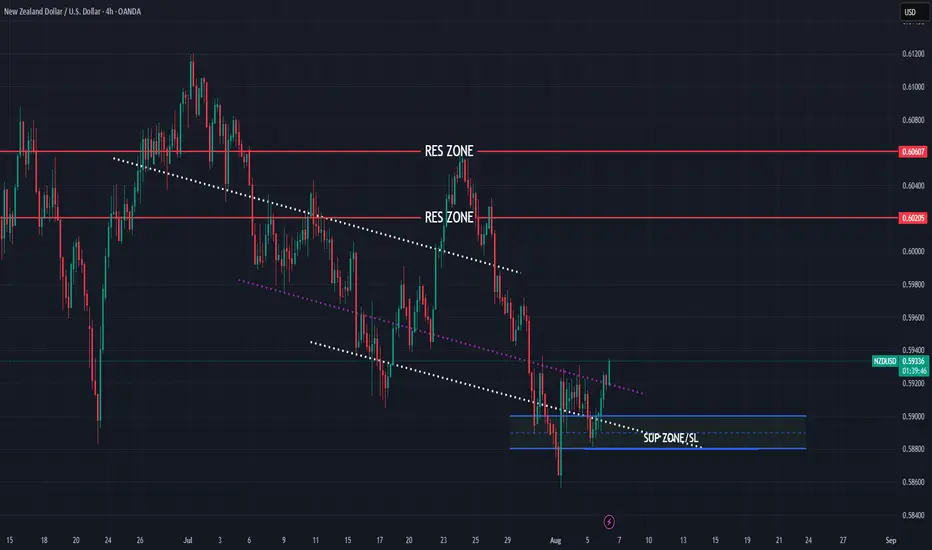
NZDUSD bullish view for this week
OANDA:NZDUSD structure based analysis, price in PA bouncing on bottom line, here bullish expectations for this week.
SUP zone: 0.59000
RES zone: 0.60200, 0.60600
NZDUSD MOVE UP HIGHER TO 0.600looking at NZDUSD on the 4H timeframe.
Price bounced from a green demand/support zone around 0.59140.
There’s an RSI bullish divergence (price was going sideways/down, but RSI was going up)
Strong support zone at 0.59140
The green zone is a clear demand zone or support, where price previously reacted strongly.
Price came back to retest it and bounced — this is classic behavior (liquidity grab → reversal).
RSI is now above 50
Current RSI is about 55.89 and climbing.
That tells you bullish momentum is taking control.
RSI moving above 50 confirms that the pullback is likely over, and buyers are stepping in.
WHAT DO YOU THINK ABOUT THIS IDEA?

GJ SELLS 11:30AM - UTC+1There could be a bearish pinbar on the 15miute, breaking back into bearish structure.
Only posting this early to see who sees this.
Will not enter shorts unless the 15min englufs bearish at 11:30

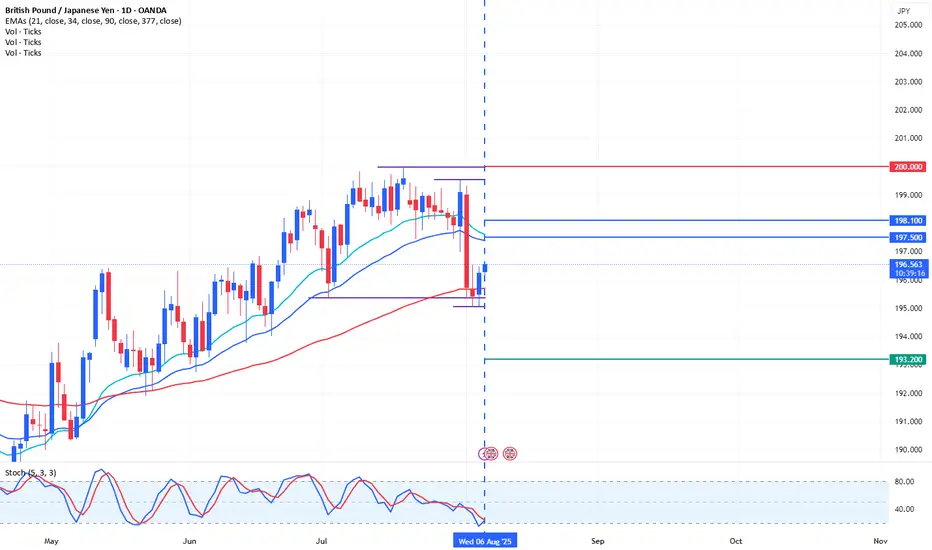
Trading Ideas GBPJPY 1D [Disc On]Fundamental Analysis:
The Fed Interest Rate: 4.50% (in line with expectation)
Bank of England Interest Rate: (release date August 7, 2025)
Note:
idk how to explain but all information is in that chart :v

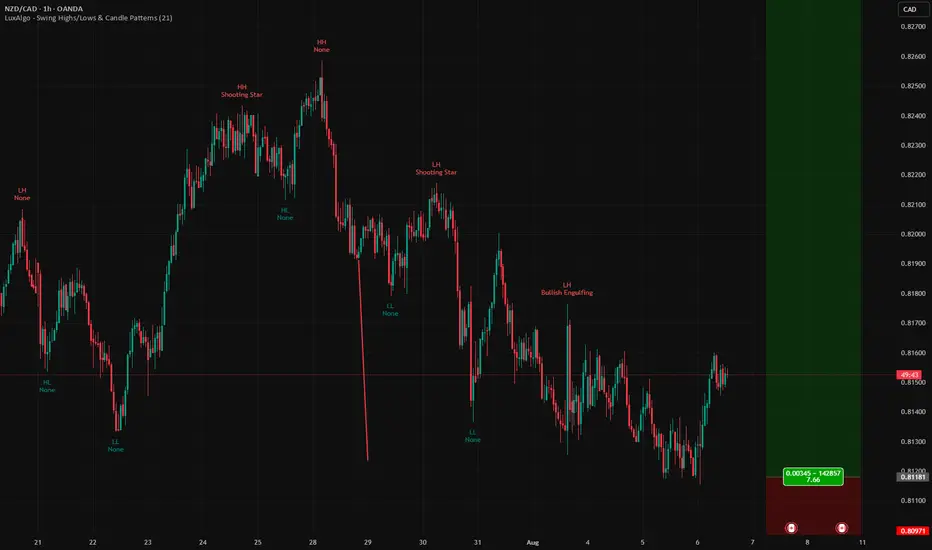
NZDCAD – Range Play with a Bullish Twist NZDCAD – Range Play with a Bullish Twist 🎯
Some trades aren't about chasing breakouts — they’re about precision timing. NZDCAD is stuck in a clear range, but the opportunity is at the bottom. Price is sitting right at demand, momentum is starting to turn up, and fundamentals give the bulls a reason to step in. This could be a quiet accumulation before the move.
📈 I’m bullish on NZDCAD — looking to buy at the bottom of the range.
Here’s why this setup has potential:
Strong demand zone holding price 📍
Range structure gives defined risk/reward 🎯
Bullish momentum building from oversold levels 🔄
CAD sentiment is soft amid trade concerns 📉
NZ fundamentals improving despite mixed sentiment ✅
New Zealand’s economy is slowly rebuilding momentum. Business confidence just hit an 11-year high, inflation is crawling back into target, and while the RBNZ has paused, the outlook isn’t overly dovish. Yes, further cuts are possible, but the currency has shown resilience — holding above 0.60 even in choppy conditions.
On the other side, CAD is vulnerable. Canada's GDP dipped in April and May, and while jobs data was solid in June, oil prices and trade tariffs continue to cloud the outlook. Speculators have ramped up short bets on the CAD, and that bearish tone might keep a lid on any strength — especially if US tariffs remain in play.
This is a classic buy-low setup. We’re at support, structure is intact, and both technical and macro factors are aligned.
Would you take this range buy — or wait for a breakout? Let’s compare notes.
seems a bearish trend for CHFJPYlooks like a textbook thing after a decent bullish rally distribution phase comes and at that point bearish divergence can be seen on daily tf after breaking the distribution box price made LL and now it having pullback for its LH

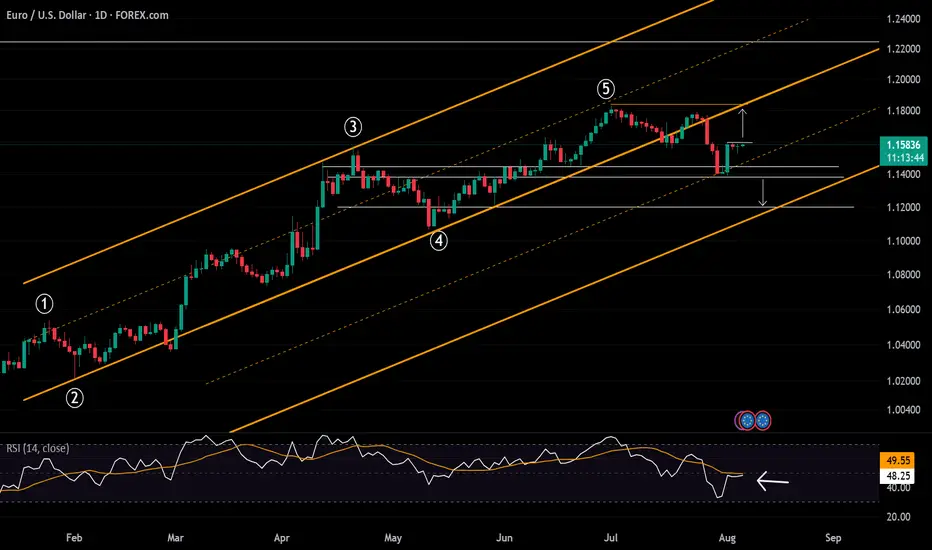
EURUSD Holds Range on Tariff and Fed UncertaintyIn line with the DXY’s pullback below 98, the EURUSD jumped near the 1.16 resistance, the 50% Fibonacci retracement of the 3-legged correction from the 2025 peak, where it is facing another drop-down risk for another 3 legs down should the trend not confirm a clean close above 1.16. My scenarios are the following:
Bearish Scenario: a clean hold below 1.1450 can extend losses back towards 1.1380 where it can hold the trend or make way for a deeper drop towards 1.12.
Bullish Scenario: a clean hold above 1.16 may extend gains back in the direction of 2025 peaks near 1.1680 and 1.1770 before extending new 2025 records.
- Razan HiLal, CMT
The Day AheadChatGPT said:
Market Summary – Wednesday, August 6
Key Data Releases:
UK July Construction PMI and Eurozone July Construction PMI provide fresh insight into construction sector momentum amid rate cut hopes.
Germany June Factory Orders and Italy June Industrial Production offer signals on European industrial resilience.
France Q2 Private Payrolls and Eurozone June Retail Sales help gauge consumer and labor market strength.
Japan June Labor Cash Earnings may influence BoJ expectations on wage-led inflation.
Central Banks:
Fed’s Cook and Collins are scheduled to speak—investors will listen closely for clues on the Fed’s policy stance amid rising speculation of a rate cut.
Corporate Earnings:
Heavy day for earnings across sectors:
Tech & Consumer Platforms: Shopify, Airbnb, Duolingo, Lyft, DoorDash, Uber
Media & Entertainment: Walt Disney, DraftKings
Pharma & Healthcare: Novo Nordisk, Bayer, Generali
Energy: Siemens Energy, Occidental Petroleum, Energy Transfer, NRG Energy
Financials: Thomson Reuters, Commerzbank, Carlyle, Global Payments, Vonovia
Industrials & Materials: CRH, Emerson Electric, Rockwell Automation, Glencore, Honda Motor
Cybersecurity & Tech: Fortinet, AppLovin
Auctions:
The US 10-year Treasury auction will be closely watched for demand signals, especially as bond markets weigh the timing of potential rate cuts.
Conclusion:
A data-rich and earnings-heavy day with cross-sector insights, particularly in consumer trends, industrial health, and energy outlooks. Markets may remain sensitive to Fed commentary and the 10-year auction, as macro and monetary signals converge.
This communication is for informational purposes only and should not be viewed as any form of recommendation as to a particular course of action or as investment advice. It is not intended as an offer or solicitation for the purchase or sale of any financial instrument or as an official confirmation of any transaction. Opinions, estimates and assumptions expressed herein are made as of the date of this communication and are subject to change without notice. This communication has been prepared based upon information, including market prices, data and other information, believed to be reliable; however, Trade Nation does not warrant its completeness or accuracy. All market prices and market data contained in or attached to this communication are indicative and subject to change without notice.

EURJPY LONG After seeing price reject 170.000 monthly area of institutional support we saw a sharp push to the upside on the weekly timeframe from last week and we could see the market push to the upside not that the 4hr broke area of structure resistance

GBPUSD SELL IDEA After seeing the daily timeframe reject the moving average in addition to resistance at1.33125 and also a break of 4hr structure support and also trendline area of support, we could be expecting a push into new lows.
