NZDUSD Short ProjectHi guys...😎
It's time to do a Short Project on NZDUSD with 3 key reasons:
1. Price Drivers: institutional shorting
2. Trend: down
3. Momentum: bearish
Action: waiting for entry on the intraday timeframe (entry will be published further)
Forex market
USD/MXN: The Mexican Peso Starts a New Bullish Bias During the latest trading session, the Mexican peso has started to appreciate by nearly 1%, supported by short-term weakness in the U.S. dollar. For now, bearish pressure has begun to dominate the pair, mainly because the dollar is under pressure following signs that the Federal Reserve may consider cutting interest rates after the slowdown in U.S. job growth. The renewed weakness in the U.S. dollar has allowed the Mexican peso to steadily gain ground, and as this dynamic continues, selling pressure may become increasingly relevant in the short term.
Sideways Range Holds:
Recent price fluctuations over the past few weeks have begun to form a steady sideways range, with resistance near the 19.00 pesos per dollar level and support around 18.50 pesos per dollar. So far, recent moves have been insufficient to break out of this lateral formation, which remains the most relevant pattern to monitor for upcoming sessions. As long as price continues to fluctuate within this range, the lack of clear direction may dominate the market in the coming days.
RSI:
The RSI indicator line continues to hover near the 50 level, signaling that neutral momentum between buying and selling pressure is prevailing in the short term. As long as this behavior persists, indecision may continue to dominate price action.
MACD:
The MACD histogram has also started to slowly descend toward the zero line, suggesting that a new bearish slope may be forming. This points to weakening momentum between the moving averages. If the MACD continues to show signs of losing strength, sideways consolidation could remain the dominant structure.
Key Levels to Watch:
19.35 pesos per dollar: Key resistance aligned with the 50-period moving average. Sustained buying above this level could trigger a meaningful bullish trend in upcoming sessions.
19.00 pesos per dollar: Nearby resistance that marks the top of the short-term sideways channel. A breakout above this psychological level could reinforce bullish momentum.
18.50 pesos per dollar: Critical support marking recent multi-week lows. A break below this level could resume the broader bearish trend seen in previous weeks.
Written by Julian Pineda, CFA – Market Analyst

Daily Updates 8/6/25 UCHF Hello Traders! A new leg is start going sooner or later. Right now I want to stalk longs based on what I am seeing. There is still room for UCHF to sell back into that BISI. Safe Trading.

GBPNZD--LONG---looking at multi-timeframe, monthly,weekly,daily bullish.
--Entry around:2.249, Tp is around 2.268

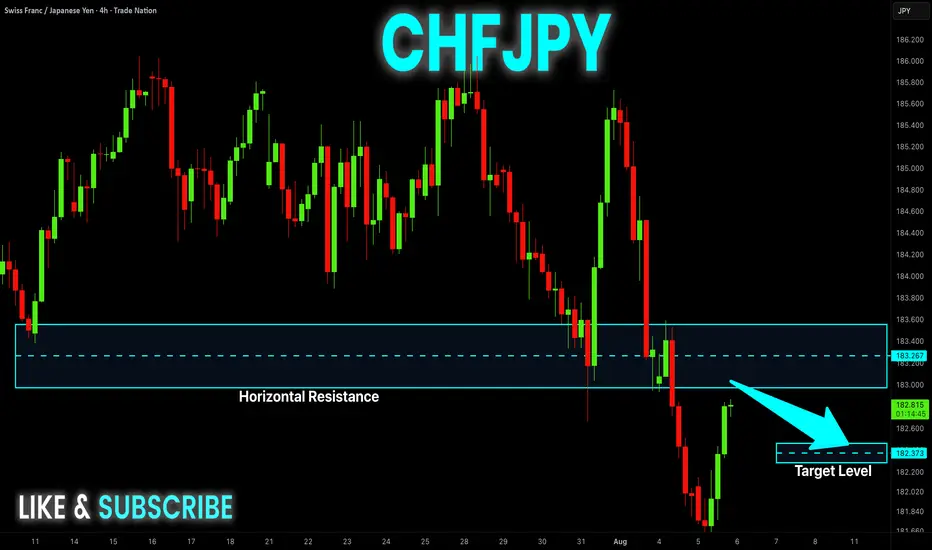
CHF-JPY Potential Short! Sell!
Hello,Traders!
CHF-JPY is making a rebound
But we are bearish biased
And after the pair hits the
Horizontal resistance of 183.400
We will be expecting a
Local bearish correction
Sell!
Comment and subscribe to help us grow!
Check out other forecasts below too!
Disclosure: I am part of Trade Nation's Influencer program and receive a monthly fee for using their TradingView charts in my analysis.
NZD_JPY LOCAL SHORT|
✅NZD_JPY went up sharply
But a strong resistance level was hit at 87.100
Thus I am expecting a pullback
And a move down towards the target of 86.937
SHORT🔥
✅Like and subscribe to never miss a new idea!✅

Sell USDJPYWe will try to sell USDJPY again. After waiting the whole day for bearish movement, I believe price will finally fall during NY session.

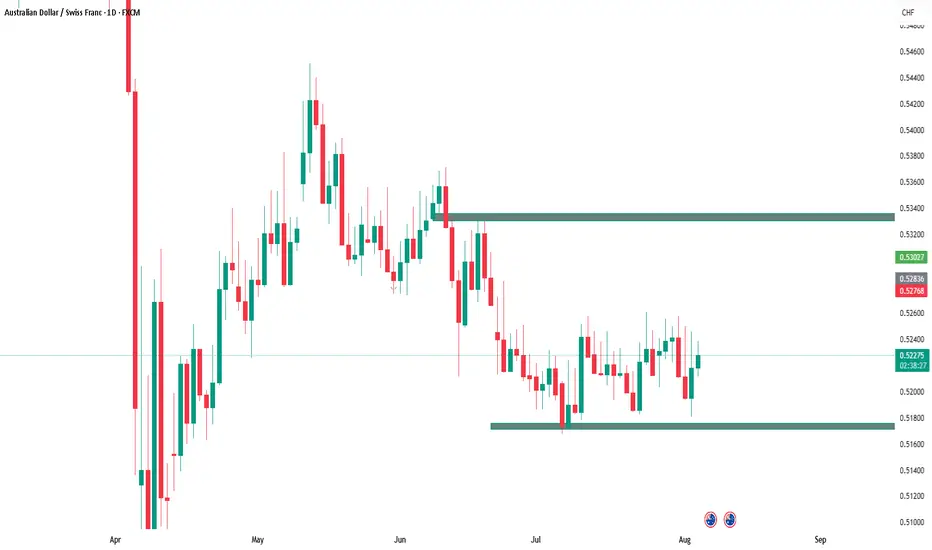
AUDCHFTHE SWING ANALYSIS
Follow for more Simple And accurate swing analysis on Indices, Currency, Commodities.
AUDUSD SWING THE SWING TRADES
Follow for more Simple And accurate swing analysis on Indices, Currency, Commodities.

NZDCHF: Bullish Continuation is Highly Probable! Here is Why:
Remember that we can not, and should not impose our will on the market but rather listen to its whims and make profit by following it. And thus shall be done today on the NZDCHF pair which is likely to be pushed up by the bulls so we will buy!
Disclosure: I am part of Trade Nation's Influencer program and receive a monthly fee for using their TradingView charts in my analysis.
❤️ Please, support our work with like & comment! ❤️

eurusd sell setupnot financial advice . follow at own risk.
possible 8rr at nearest daily swing low...16rr at target line

USD CAD Where Are We Heading DEEP ANALYSIS Hi Trading Fam
So with USD CAD this is what we are seeing:
Bearish:
If we stay under 1.38 then a drop down to the 1.37 range
Bullish:
If we can close above the high at 1.38 then we have levels of 1.3840 , and 1.3980 that could be hit
Trade Smarter Live Better
Kris

CADJPy- Sell NowCADJPy- Sell Now Based on LS , TWS & M1 confirmation on CRT method. Lets hope at least 50% of the target is acheived :) whats are your thoughts. :)


EUR/USD Trading Idea – Key Breakout Levels in FocusNeutral bias with breakout potential
Technical Analysis
EUR/USD is currently trading just below the key resistance zone of 1.1600, consolidating in a tight range.
A break and close above 1.1600 could confirm bullish momentum and open the door toward the next targets at:
-1.1700 (mid-term resistance/imbalance)
-1.1800 (extension target from recent swing low).
On the bearish side, the pair remains capped by the:
-50-day EMA and 200-day EMA, both still above current price
-These moving averages signal potential resistance if the breakout fails and could drag EUR/USD lower toward 1.1200–1.1400 support.
Fundamental Drivers
+Bullish Case for EUR/USD
Dovish Fed outlook after U.S. Non-Farm Payrolls missed expectations (+73K), increasing speculation of a rate cut by September
Political pressure on the Fed and questions around U.S. data credibility are eroding dollar confidence (Reuters, Aug 5)
ECB expected to pause rate hikes, but not cut imminently, with July inflation steady at ~2.0–2.3%
JPMorgan, Goldman Sachs, and MUFG forecast EUR/USD to reach 1.17–1.22 by year-end, with medium-term structural weakness in the USD
Bearish Risk Factors
EMA 50/200 above price suggest momentum is still fragile
Technical rejection at or near 1.1600 could trigger another pullback to 1.1200-1.1400 support
Wells Fargo and SocGen still expect downside risk toward parity (1.00) if U.S. resilience surprises or eurozone growth weakens again
Conclusion
EUR/USD is approaching a decisive moment around the 1.1600 resistance.
A confirmed breakout could realign the pair with institutional upside targets, while failure below the EMAs could drag it back into range or deeper correction.
Watch 1.1600 for clean confirmation.

EUR/USD Chart Breakdown – Explained Like You're 5!📉 Big money doesn't move randomly – it follows patterns. In this short, I break down a real EUR/USD trade setup like a pro trader would explain it to a curious kid.
✅ Watch how institutional players trap retail traders
✅ Learn the psychology behind accumulation & distribution
✅ Find out why the market may drop toward 1.15030
✅ Explained in the simplest, most relatable way!
If you're tired of complicated chart talk — this one’s for YOU.
📍EUR/USD Forex Setup | Day 9 | Smart Money Concept | Price Action
🔔 Follow for daily breakdowns and market psychology

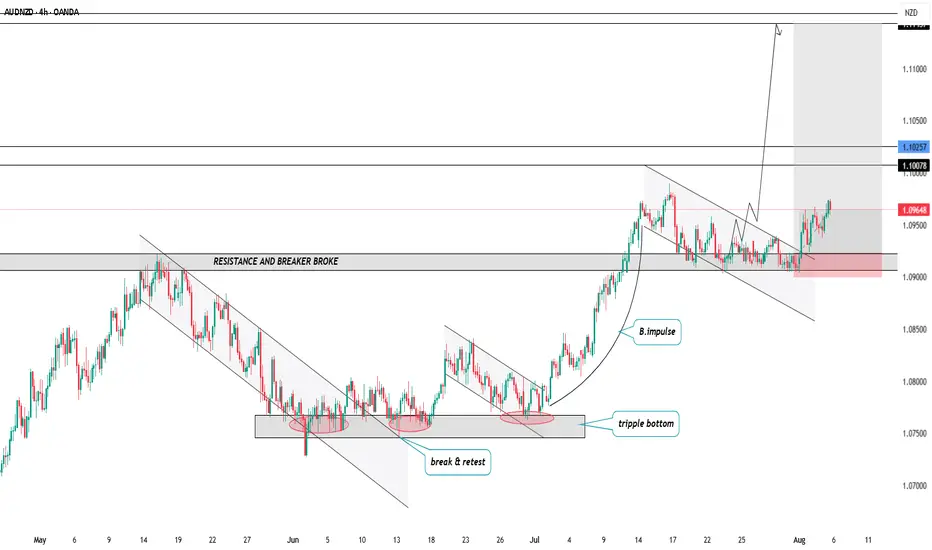
AUDNZDAUDNZD since when i shared last time has managed to move with up to 50 pips , still thee is a very strong bulishing continuation , take time to refine an entry .... and catch this movement
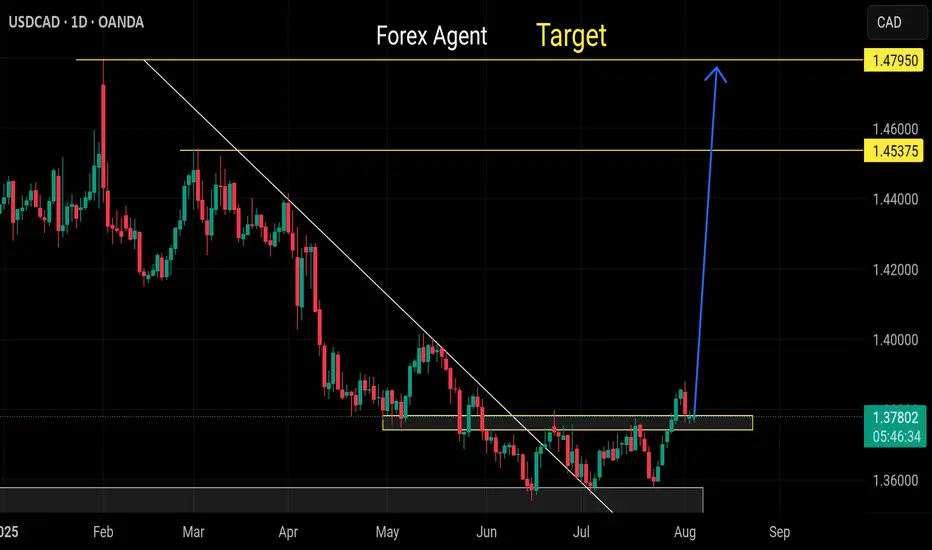
USD Could Gain Further Against CAD Despite Weak Jobs ReportThe weaker-than-expected US jobs report on 1 August, along with significant downward revisions, sent shockwaves through the market, and the US dollar was not spared. The stronger upward momentum observed over the past couple of weeks seemed to vanish almost instantly. Although the USDCAD has recently moved lower, it still maintains strong bullish momentum, indicating a potential move back toward higher levels.
The USDCAD formed a rather convincing triple-bottom pattern in June and even moved above a long-term downtrend. Additionally, the currency pair rose above the neckline of the triple bottom at 1.376, which now serves as a support level. Momentum, as measured by the Relative Strength Index, has turned upward and suggests that the USDCAD could move higher.
To further reinforce the bullish trend, the USDCAD remains above its 10-day exponential moving average. Therefore, while the prevailing market sentiment might lead one to believe the dollar will weaken, technical indicators suggest that the Canadian dollar will continue to weaken against the US dollar if support and the moving average around 1.37 hold. A break below this support area would indicate a trend reversal, potentially causing the USDCAD to fall back to lows around 1.358.
However, if the bullish trend persists and the USDCAD manages to hold above support at 1.37, the currency pair could head higher towards 1.397, retesting a resistance level established in mid-May.
Written by Michael J. Kramer, founder of Mott Capital Management.
Disclaimer: CMC Markets is an execution-only service provider. The material (whether or not it states any opinions) is for general information purposes only and does not take into account your personal circumstances or objectives. Nothing in this material is (or should be considered to be) financial, investment or other advice on which reliance should be placed.
No opinion given in the material constitutes a recommendation by CMC Markets or the author that any particular investment, security, transaction, or investment strategy is suitable for any specific person. The material has not been prepared in accordance with legal requirements designed to promote the independence of investment research. Although we are not specifically prevented from dealing before providing this material, we do not seek to take advantage of the material prior to its dissemination.
Usdcad buy Remain strong bullish
Trend broken
Respecting its support level wait for LTF confirmation the. Straight buy
Sell gbpusd Still remain bearish continuation
Trend buy already broken , lower low also broken
Respecting down trend structure

Cable Completes Harmonic Move Ahead of BoE Rate DecisionThe Bank of England is expected to cut rates by 25 basis points this Thursday, bringing the base rate to 4%. With a likely split vote and uncertainty surrounding Gilt sales, the decision adds more complexity to the UK’s economic outlook.
The Rate Decision
This week’s BoE rate decision is far from straightforward. While the 25 basis point cut is anticipated, the vote will likely be split, making it difficult for the Bank to signal future rate moves. Inflation remains high and the jobs market weakens, leaving the MPC divided on how best to handle stagflation. Speculation is also swirling about the future of active Gilt sales, which could further complicate the BoE’s policy path.
Harmonic Pullback and Key Levels
GBP/USD has been in mean reversion mode after its July surge to two-year highs, and recent price action completed a classic ABCD harmonic pullback pattern. The A-B leg took prices down into June’s swing lows, while the B-C leg saw a brief recovery back towards the June highs. The final C-D leg completed the pattern with a drop to the May swing lows, which have now become a critical support level.
At the May lows, we saw a bullish reversal signal in the form of Friday’s engulfing candle, suggesting a potential bounce. The support here is reinforced by the VWAP anchored to the January lows and the 200-day moving average, both of which align with the harmonic completion point, providing solid technical support for cable.
GBP/USD Daily Candle Chart
Past performance is not a reliable indicator of future results
Range-Bound Action and Short-Term Equilibrium
Looking at the hourly chart, recent price action has formed a tight sideways range, indicating indecision in the market. This range represents equilibrium as traders wait for clarity from the BoE rate decision on Thursday. For short-term traders, the focus will be on watching for a breakout above or below this range, which could trigger the next significant move. A break higher could signal further bullish momentum, while a breakdown could lead to additional downside, depending on the BoE’s announcement.
GBP/USD Hourly Candle Chart
Past performance is not a reliable indicator of future results
Disclaimer: This is for information and learning purposes only. The information provided does not constitute investment advice nor take into account the individual financial circumstances or objectives of any investor. Any information that may be provided relating to past performance is not a reliable indicator of future results or performance. Social media channels are not relevant for UK residents.
Spread bets and CFDs are complex instruments and come with a high risk of losing money rapidly due to leverage. 85.24% of retail investor accounts lose money when trading spread bets and CFDs with this provider. You should consider whether you understand how spread bets and CFDs work and whether you can afford to take the high risk of losing your money.

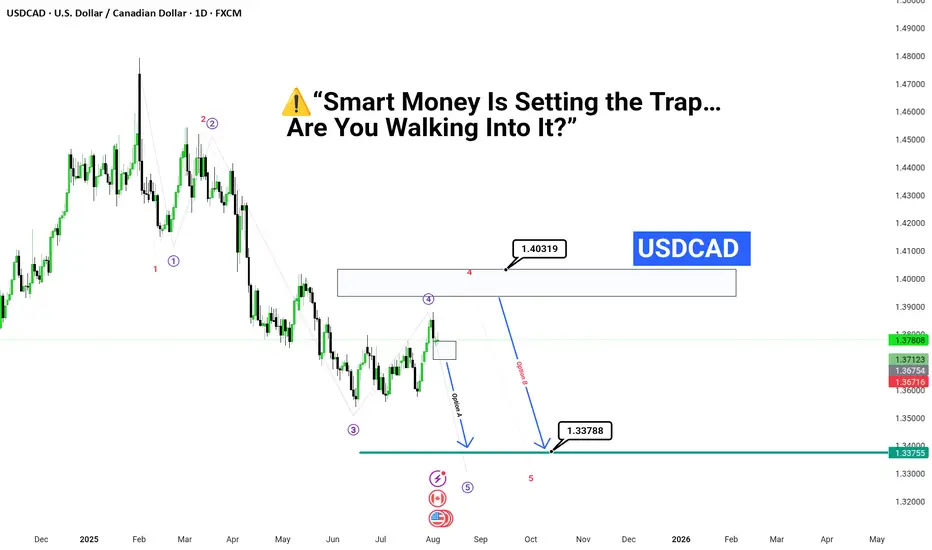
Smart Money Is Setting the Trap… Are You Walking Into It?”“💥USDCAD About to Explode — Final Wave Is Loading.
📉 If You Miss This Entry, You’ll Chase the Exit.
🧠 Wave 5 ≠ Just Another Move
It’s the final shot before the reversal storm.
✅ All signs point to liquidity being hunted
📍Stay sharp. 1.403 may be the bull trap of the year.
🎯 Make no mistake — the market is not random,
it’s engineered to fake you out before the real drop.
---