PRICE BALANCINGAfter that long take of JPY, seller had the bias.
USD is balancing the price in the market as to give the buyer bias over seller making the overall trend bullish where every high is been liquidised.🚀🚀📉📉📈📈
Forex market

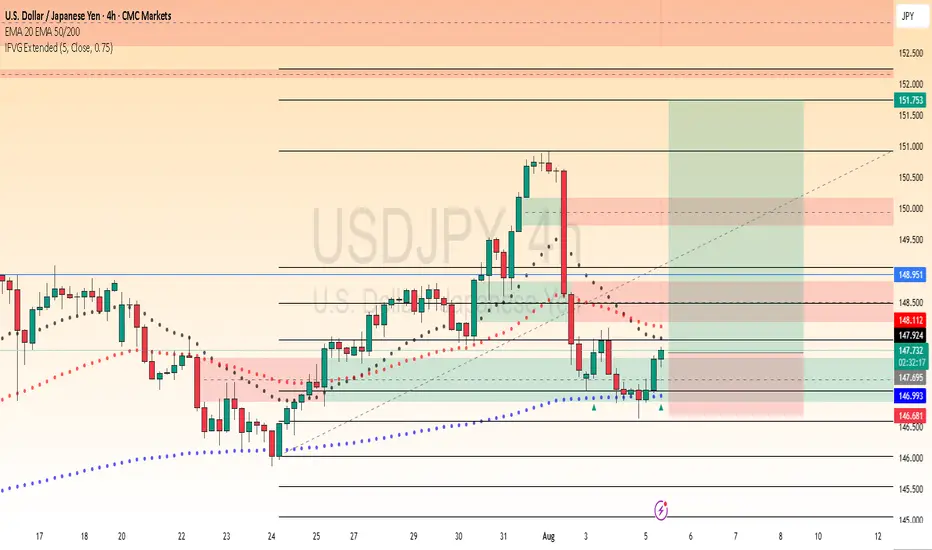
USDJPY Long Setup - Bullish Continuation ExpectedUSD/JPY is presenting a compelling long opportunity after a healthy pullback from recent highs. Multiple technical confluences suggest we're setting up for another leg higher.
Fibonacci Retracement: Price has bounced perfectly from the 0.886 Fibonacci level, showing strong institutional buying interest at this deep retracement level. This is a classic reversal zone that often marks the end of corrective moves.
IFVG (Institutional Fair Value Gap): We've seen a clean bounce from the IFVG below, indicating that institutional orders have been filled and buyers are stepping back in. This gap has acted as strong support.
200 EMA Confluence: The 200 EMA is coming up beautifully on the 4-hour timeframe, providing additional dynamic support. This moving average often acts as a magnet for price and confirms the bullish bias.
Daily Confirmation: We have a strong confirmation candle on the daily timeframe, showing buyers are in control and ready to push higher.
Market Structure Analysis
Price previously broke through strong resistance levels
The recent pullback appears to be a healthy retracement rather than a reversal
Market structure remains bullish with higher lows being formed
Trade Outlook
With these multiple confluences aligning, USD/JPY looks primed for a new leg higher. The combination of Fibonacci support, IFVG bounce, 200 EMA confluence, and daily confirmation creates a high-probability setup for bulls.
Expectation: New highs incoming as buyers regain control and push through previous resistance turned support.
Risk management is key - always use proper position sizing and stop losses.
This is not financial advice. Trade at your own risk.
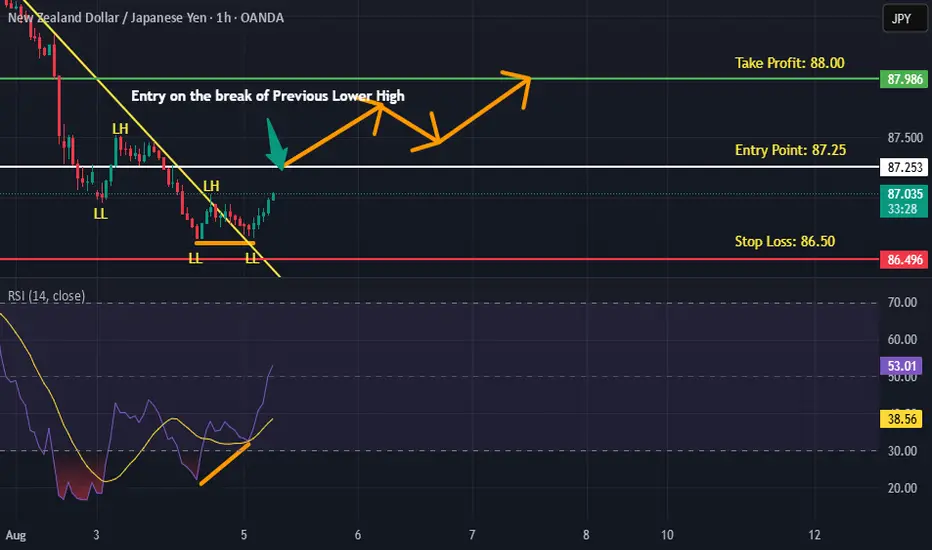
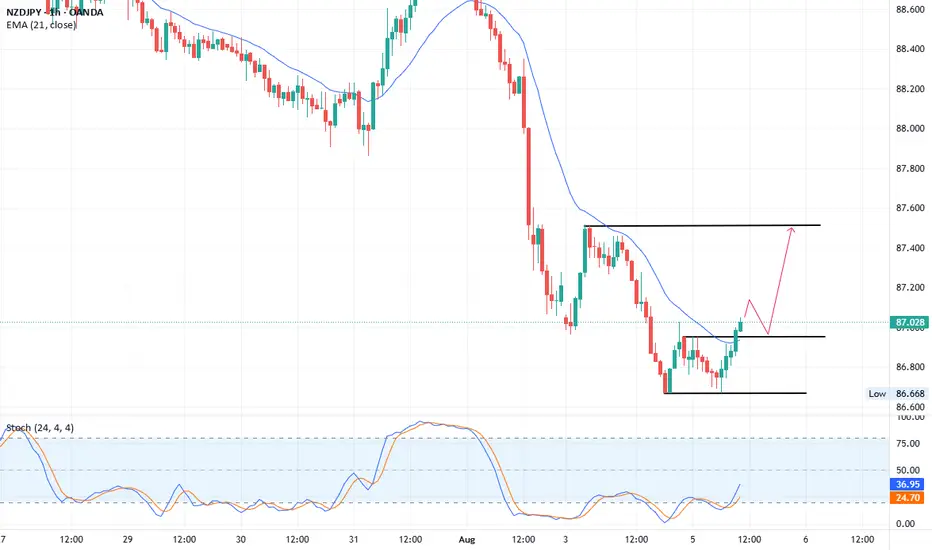
NZDJPY is BullishPrice was in a downtrend on hourly time frame, however the double bottom reversal pattern coupled with bullish RSI divergence and break of descending trendline suggests that bulls are assuming control of the price action. If previous lower high is broken with good volume then a reversal is on the cards as per Dow theory. Targets are mentioned on the chart.
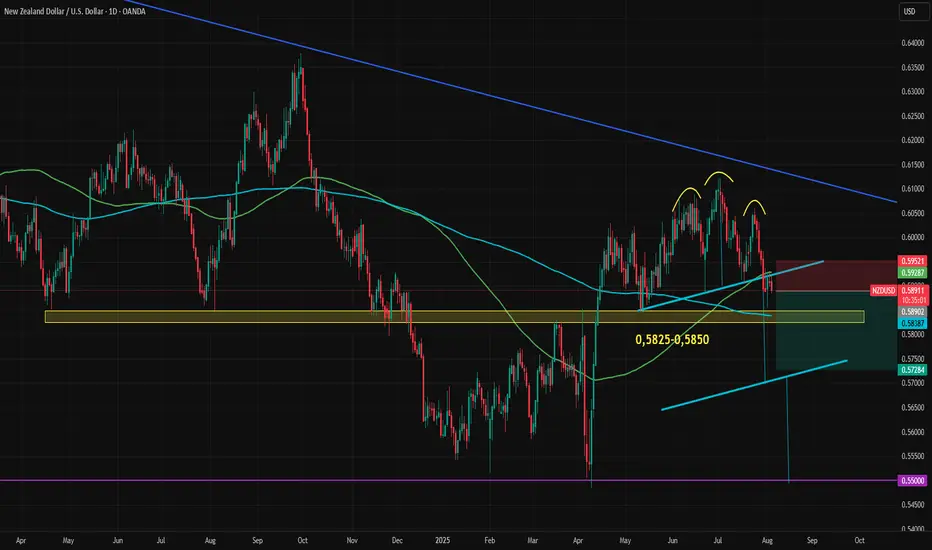
NZDUSD Stuck with Conflicting SignalsNZDUSD is at a key technical junction. The previously broken and retested head and shoulders formation is exerting downward pressure, but the important support zone between 0.5825 and 0.5850 is holding for now. The 100-day and 200-day moving averages have also formed a tight support-resistance range, causing the currency to remain trapped in a narrow range.
Both the Federal Reserve and the Reserve Bank of New Zealand are expected to cut rates twice this year. Growth expectations for 2025 are closely aligned, with only a 0.3-point advantage for the U.S., and the gap is narrowing. Inflation expectations are also similar, with U.S. figures slightly higher, mirroring the GDP trend.
The 2-year bond yield spread between the U.S. and New Zealand has remained flat since April. During that time, NZDUSD climbed from 0.55 to 0.61 before pulling back to the current level near 0.5890.
Similar fundamental statistics and conflicting technical signals have caused NZDUSD to form an uncertain range between 0.5930 on the upside and the 0.5825–0.5850 support zone on the downside. If either of these key levels breaks, volatility may return quickly.
A break above 0.5930, which coincides with both the broken neckline and the 100-day moving average, could push the price toward the descending trendline from the 2021 top (highlighted in blue on the chart). On the other hand, a break below the 0.5825–0.5850 zone which also includes the 200-day moving average, could trigger a move toward the head and shoulders pattern target, currently near 0.57.
The first two weeks of August will be crucial for the dollar index, following the sharp downward revision in payrolls data. Market reaction, revisions to expectations, commentary from Federal Reserve members, and the release of July inflation data will provide greater clarity. This wave of information could finally break NZDUSD out of its current indecisive range.
SELL AFTER THE BULLISH RETRACEMENT ⚙️ Chart Context Overview
Pair: EUR/USD
Timeframe: 4-Hour
Current Price: ~1.1541
Fib Retracement Drawn: From ~1.15981 (swing high) to ~1.13909 (swing low)
---
🔍 Technical Analysis Breakdown
🔴 1. Strong Resistance / Supply Zone (1.17400 – 1.17888)
Price previously rejected from this area, forming a clear swing high.
This zone is tagged as "4Hr Fair Value Gap + Structure Break", indicating institutional selling and market structure shift.
The structure break confirms a bearish order flow.
---
🟧 2. Upper 4H Fair Value Gap (1.16500 – 1.17200 approx.)
Price created imbalance during the drop.
This unfilled FVG suggests a potential retrace to mitigate orders, but currently remains unfilled.
Acts as a supply zone and is unlikely to be revisited soon unless market structure flips bullish.
---
🟨 3. Mid 4H Fair Value Gap (around 1.15497)
Price is currently hovering around this zone.
Aligns with Fib 23.6%, showing weak retracement from the swing low.
Rejection here suggests continuation downward.
---
🟩 4. 1H Fair Value Gap + Fib Cluster Zone (1.15194 – 1.14948)
Aligns with Fib 38.2% & 50% retracement levels.
This confluence of FVG + support is significant:
If price reclaims and holds this zone: potential short-term bounce.
If price breaks this zone: confirms sellers' strength → next leg down.
---
🟦 5. Support Zone (Fib 0.618 – 0.786: 1.14703 – 1.14354)
A strong liquidity pool area.
If price taps into this zone:
Watch for possible bullish reaction (internal liquidity sweep).
If no bounce, expect continuation toward 1.13900 and lower targets.
---
📉 Bearish Bias Justified By:
Break of Market Structure (BOS) from previous highs.
Multiple Fair Value Gaps left unmitigated above – suggests smart money selling on strength.
Current price unable to close above 0.236 Fib retracement, showing weak buyers.
Bearish Fib extension targets:
1.13900 (Fib 1.0) – Likely target.
1.12624 (Fib 1.618) – Bearish extension, possible long-term target.
---
🔑 Key Levels Summary
Level Type Price Zone
🔴 Resistance (Strong Supply) 1.17400 – 1.17888
🟧 4H FVG ~1.16500 – 1.17200
🟨 1H FVG + Support 1.15194 – 1.14948
🟦 Key Support Zone 1.14703 – 1.14354
🔵 Fib Targets 1.13900 / 1.12624
---
📌 Final Outlook
Unless price breaks above 1.1550–1.1600 with strong momentum and volume, EUR/USD is more likely to:
Reject the 1H FVG zone,
Revisit deeper support (1.14300 – 1.13900),
Potentially reach the Fib extension target of 1.12624.

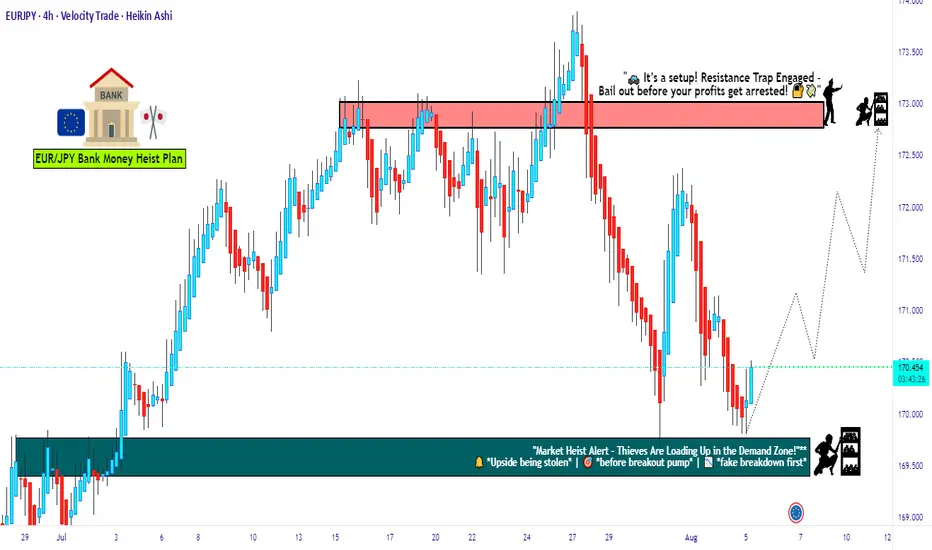
EUR/JPY Setup: Thief Trader's Stealth Bull Run to 173.000🔥💶 EUR/JPY Bullish Heist Plan 💶🔥
🧠 New Plan Unlocked – The EUR/JPY Bullish Mission is LIVE!
Thief Trader style means: No noise, no fluff — just pure sniper precision with layered limit orders. 🧤🔫
This isn’t trading… it’s a planned market robbery 💼💣
🧩 Asset: EUR/JPY
📊 Strategy: Bullish Bias with Stealth Layered Entries (Limit Order Gameplan)
🎯 Target: 173.000 — That’s the vault we’re cracking!
🛑 Stop Loss: 169.100 — Tight security, keep your escape route clean.
📍 Entry: No fixed door — we’re setting traps (limit orders) across key levels. Patience pays thieves.
Watch for pullbacks on lower timeframes: 15m, 30m, or even 1H — strike near support bounces & fakeout wicks. 🐍💥
🔍 Thief Logic:
This ain’t random — price is setting up for a high-stakes move north with JPY weakness fueling the getaway car.
Think smart, layer deep — sniper entries, not shotgun chaos. 🎯🔍
📌 Notes from the Safe House:
Trade with position sizing discipline – the market doesn’t owe you.
News events are motion sensors — avoid them or stay light! 🕵️♂️📉
Use trailing SLs once in profit — secure the bag and vanish. 💼💨
💣 Ready to steal pips, not hope? Hit that 👍, drop a 💬, and join the crew.
This is Thief Trading — we don’t follow markets, we outsmart them. 🧠💵
Stay sharp, stay silent… profit loud. 🐱👤📈💸
🔥 Tap Boost. Support the Heist. Run the Charts. #ThiefTrader 🧤💰
BUY USDCHF 5.8.2025Confluence order: BUY at M15
Type of order: Limit order
Reason:
- The current top is not touching anything, expected to rise to the sub-key of H1 above.
- M15~FIBO 0,5-0,618 (same position)
Note:
- Management of money carefully at the last bottom (0,81005)
Set up entry:
- Entry buy at 0,80878
- SL at 0,80802
- TP1: 0,81005 (~1,5R)
- TP2: 0,81123 (~3R)
- TP3: 0,81299 (~5R)
Trading Method: Price action (No indicator, only trend and candles)

EURCHF oversold bounce backs capped at 0.9364The EURCHF pair is currently trading with a bearish bias, aligned with the broader downward trend. Recent price action shows a retest of the falling resistance, suggesting a temporary relief rally within the downtrend.
Key resistance is located at 0.9364, a prior consolidation zone. This level will be critical in determining the next directional move.
A bearish rejection from 0.9364 could confirm the resumption of the downtrend, targeting the next support levels at 0.9315, followed by 0.9300 and 0.9270 over a longer timeframe.
Conversely, a decisive breakout and daily close above 0.9364 would invalidate the current bearish setup, shifting sentiment to bullish and potentially triggering a move towards 0.9380, then 0.9390.
Conclusion:
The short-term outlook remains bearish unless the pair breaks and holds above 0.9364. Traders should watch for price action signals around this key level to confirm direction. A rejection favours fresh downside continuation, while a breakout signals a potential trend reversal or deeper correction.
This communication is for informational purposes only and should not be viewed as any form of recommendation as to a particular course of action or as investment advice. It is not intended as an offer or solicitation for the purchase or sale of any financial instrument or as an official confirmation of any transaction. Opinions, estimates and assumptions expressed herein are made as of the date of this communication and are subject to change without notice. This communication has been prepared based upon information, including market prices, data and other information, believed to be reliable; however, Trade Nation does not warrant its completeness or accuracy. All market prices and market data contained in or attached to this communication are indicative and subject to change without notice.

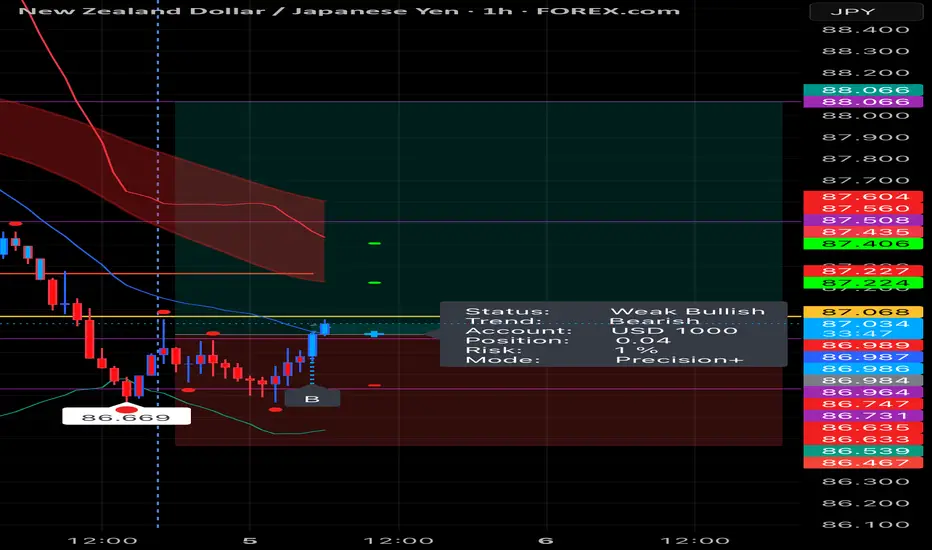
NZDJPY TradeNZDUSD hourly chart double bottom formation confirmed.
Buy above: 86.95
Stop Loss: 86.65
1st TP: 87.30
2nd TP: 87.50
If break 87.50 level then next target 88.00 and 88.30.
EURUSD oversold bounceback supported at 1.1526The EURUSD remains in a bullish trend, with recent price action showing signs of a corrective pullback within the broader uptrend.
Support Zone: 1.1526 – a key level from previous consolidation. Price is currently testing or approaching this level.
A bullish rebound from 1.1526 would confirm ongoing upside momentum, with potential targets at:
1.1714 – initial resistance
1.1810 – psychological and structural level
1.1885 – extended resistance on the longer-term chart
Bearish Scenario:
A confirmed break and daily close below 1.1526 would weaken the bullish outlook and suggest deeper downside risk toward:
1.1470 – minor support
1.1400 – stronger support and potential demand zone
Outlook:
Bullish bias remains intact while the EURUSD holds above 1.1526. A sustained break below this level could shift momentum to the downside in the short term.
This communication is for informational purposes only and should not be viewed as any form of recommendation as to a particular course of action or as investment advice. It is not intended as an offer or solicitation for the purchase or sale of any financial instrument or as an official confirmation of any transaction. Opinions, estimates and assumptions expressed herein are made as of the date of this communication and are subject to change without notice. This communication has been prepared based upon information, including market prices, data and other information, believed to be reliable; however, Trade Nation does not warrant its completeness or accuracy. All market prices and market data contained in or attached to this communication are indicative and subject to change without notice.

EURGBP – Climbing a Hill That Might Give WayEURGBP – Climbing a Hill That Might Give Way ⛰️⚠️
EURGBP is climbing a hill that might soon give way. The pair has been grinding higher, but the move feels tired — and momentum is now wobbling on lower timeframes. This is a sell idea against the crowd: a counterpunch at weekly resistance, with price action flashing warning signs 🚨.
📉 I’m bearish on EURGBP — looking to short this overbought market as momentum stalls.
Here’s what’s fueling the setup:
📍 The weekly chart is at major resistance
💡 Price is overbought and pausing with sell signals on the 4H
📈 EUR’s recent rally is built more on sentiment than substance
🇬🇧 GBP fundamentals remain steady despite a recent dip in sentiment
⚖️ This is a clean counter-trend short with favorable risk-to-reward
Zooming out 🔍
The Eurozone isn’t in great shape. Growth is flat 📉, consumption is weakening 🛒, and the ECB has paused rate cuts 🧊 — not because conditions are improving, but because uncertainty is high. Inflation is drifting below target 🎯, and the Euro’s sharp appreciation (+17% since February 📊) risks damaging exports just as US tariff threats re-emerge 🚧.
On the GBP side 🇬🇧, the UK’s story is steadier. GDP growth is modest, investment is picking up 📈, and the BoE is gradually easing 🧭. More cuts may be coming, but they’re largely priced in 💷. Despite weaker recent sentiment, the Pound still has recovery potential — especially if Eurozone fragilities resurface 🕳️.
✅ Technically and fundamentally, this trade lines up. EURGBP is stretched, softening, and ripe for a short.
🤔 Agree with this fade? Or are you still riding the Euro train 🚂? Let’s debate it.
NZD/USD Analysis Based on Volume, Fibonacci & Stochastic
This NZD/USD setup is developed using:
Volume analysis to highlight market participation zones
Fibonacci levels to confirm technical structure
Stochastic indicator to find precise entry timing
🔹 Entry: 0.5892
🔹 Take-Profit: 0.5864
🔹 Stop-Loss: 0.5909
🔹 Risk-to-Reward Ratio: 1.64
⚠️ Disclaimer: This analysis is for educational purposes only and is not financial advice. Always trade with proper risk management.

CADJPY: Bullish Move Confirmed?! 🇨🇦🇯🇵
CADJPY is going to bounce from a key daily support.
With a high probability, 107.28 level will be reached soon.
❤️Please, support my work with like, thank you!❤️

More downside for GBP USDMore downside anticipated for GBP USD, with GBP news this week anticipated to be bad for GBP, and with USD slowly starting to potentially recover towards the end of the week, it seems likely a breakdown of GBP USD occurs towards the end of the week.
Multiple retracements have been respected in terms of holding as key levels as well as multiple structure breaks have occurred for internal range and external range.
Liquidity resting below as above has been taken.

Further downside for the GBP?The GBP/USD recently chalked up a lower low, hitting US$1.3141, and possibly triggering an early downtrend. While this is considered bearish, buyers and sellers are currently battling for position around a 1Y support level at US$1.3246, and this could prompt a test of 3M resistance of US$1.3373, and even potentially 1Y resistance from US$1.3472.
You may also see that the currency pair recently completed a head and shoulders pattern, with the 3M resistance largely serving as the neckline. Ultimately, with the pattern’s profit objective not seen until US$1.2952, the 3M support at US$1.2927 could be targeted to the downside.
Written by the FP Markets Research Team

GBPUSD Long trade idea (30 July 2025)- Bullish Divergence on 1-H time frame
- Last LH broken at 1.3361
- Entered at CMP (1.33736)
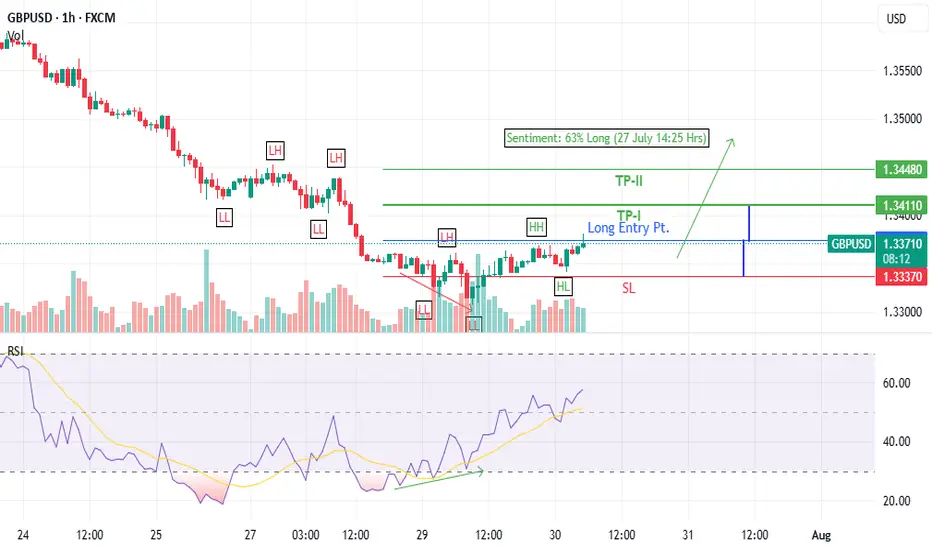
Technical Scenario for TodayTechnical Scenario for Today
According to the current technical analysis:
If above 1.3384, resistance targets around 1.3408 or even 1.3438 could be targeted
Akhbar Forex
.
If 1.3351 is broken, the market could test lower support around 1.3321 or deeper if the pressure continues
📉 Expected intraday range
According to StockInvest's Daily Volatility model (based on 14-day ATR ~0.0064), GBP/USD could move within a range of ±0.48% from the opening price. If it opens around 1.330, the range could be 1.3246 – 1.3354
CoinCodex and MidForex also forecast an average price around 1.344, however this is more in line with the weekly and monthly forecasts, less related to intraday developments
coincodex.com
.
Watching Retracement Levels for Potential USDCAD Entry📈 The USDCAD remains firmly in a bullish trend following a sharp pullback on the 4-hour timeframe. Price continues to print higher highs and higher lows, showing sustained upward momentum. I’m watching for a retracement back into equilibrium of the previous price swing — if price dips and then breaks structure to the upside, I’ll be eyeing a potential long entry 🔍📊 (not financial advice).

USDCAD Daily AnalysisUSDCAD has recently completed a clean 5-wave Elliott Wave decline, reaching a significant low at 1.3540 on June 16, 2025. This low marks the end of the bearish cycle, followed by an accumulation phase. During this phase, price formed a triple bottom pattern, confirming strong demand around the 1.3540–1.3560 zone.
The breakout above the neckline confirms this reversal pattern, and price is now retesting the previous resistance zone (1.3750–1.3770), which has turned into support.
The pair is also trading above the 21-period EMA, reinforcing the bullish momentum.
Elliott Wave & Structure Outlook
Elliott Wave count shows a completed 1–5 bearish wave, followed by a corrective bullish structure in progress.
Wave A of the corrective move has likely completed, and Wave B retracement is underway.
A continuation toward Wave C is expected, targeting the 1.4180–1.4300 resistance area, aligning with prior major supply zones.
Trade Plan
Buy Entry Zone: 1.3750 – 1.3700
Stop Loss: 1.3560 (below structure support and trendline)
Take Profit Targets:
🎯 TP1: 1.4000
🎯 TP2: 1.4180
🎯 TP3: 1.4300
USDCAD has shifted from a prolonged bearish trend into a bullish corrective phase. A successful retest of the breakout zone offers a high-probability long trade setup. Breakout and continuation toward 1.4180–1.4300 aligns with wave theory and technical resistance zones.

NZDUSD long trade dated 29 July 2025- Breakout of last LH will suggest that the odds are in favour of the long trade
- Presence of a bullish AB=CD pattern increases our chances. However entry set via Buy Stop after confirmed trend reversal

USDJPY Showing Bullish Correction USDJPY is currently testing a key support level, with the US dollar showing recovery since the beginning of the session. This bullish momentum is giving the pair a chance to climb higher.
Technical Overview:
The price is approaching the local support zone near 147.50. Bullish momentum is building from this level. If the price holds above 147.50, it could trigger further upside movement Upside Targets will be 148.50 and also 150.20
You May find more details in the chart,
Trade wisely Best of Luck Buddies.
Ps; Support with like and comments for better analysis Thanks Traders.

Time For Pullback📉 Technical Breakdown:
1. Resistance Zone (Supply Zone) — 1.15700 to 1.15950
> Price was previously rejected strongly from this area, confirming it as a strong supply/resistance zone.
> Multiple rejections from this level indicate the presence of strong sellers.
2. Current Price Action:
> After retesting the resistance area, price is now dropping with momentum, forming strong bearish candles.
> The blue arrows show an expected continuation downward.
3. Retrace Target Area (Short-term Target) — 1.14685 to 1.14593
> This zone is likely the next support level or liquidity pool, where price might temporarily stall or bounce.
>It could be a profit-taking zone for intraday/swing sellers.
4. Previous Low / Major Support Zone — Around 1.14000 to 1.13917
> This purple box marks the previous significant low, which is a key bearish target.
> A break below this level would confirm a strong bearish trend continuation on a higher timeframe.
🧠 Trade Idea:
✅ Sell Setup in Play
Entry: Already in motion after rejection from the 1.15700–1.15950 zone
# TP1: 1.14685 (retracement target zone)
# TP2: 1.14000 area (previous low)
# SL Idea: Above 1.1600 (above resistance wick for safe margin)
✅ Conclusion:
> This chart shows a clear bearish market structure with room for downside.
> Expect continuation to 1.1468, then possibly to 1.1400, unless buyers step in around the retrace zone.
> Solid opportunity for trend-following short trades.
