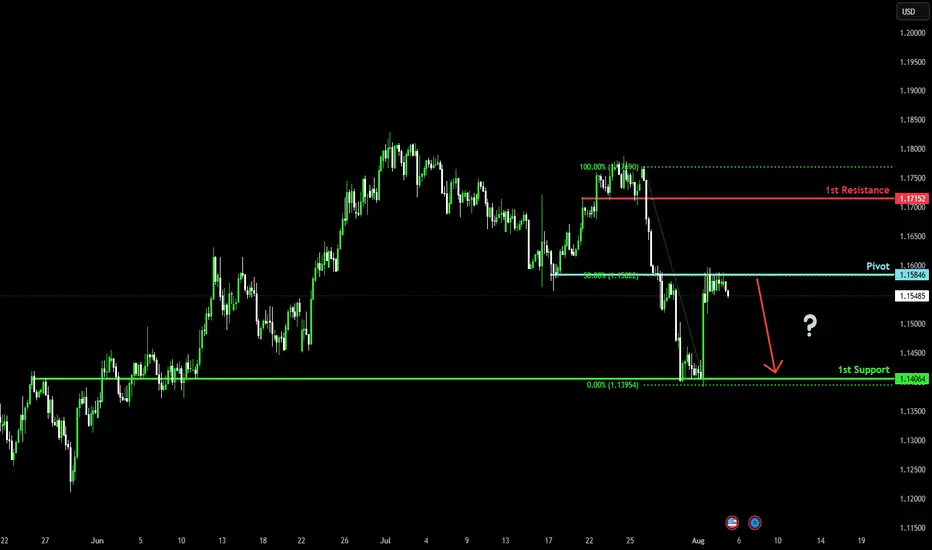
EURUSD – Bearish pullback in play ? EURUSD has broken the ascending trendline and dropped below the EMA confluence, confirming a bearish structure. The current rebound is testing the 0.5–0.618 Fibonacci zone, but weak buying pressure and rejection candles suggest it’s likely just a technical pullback.
If momentum holds, the pair may resume its downtrend toward 1.1400 and potentially 1.1296. The bears remain in control unless strong fundamentals shift the balance.
Forex market

EURUSD POSSIBLE SELL OPPORTUNITY!Price is reacting at a major o key level of broken support turn resistance. I anticipate a sell off from the current market price with my target profit situated at 1.13962 A sell opportunity is envisaged.

GBP_NZD BULLISH BREAKOUT|LONG|
✅GBP_NZD broke the key structure level of 2.2500
While trading in an local downtrend
Which makes me bearish
And I think that after the retest of the broken level is complete
A rebound and bearish continuation will follow
SHORT🔥
✅Like and subscribe to never miss a new idea!✅

GBPUSD – DAILY FORECAST Q3 | W32 | D5 | Y25📊 GBPUSD – DAILY FORECAST
Q3 | W32 | D5 | Y25
Daily Forecast 🔍📅
Here’s a short diagnosis of the current chart setup 🧠📈
Higher time frame order blocks have been identified — these are our patient points of interest 🎯🧭.
It’s crucial to wait for a confirmed break of structure 🧱✅ before forming a directional bias.
This keeps us disciplined and aligned with what price action is truly telling us.
📈 Risk Management Protocols
🔑 Core principles:
Max 1% risk per trade
Only execute at pre-identified levels
Use alerts, not emotion
Stick to your RR plan — minimum 1:2
🧠 You’re not paid for how many trades you take, you’re paid for how well you manage risk.
🧠 Weekly FRGNT Insight
"Trade what the market gives, not what your ego wants."
Stay mechanical. Stay focused. Let the probabilities work.
FX:GBPUSD

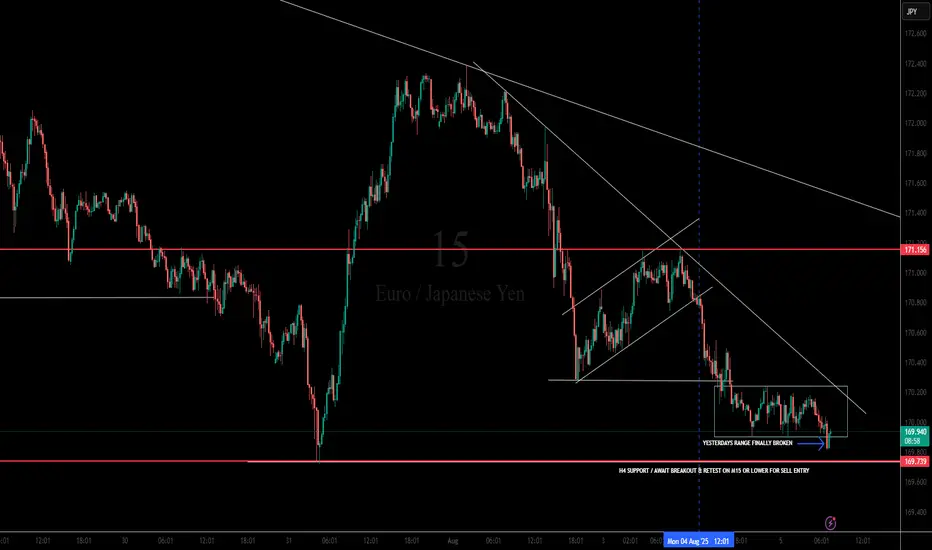
Multi-Timeframe Breakdown: LOOK @ PREVIOUS PUBLISHED IDEA FOR H4📌 M15 Chart 'SELL ENTRY PENDING'
Key Notes on Chart:
"Yesterday’s range finally broken" – confirmed.
Consolidation zone (range) broken to the downside, showing momentum shift.
Support Break: Price has broken through intra-day support of the range and retested the underside.
Break of Structure (BOS) on LTF (lower timeframe) is evident.
Bearish Flag/Channel broken down.
SMC Bias: Likely engineered a false sense of support before breaking down (liquidity grab from range buyers).
🎯 Trade Setup: Sell Opportunity (Continuation Setup)
🔻 ENTRY:
After confirmed break of the M15 range and H4 support (~169.74), look to enter on a retest rejection (LTF bearish candle confirmation on M15 or M5).
Conservative Entry: On breakdown retest @ 169.70 – 169.80
Aggressive Entry: Current price action continuation breakdown from 169.74
⚠️ What to Watch
If price reclaims and closes strongly above 170.20, invalidate bearish bias.
Any bullish engulfing or LTF shift in structure near current support warrants caution.
Watch for fakeout traps — ensure retest confirmation before entry.
GBP-JPY Bearish Bias! Sell!
Hello,Traders!
GBP-JPY is going down
And the pair made a breakout
Of the key horizontal level
Of 195.500 so we are
Bearish biased and we
Will be expecting a
Further bearish move down
Sell!
Comment and subscribe to help us grow!
Check out other forecasts below too!
Disclosure: I am part of Trade Nation's Influencer program and receive a monthly fee for using their TradingView charts in my analysis.

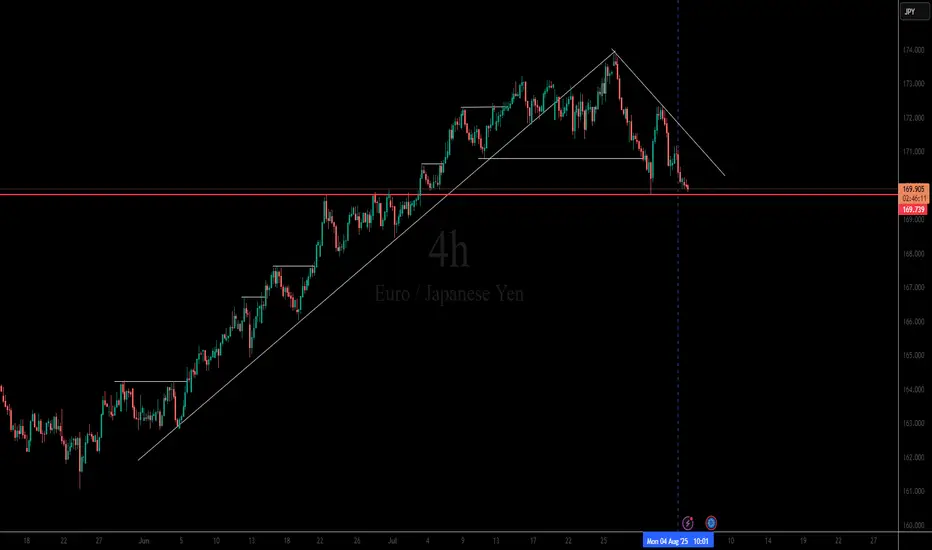
Multi-Timeframe Breakdown: LOOK AT NEXT PUBLISHED IDEA FOR M15 📌 H4 Chart SELL ENTRY LOADING....
Market Structure: Clean uptrend that broke structure to the downside.
Trendline Break: The bullish trendline has been broken and respected as resistance, showing bearish strength.
Support Level: Price is sitting right on a strong horizontal support (~169.74) — tested multiple times in the past.
Bearish Channel Forming: Price is forming lower highs and lower lows, suggesting a bearish trend continuation.
Liquidity Context:
There was likely sell-side liquidity below that horizontal support, which price might aim to sweep.
Buyers defending this area aggressively before; if they fail again, a breakout could accelerate.
Sell USDJPYWe can expect USDJPY to fall deeper into the support on Tuesday. A bearish flag indicates price is ready to decline.

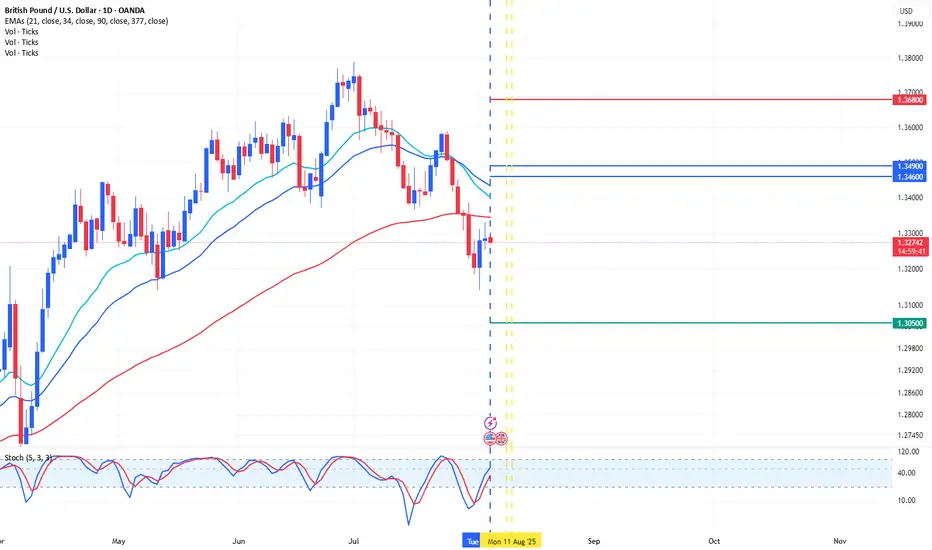
Trading Ideas GBPUSD 1D [Disc On]Technical Analysis:
A bearish pattern has formed on the daily (1D) timeframe, with price action potentially targeting the Fibonacci cluster zone at the psychological level 1.3600 - 1.3490.
Fundamental Analysis:
Fed Interest Rate: 4.50% (in line with expectations)
BoE Interest Rate: (Release date: 7 August 2025)
Conclusion:
High probability for SELL entries in the 1.3600 - 1.3490 zone, with:
(SL): 1.3680
(TP): 1.3050
EUR/USD - Bearish Outlook (05.08.2025)The EUR/USD Pair on the H4 timeframe presents a Potential Selling Opportunity due to a recent Formation of a Bearish Flag Pattern. This suggests a shift in momentum towards the downside in the coming Days.
Possible Short Trade:
Entry: Consider Entering A Short Position around Trendline Of The Pattern.
Target Levels:
1st Support – 1.1400
2nd Support – 1.1300
🎁 Please hit the like button and
🎁 Leave a comment to support for My Post !
Your likes and comments are incredibly motivating and will encourage me to share more analysis with you.
Best Regards, KABHI_TA_TRADING
Thank you.
Disclosure: I am part of Trade Nation's Influencer program and receive a monthly fee for using their TradingView charts in my analysis.

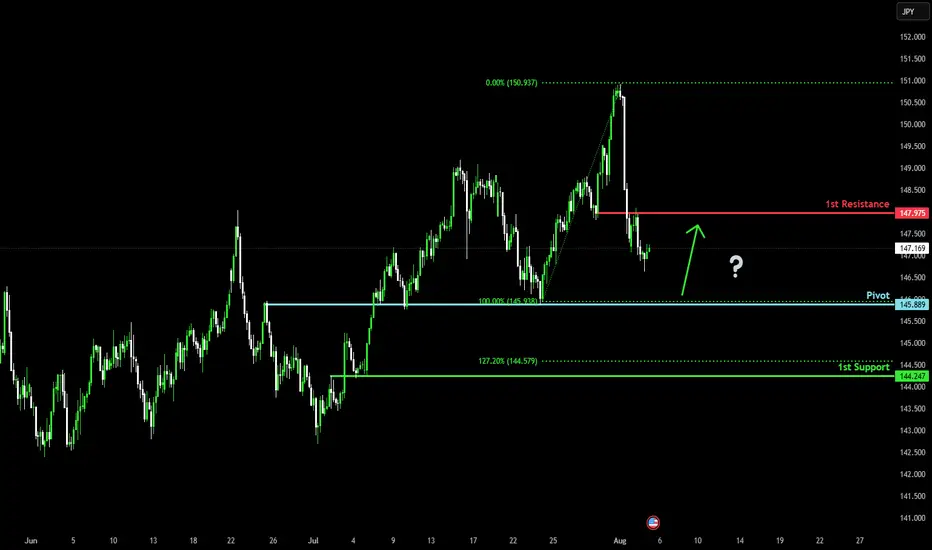
Falling towards major support?USD/JPY is falling towards the pivot, which has been identified as an overlap support and could bounce to the 1st resistance.
Pivot: 145.88
1st Support: 144.24
1st Resistance: 147.97
Risk Warning:
Trading Forex and CFDs carries a high level of risk to your capital and you should only trade with money you can afford to lose. Trading Forex and CFDs may not be suitable for all investors, so please ensure that you fully understand the risks involved and seek independent advice if necessary.
Disclaimer:
The above opinions given constitute general market commentary, and do not constitute the opinion or advice of IC Markets or any form of personal or investment advice.
Any opinions, news, research, analyses, prices, other information, or links to third-party sites contained on this website are provided on an "as-is" basis, are intended only to be informative, is not an advice nor a recommendation, nor research, or a record of our trading prices, or an offer of, or solicitation for a transaction in any financial instrument and thus should not be treated as such. The information provided does not involve any specific investment objectives, financial situation and needs of any specific person who may receive it. Please be aware, that past performance is not a reliable indicator of future performance and/or results. Past Performance or Forward-looking scenarios based upon the reasonable beliefs of the third-party provider are not a guarantee of future performance. Actual results may differ materially from those anticipated in forward-looking or past performance statements. IC Markets makes no representation or warranty and assumes no liability as to the accuracy or completeness of the information provided, nor any loss arising from any investment based on a recommendation, forecast or any information supplied by any third-party.
#016: CHF/JPY Long Investment Opportunity
Today I want to show you this long investment opportunity by placing a BUY LIMIT order on CHF/JPY. Hello, I'm Forex Trader Andrea Russo, an independent trader and prop trader with $200,000 in capital under management. Thank you in advance for your time.
The CHF/JPY pair is building an extremely interesting technical pattern, which could offer one of the best risk-controlled long opportunities in recent weeks.
🧠 Advanced Structural Analysis
After an orderly sequence of lower highs, the price recently completed a bearish move that looks more like directional manipulation than a true breakout.
Three key elements support this hypothesis:
- Final compression on decreasing volume
- Visible divergence between relative strength and price movement
- Volume clusters interrupted in the lower zone, with the LVN area still empty and devoid of institutional liquidity
🔍 The hunting zone is already active
According to our studies, the price is exactly within the so-called "stop hunting zone," a range between technical and psychological levels where:
- Retail traders are closing long positions at a loss
- Breakout traders are entering short positions late
- Market makers are accumulating passively, exploiting market emotion
Historically, these zones herald strong reversals if defended by banks' protective orders.
🔄 Multi-Timeframe Confluence
All higher timeframes (4H, 8H, and Daily) show a consistent picture of active cyclical support, with a potential harmonic pattern nearing completion and a technical structure that coincides with previous levels of institutional reaction.
Heading into pullback resistance?The Cable (GBP/USD) is rising towards the pivot, which acts as a pullback resistance and could reverse to the 1st support.
Pivot: 1.3386
1st Support: 1.3104
1st Resistance: 1.3591
Risk Warning:
Trading Forex and CFDs carries a high level of risk to your capital and you should only trade with money you can afford to lose. Trading Forex and CFDs may not be suitable for all investors, so please ensure that you fully understand the risks involved and seek independent advice if necessary.
Disclaimer:
The above opinions given constitute general market commentary, and do not constitute the opinion or advice of IC Markets or any form of personal or investment advice.
Any opinions, news, research, analyses, prices, other information, or links to third-party sites contained on this website are provided on an "as-is" basis, are intended only to be informative, is not an advice nor a recommendation, nor research, or a record of our trading prices, or an offer of, or solicitation for a transaction in any financial instrument and thus should not be treated as such. The information provided does not involve any specific investment objectives, financial situation and needs of any specific person who may receive it. Please be aware, that past performance is not a reliable indicator of future performance and/or results. Past Performance or Forward-looking scenarios based upon the reasonable beliefs of the third-party provider are not a guarantee of future performance. Actual results may differ materially from those anticipated in forward-looking or past performance statements. IC Markets makes no representation or warranty and assumes no liability as to the accuracy or completeness of the information provided, nor any loss arising from any investment based on a recommendation, forecast or any information supplied by any third-party.

GBPCAD Forming Descending ChannelGBPCAD is currently trading within a well-defined descending channel on the 4H chart, and price action is showing early signs of a potential breakout to the upside. After multiple rejections from the lower boundary, the pair is now consolidating just beneath the channel resistance. If bulls manage to push above the upper trendline with strong volume, it would confirm a bullish breakout, offering a short-term trend reversal opportunity. A clean breakout could lead to a sharp rally toward the 1.8500–1.8600 levels, supported by momentum and market structure.
On the fundamental side, the British pound is gaining strength as markets continue to digest the Bank of England's recent tone, which remains relatively hawkish compared to other G7 central banks. With UK core inflation still elevated and wage growth running hot, the BoE is likely to remain cautious about rate cuts. Meanwhile, the Canadian dollar is under pressure, weighed down by falling oil prices and softer-than-expected Canadian employment data, which fuels expectations of a more dovish Bank of Canada. This divergence creates a bullish backdrop for GBPCAD in the near term.
Traders should watch for a clear break and candle close above the descending channel, especially above the 1.8350–1.8370 resistance zone. A breakout with follow-through would validate bullish continuation, and dips back toward the breakout zone could serve as a retest for new longs. Risk management remains key, with invalidation below recent swing lows around 1.8200. The setup aligns with trendline breakout strategies and could provide favorable risk-to-reward potential for buyers.
Overall, GBPCAD is setting up for a possible bullish reversal after weeks of steady downside. With technical structure aligning and fundamentals supporting GBP strength over CAD, this pair may offer a clean breakout play. Momentum traders should stay alert for confirmation signals and position accordingly to ride the next potential leg up.

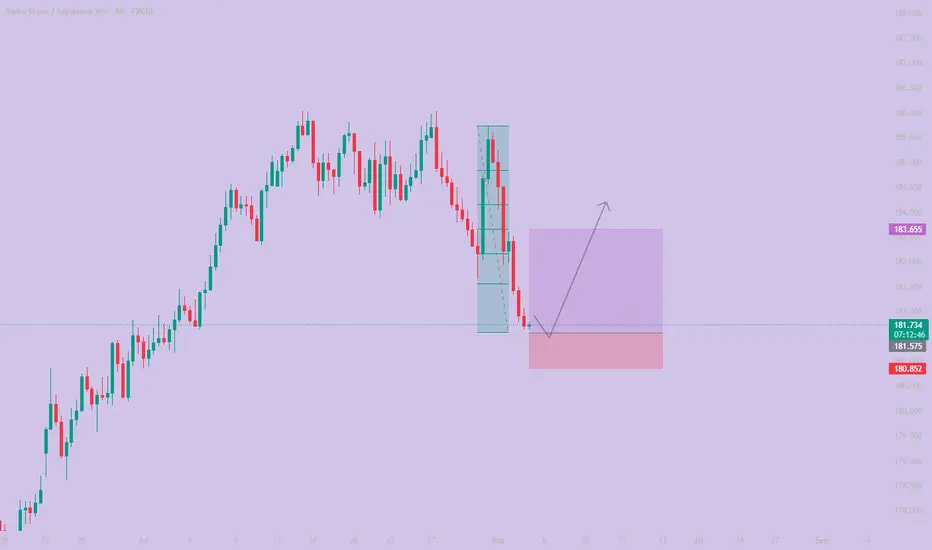
Bearish drop off pullback resistance?The price has rejected off the pivot, which has been identified as a pullback resistance that lines up with the 50% Fibonacci retracement and could drop to the 1st support.
Pivot: 1.1584
1st Support: 1.1406
1st Resistance: 1.1715
Risk Warning:
Trading Forex and CFDs carries a high level of risk to your capital and you should only trade with money you can afford to lose. Trading Forex and CFDs may not be suitable for all investors, so please ensure that you fully understand the risks involved and seek independent advice if necessary.
Disclaimer:
The above opinions given constitute general market commentary, and do not constitute the opinion or advice of IC Markets or any form of personal or investment advice.
Any opinions, news, research, analyses, prices, other information, or links to third-party sites contained on this website are provided on an "as-is" basis, are intended only to be informative, is not an advice nor a recommendation, nor research, or a record of our trading prices, or an offer of, or solicitation for a transaction in any financial instrument and thus should not be treated as such. The information provided does not involve any specific investment objectives, financial situation and needs of any specific person who may receive it. Please be aware, that past performance is not a reliable indicator of future performance and/or results. Past Performance or Forward-looking scenarios based upon the reasonable beliefs of the third-party provider are not a guarantee of future performance. Actual results may differ materially from those anticipated in forward-looking or past performance statements. IC Markets makes no representation or warranty and assumes no liability as to the accuracy or completeness of the information provided, nor any loss arising from any investment based on a recommendation, forecast or any information supplied by any third-party.
GBPUSD short at current market priceH1 chart pattern showing buyer is loosing its strength especially with a long wick recorded yesterday (1.3330 to 1.3300, 30pips wick).
i'm short at current market price.
my target is around round number 1.32.
calculate your own risk & reward.
Good Luck

EURUSD - 31/7/25Price has reached a zone that broke the structure - see BoS on the left. Now that price is here in the zone, im not comfortable entering a buy order yet. The full bearish candle into the zone, leaves me with an indication that price may go lower.
+ve:
1. Big bearish candle in to the BoS zone - price may drop lower
2. There is equal low liquidity on the left which sits just below the zone which is expected to be taken out
4. HTF direction is still bullish
-ve:
1. below the equal low liquidity is an efficient zone before some imbalance
2. that imbalance may draw price to it and stop me out
Second trade idea:
Assuming that the first trade does not hold, then my focus will be the extreme zone where i will place a buy limit.
TP: 8.86R

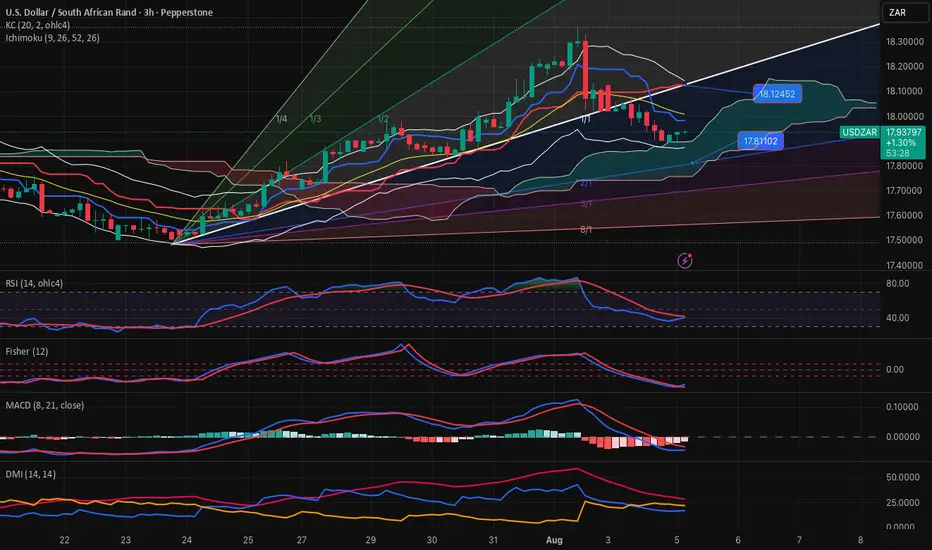
USDZXAR-NEUTRAL BUY strategy 3 hourly chartThe pair has moved lower as expected, however the decline has not been severe, and besides, other currencies show slightly oversold status, and this provide a good basis for BUY entry instead now.
Strategy BUY @ 17.9000-17.9300 and take profit near 18.0875 for now.
EURUSD awaiting its next moveEURUSD is still trading around the same levels as yesterday.
If you're looking for a trade opportunity, watch for a higher low forming above 1,1388.
This could happen after a pullback from the current levels, or from slightly higher if the price continues to push upward.
Use the Fibonacci tool during the correction to help identify potential entry points.
At the moment, the major currency pairs are offering the best trading setups.

USDCHF Short - swingprice retracing to daily area of interest, all time frame aligned weekly daily 4h 2h 30m 15 aligned bearish, 1:2 RRR lets see how it goes

USD/JPY Bearish Setup - Breakout from Ascending ChannelUSD/JPY Bearish Setup – Breakout from Ascending Channel
Price action on USD/JPY has broken down from an ascending channel, signaling potential bearish momentum ahead. The breakdown suggests a possible continuation toward lower support levels.
1st Support Level: 144.800 – 144.200
2nd Support Level: 143.000 – 142.400
Watch for price consolidation or retests at the 1st support level. A clean break below this zone could open the path toward the 2nd support level.
Key Notes:
Bearish volume increase post-breakout
Ichimoku cloud starting to thin, showing weakening bullish momentum
Structure favors selling rallies below the channel
📉 Bias: Bearish
💡 Plan: Wait for confirmation on lower timeframes before entering short positions


