SH+PL GUMarket activated fresh resistance line, forming small M that could be reversal opportunity, matching W in DXY and trade aligns with overall DXY Bullish Bias. delayed entry to leverage the second arm of the M
Forex market

AUDUSD Pressured by the Trendline – Chasing BUYs Is Very RiskyOn the H4 timeframe, AUDUSD presents a very clear technical picture: the primary trend remains bearish / sideways-dow n , and the current upswing is more of a technical pullback into supply rather than a genuine trend reversal.
On the chart, price is being pressed down by a descending trendline drawn from prior highs. The zone around 0.6639–0.6640 acts as a key confluence resistance, aligning with the descending trendline and the Ichimoku / previous reaction area. This is the type of zone where price often tags, gets rejected, and reverses if buyers lack sufficient strength.
To the downside, 0.6600 stands as the nearest support and a logical downside target if rejection at resistance occurs. Therefore, in the short term, the high-probability scenario is: price rallies to test 0.6640 → gets sold → drops back toward 0.6600. Only if AUDUSD closes a strong H4 candle decisively above 0.6640 and holds above this level would there be a valid case for a broader bullish extension.
Wishing you disciplined and successful trading!

Fundamental Market Analysis for December 22, 2025 GBPUSDGBP/USD is trading near 1.34000, and the pair remains sensitive to interest-rate expectations and fresh macro data from the UK and the US. During a shortened week, investors are reducing risk, closely watching US releases on growth and consumer sentiment, which can reshape expectations for the Fed’s next steps.
The fundamental backdrop for the pound is complicated by the fact that the Bank of England cut the policy rate to 3.75% at its latest meeting, with a very close vote, and signaled that future decisions will be taken “meeting by meeting.” The regulator aims to bring inflation back to target, but softer economic momentum and a cooling labor market fuel the debate about supporting demand.
If upcoming UK growth readings confirm a slowdown, the market may price in a more accommodative rate path, lowering the pound’s appeal. At the same time, the US continues to show signals that rates could be held steady for several months, especially if inflation declines more slowly than expected. This combination increases the likelihood of a stronger dollar and pressure on GBP/USD.
Trading recommendation: SELL 1.33950, SL 1.34250, TP 1.33050

GBP/USD Is Range-Bound — Macro Pressure Favors RotationMarket Structure (H1)
GBP/USD is currently trading inside a well-defined moving range, capped by a firm resistance zone near 1.3450 and supported by demand around 1.3315. Price action within this box is overlapping and corrective, confirming a non-trending environment. The sharp rejection from resistance followed by weak follow-through on rebounds shows that buyers lack conviction, while sellers have not yet forced a decisive breakdown.
The latest impulsive move into the range was quickly absorbed, and price is now rotating back toward the mid-to-lower portion of the structure. As long as the pair remains below resistance, upside attempts are mean-reverting, not trend-defining.
Liquidity & Price Behavior
This range is acting as a liquidity container. Repeated tests of both extremes suggest ongoing stop-hunting rather than accumulation for a breakout. The projected path toward the lower boundary aligns with how price typically behaves in balanced conditions — rotating until liquidity is fully cleared.
Macro & Policy Context
From a macro perspective, conditions currently weigh on GBP:
The U.S. dollar remains supported by relatively higher yields and a still-restrictive Federal Reserve stance.
Markets continue to price rate cuts cautiously, keeping USD demand elevated during periods of uncertainty.
In contrast, the UK outlook remains softer, with slower growth expectations limiting GBP upside.
This macro divergence explains why GBP/USD struggles to accept above resistance and why rallies are being sold into rather than extended.
Conclusion
GBP/USD is not setting up for a breakout it is rotating within a macro-constrained range.
Failure at resistance favors continuation toward the support zone.
Only a clean acceptance above 1.3450 would shift the structure bullish.
Until then, patience remains key. The edge lies in reacting to range extremes, not anticipating trend continuation.

This is a Head n Shoulders Inverse Bullish AUDUSD Monthly I do recall the existence of some H & S bullish patterns on this pair.
This is a 17% move to TP.
YES, it will still take a couple months to play out I’d expect.
Even when these trigger they often retest so be aware of that. Retest of the entry zone.
If the Tp is 17%, a 4% stop loss under entry would be still 1:4 risk to reward.
I leant from one of the best H&S’s gurus in the UK Simon…, all he does are these and W BOTTOMS & M TOPS.
YOU will see several W ‘s patterns near price now. A little different to Double bottoms but essentially they represent a visual way to spot the same thing.
* keep an eye on Overbought levels in indices, however sp500 D RSI is a perfect 50 number or just above.

EUR/USD Is Sitting on the Edge — Bounce or Breakdown?EUR/USD – 1H
Price is holding at a well-defined support zone (~1.1700) after sustained selling pressure.
Momentum is weak, but selling is no longer aggressive → early stabilization.
Key Levels
Support: 1.1685–1.1705
Resistance: 1.1755–1.1765
Upside target (if bounce holds): 1.1800–1.1810
Scenario
Base case: support holds → corrective bounce toward resistance.
Failure scenario: clean break below support opens continuation lower.
Bottom Line
This is a decision zone, not a chase.
The move only becomes clear after price reacts at support.

90 For The Homies! 12/21 thru 12/23This might take a minute. I'm1/2 TP at 45 pips. This drop started last week. This is just a breath up. Should be choppy 🪓

EURUSD Is Trapped Below Resistance — Distribution Before....EURUSD – H1 MARKET ANALYSIS
1. Market Structure
EURUSD is currently trading within a short-term corrective structure after a strong impulsive decline. The recent rebound failed to break above the key resistance zone, confirming that sellers are still in control of the broader intraday trend.
Price action shows:
- A clear lower-high formation near the resistance zone.
- Weak bullish follow-through after each bounce.
- Compression around the mid-range, indicating distribution rather than accumulation.
2. Key Zones
- Resistance Zone: 1.1750 – 1.1760
This zone has rejected price multiple times, acting as a supply area where sellers aggressively defend.
- Support Zone: 1.1700 – 1.1710
This is the nearest liquidity pool and the first downside objective.
3. Price Behavior & Liquidity
The sharp rejection from resistance followed by sideways consolidation suggests that the market is absorbing buy orders before continuation lower. The lack of strong bullish candles confirms that the rebound is corrective, not impulsive.
This behavior typically precedes:
- A stop-hunt below short-term consolidation
- Continuation toward deeper liquidity zones
4. Scenario Outlook
🔽 Primary Scenario (Preferred): Bearish Continuation
Price fails to reclaim the resistance zone
Breakdown below intraday structure
Targets:
Target 1: 1.1720
Target 2: 1.1700
Target 3: 1.1685 (major liquidity draw)
🔼 Alternative Scenario
Only if price breaks and holds above 1.1760 with strong momentum, the bearish setup is invalidated, and a deeper recovery may unfold.
5. Trading Bias
Main Bias: Bearish
Market State: Distribution → Liquidity Grab
Strategy: Sell rallies near resistance, avoid chasing price in the middle of the range.
Conclusion
EURUSD is not building strength it is preparing for continuation. As long as price remains below the resistance zone, downside liquidity remains the dominant magnet. Patience and discipline are key; the market will reveal direction once liquidity is released.

EURUSD Looks Calm — But Smart Money Is Setting the TrapEURUSD – H1 MARKET ANALYSIS
1. Current Market Structure
EURUSD is trading inside a short-term corrective structure after the previous impulsive decline. Price has formed a lower-high sequence, confirming that the dominant intraday bias remains bearish.
The recent bounce from the support zone is corrective in nature, not a trend reversal.
Key observations:
- Lower highs are clearly respected
- Price is failing to regain previous breakdown levels
- Structure remains below key resistance
2. Key Zones & Price Behavior
Resistance Zone: 1.1748 – 1.1760
This zone aligns with prior structure highs and acts as a sell-side supply area.
Repeated rejection here confirms seller control.
Support Zone: 1.1700 – 1.1710
This is a short-term demand zone, but it has already been tested.
Each retest weakens buyer strength.
3. Market Psychology
The market is currently trapping late buyers who interpret the bounce as a reversal.
In reality, this is a classic distribution phase inside a downtrend:
- Smart money sells into strength
- Retail traders buy the pullback
- Liquidity builds above resistance before continuation lower
This sideways behavior near resistance often precedes sharp downside expansion.
4. Scenarios Ahead
Primary Scenario (High Probability – Bearish Continuation):
- Price retests the resistance zone (1.1748 – 1.1760)
- Fails to break and hold above
- Strong rejection leads to downside continuation
Targets:
Target 1: 1.1720
Target 2: 1.1700
Target 3: 1.1685 (liquidity pool)
Invalidation Scenario:
- Only if H1 closes firmly above 1.1760
- And structure shifts to higher highs
- Until then, all upside is corrective.
5. Trading Bias & Conclusion
Bias: Sell rallies
Market State: Correction within a bearish structure
Strategy: Wait for rejection at resistance, follow structure — not emotion
This is not a guessing market.
The chart is clearly showing where liquidity is being built and where it wants to go.
Patience and discipline remain the edge.

USD/LKR Outlook : Expecting LKR to depreciate furtherFundamental Summary
• LKR began depreciating more sharply from Oct 2025 as forward models signaled the Government may miss year‑end FX reserve targets under the IMF program
• That speculation proved accurate as end‑Nov 2025 FX reserves showed a YoY decline
• Additional pressure expected due to the severe damage from Cyclone Ditwah:
• FX inflows to weaken as key export sectors and peak‑season tourism take a hit
• USD demand to rise with reconstruction‑related imports
• Short‑term reserves may tick up as the Government receives planned IMF/ADB/WB loan disbursements during next few days
• However, most of these inflows are earmarked for debt‑service commitments over the next two months
Conclusion
• LKR likely to remain under pressure and continue depreciating
• Investors should focus on counters that benefit from LKR depreciation during the CSE correction.
• Government needs to act quickly, as any dent in investor confidence could trigger significant capital outflows
TA Outlook
• LKR 306 – short‑term support
• LKR 328 – medium‑term resistance

The pullback in the euro presents a good opportunity to go long.Core Bullish Support Factors for the Euro
Persistent US - EU policy divergence continues to fuel upside momentum: The Federal Reserve has cut interest rates by a cumulative 75 basis points in 2025. After three consecutive rate cuts, its policy path has become ambiguous. In contrast, the European Central Bank (ECB) has kept interest rates unchanged for four straight meetings and entered an "extended observation period", making the threshold for further rate cuts extremely high in the future. This policy landscape of "US monetary easing and stable ECB policy" has continuously widened the interest rate spread advantage, providing core support for the euro.
Eurozone economic and inflation resilience underpins the currency: The Eurozone's Q3 2025 GDP grew by 0.3% quarter - on - quarter, ending two consecutive quarters of zero growth. The 2025 economic growth forecast has been revised up to 1.4%. Although inflation is slightly below the target, the October inflation rate fell to 2.5%, approaching the policy target, and core inflation remains resilient. This provides data - driven justification for the ECB to maintain its current policy stance.
Capital and technical structures remain intact: CFTC data shows that speculative net long positions in the euro have soared to 1388000 contracts, a significant increase from the previous reading, reflecting that institutional confidence in the euro's medium - term outlook remains undiminished. From a technical perspective, the exchange rate's pullback to around 1.1700 has not disrupted the upward channel, and the daily MACD still operates above the zero line, so the logic of trend repair remains valid.
EUR/USD trading strategy
buy:1.16900-1.17100
tp:1.17500-1.17700-1.18000

GBPUSD Weak Rebound – Is Every Rally a Selling Opportunity?GBPUSD is currently leaning toward a scenario of mild downside or low-range consolidation rather than a clear bullish move.
From a macro perspective, the British pound remains under pressure following the recent interest rate cut by the Bank of England. While this move was largely priced in, the accompanying message suggests that BoE is still open to further easing if the UK economy continues to cool. This has made short-term capital flows more cautious toward GBP, especially during rebound phases.
On the other side, the USD continues to hold a relative advantage as investors wait for clearer signals from upcoming US economic data. In the absence of negative surprises for the dollar, GBPUSD lacks strong momentum to push higher, and each rally toward higher levels is more likely to turn into a short-term selling opportunity.
Looking at price behavior, GBPUSD is showing signs of a “pullback within a weak trend” . Upside momentum remains limited, rebounds are shallow, and follow-through buying is lacking—indicating that buyers are not yet ready to take control in the short term.
Conclusion: Over the next 24 hours, GBPUSD favors a scenario of slight downside or pressured consolidation rather than a strong advance. The more prudent strategy is to wait for technical pullbacks and observe price reaction, instead of rushing to anticipate the formation of a new bullish trend.

euraud buy signal. Don't forget about stop-loss.
Write in the comments all your questions and instruments analysis of which you want to see.
Friends, push the like button, write a comment, and share with your mates - that would be the best THANK YOU.
P.S. I personally will open entry if the price will show it according to my strategy.
Always make your analysis before a trade

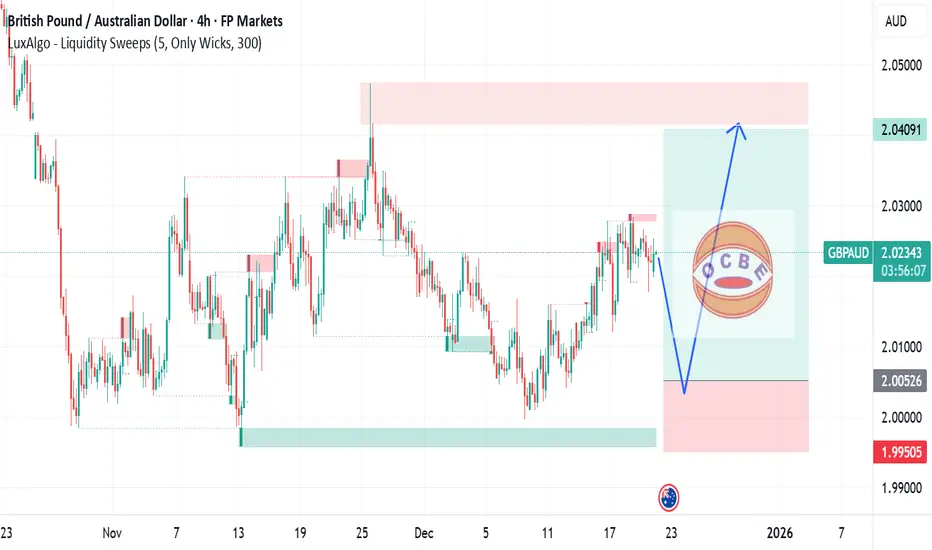
GBPAUD long movePrice is droppings towards our demand zone, any bullish reaction clouds lead to upwards movement in price.
1217 USDJPY 4H TRADING PLANHello traders,
Current Price: 155.547
1. Key Technical Levels (Based on the Chart)
Support: 154.666 (Point A), 155.00 (shortterm EMA support)
Resistance: 156.164 (tp1), 156.945 (tp2/Point X)
2. Fundamental Context (Today’s Core Drivers)
BoJ Meeting Preview: The Bank of Japan is widely expected to hike rates by 25bps on Dec 1819, so JPY strength is priced in premeeting, weighing on USD/JPY.
Fed Policy: U.S. Dec PMI weakness + inflation rebound have cooled Fed ratecut bets, but the USD lacks sustained upside momentum.
Market Sentiment: Carry trade unwinding and mild risk aversion add downward pressure to USD/JPY.
3. Long Strategy (Focused Today)
Entry Condition: Price pulls back to 155.00 (EMA support) + RSI bounces from 40 level, confirmed by a bullish candlestick.
Entry Price: 155.00155.10
Stop Loss: 154.60 (below Point A support)
Take Profits:
1. First target: 156.16 (tp1 resistance)
2. Second target: 156.95 (tp2/Point X resistance)
4. Today’s Action Plan
Prioritize the long setup: Wait for price to stabilize around 155.00 with a bullish signal before entering. Avoid forced entries if no clear confirmation.
GOOD LUCK!
LESS IS MORE!

EU 22 12 2025I drew the EURUSD chart with an ascending trendline in an uptrend.
Currently, the price is touching the trendline and bouncing up, so I expect it to rise toward the previous high.

GBPUSD BUYSGBPUSD - RE ACCUMULATION
Just on a technicals standpoint I like this setup as price took out some lows but quickly had a mss on the 4H indicating strong buyers are in control

GBPUSD – Technical AnalysisPrice is trading near a key resistance zone after a strong bullish move. Rejection from the upper area suggests a possible pullback / correction toward lower demand if sellers remain active.
🔹 Sell Entry: 1.3379 – 1.3405
🔹 Stop-Loss: 1.3456
🔹 Take-Profit: 1.3275 – 1.3220
Bias remains bearish below resistance, targeting the highlighted demand zone.

EURGBP SHORTTrade Setup: EUR/GBP Short (Bearish)
I am taking a bearish stance on EUR/GBP based on the following technical alignment:
Higher Timeframe Bias: The overall trend remains clearly bearish, providing a strong fundamental backbone for the trade.
H4 Market Structure: We have confirmed a Break of Structure (BOS) on the 4-hour timeframe, indicating that the momentum has shifted back to the downside.
H1 Confirmation: On the 1-hour timeframe, we have a fresh 13/21 EMA crossover, signaling a bearish trend resumption and providing a clean entry trigger.
Current Price: ~0.8753
Target: Looking for a move toward the recent lows around the 0.8721 level.
ENTRY PRICE: 0.8775
SL: 0.8802
TP: 0.8721
FUNDAMENTALS:Central Bank Divergence (The Main Driver)
The BoE is Cutting: On December 18, 2025, the Bank of England cut interest rates by 25 basis points to 3.75%. While the vote was a close 5-4 split, the signal is clear: the UK is in a gradual easing cycle to support a sluggish economy.
The ECB is Holding: On the same day, the ECB kept its deposit rate steady at 2.00%. More importantly, they upgraded their growth forecasts for 2025 (to 1.4%) and 2026. Because the Eurozone economy is showing more resilience than expected, the ECB is in no rush to cut further.


Possible short opportunityTrying new strategy which seems to work in hindsight, lets see what happens

USDJPY Weekly Outlook Week 52 Day 22This is the last trading week in the year of 2025. The first line is 162, while the second line of price is 158. Together 158-162 gives us a resistance area that the price has been struggling to break this high, and we saw in the last of the month of November that the price tapped the 157 area. The third line 151.378 is the 62 fib, and the fourth line is 149.336, the 50 fib, if we assume that price will be supplied at 158 to the fifth line, which is 140.485.
Week 52 analysis
Resistance 158-162
Support 142.75 - 140
50 fib between 158 and 140.485
62 fib
I keep my bullish sentiment on the pair, knowing that the market can swing high or low or even hold the current price for a long time. With that in mind, we keep our capital exposure very low and trade only small amounts at a time.
This means that I am looking for bullish opportunities in this market
Where is my next buying opportunity? I will wait for the market to pull back to 156.75 before buying again. It is currently at the time of writing 157.75. That’s 100 pips pull back. The next buying opportunity could be a break above 162 and a pullback to that level.
Where can I look to sell? Price has to stay below 156 for a long time - 2 weeks is a long time, before I can be tempted to sell. A better selling opportunity is when the price stays below 149.336 for a long time.
If you like my post, please give it a boost and let me know if there is an asset you want me to analyse. Share your own views with me in the comments section below
Disclaimer: This is not financial or trading advice; it is only for educational purposes.

EURUSD: Price Is Drawn To The +FVG! Bearish For The Short Term!Welcome back to the Weekly Forex Forecast for the week of Dec 22-26th.
EURUSD closed bearish last week. I expect there to be some follow through going into this week. At least for the short term.
Look for price to move into the +FVG before it signals that this pullback is over.
This is a scalpers market for the next couple of days.
Enjoy!
May profits be upon you.
Leave any questions or comments in the comment section.
I appreciate any feedback from my viewers!
Like and/or subscribe if you want more accurate analysis.
Thank you so much!
Disclaimer:
I do not provide personal investment advice and I am not a qualified licensed investment advisor.
All information found here, including any ideas, opinions, views, predictions, forecasts, commentaries, suggestions, expressed or implied herein, are for informational, entertainment or educational purposes only and should not be construed as personal investment advice. While the information provided is believed to be accurate, it may include errors or inaccuracies.
I will not and cannot be held liable for any actions you take as a result of anything you read here.
Conduct your own due diligence, or consult a licensed financial advisor or broker before making any and all investment decisions. Any investments, trades, speculations, or decisions made on the basis of any information found on this channel, expressed or implied herein, are committed at your own risk, financial or otherwise.
