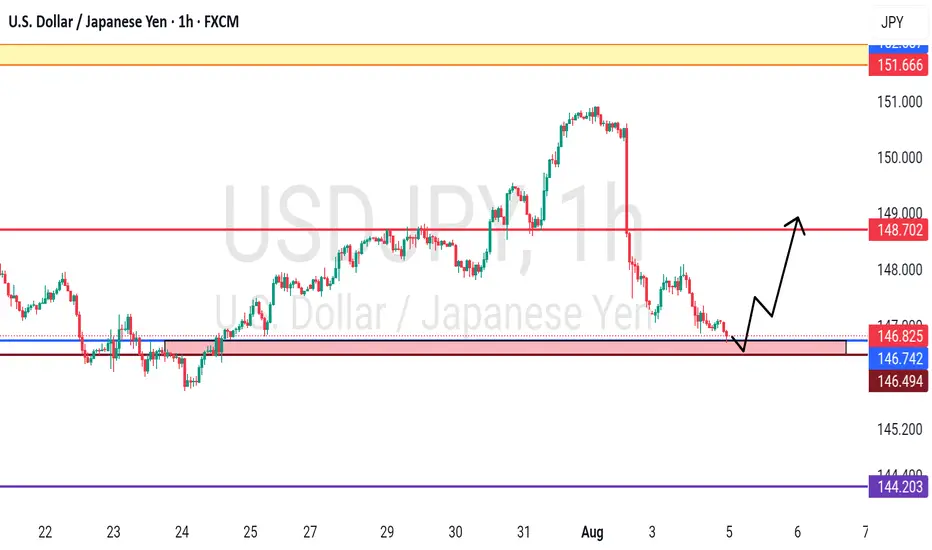
USDJPY - at his ultimate region, holds or not??#USDJPY .. market just reached at his current supporting region .
That is around 145.55 to 146.70
Keep close that region and if market holds that region then we can expect bounce from here
Keep close and don't be lazy here.
Good luck
Trade wisely
Forex market
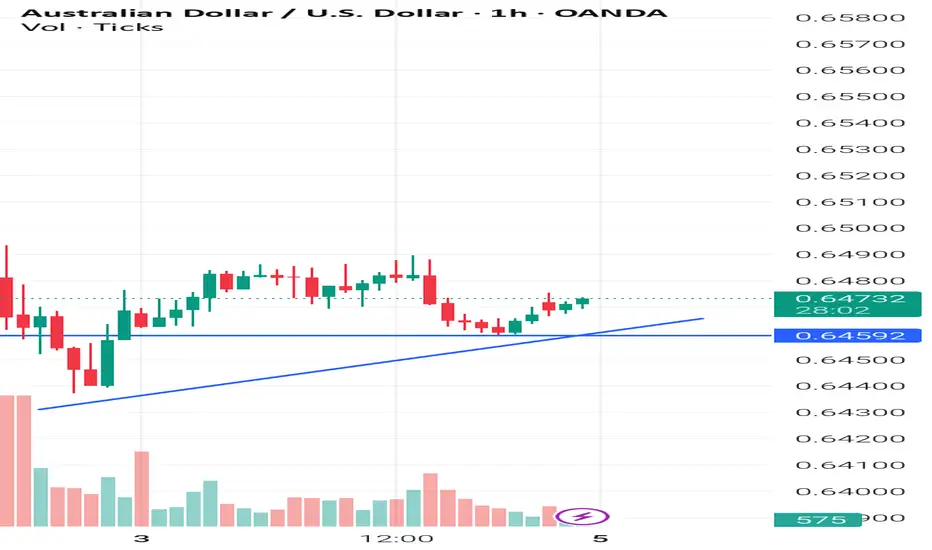
AUD USD long: 0.6470Following Friday's NFP data, calls for FED rate cuts are still in the air. And I agree with an ING article suggesting USD strength can be sold.
Combined with just published 'higher than forecast' AUD service PMI data. I think AUD USD long is worth a go.
It's a 12 pip stop loss with 18 pip profit target up to recent highs.
The risk to the trade is Chinese data or simply USD strength. If the trade is ongoing, I will make a decision tomorrow whether to 'hold' the trade through US ISM data.
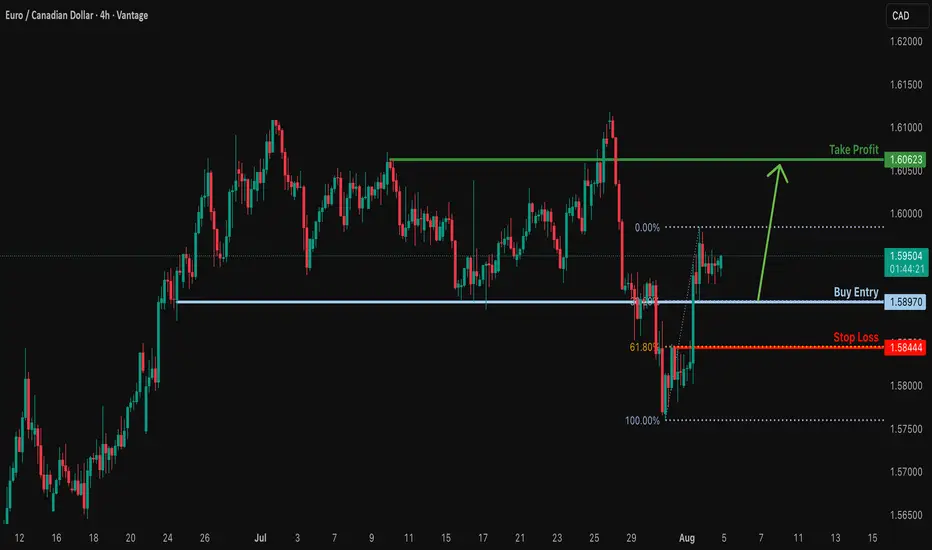
Bulllish bounce off?EUR/CAD is falling towards the support level which is a pullback support that aligns with the 38.2% Fibonacci retracement and could bounce from this level to our take profit.
Entry: 1.5897
Why we like it:
There is a pullback support that lines up with the 38.2% Fibonacci retracement.
Stop loss: 1.58444
Why we like it:
There is a pullback support that aligns with the 61.8% Fibonacci retracement.
Take profit: 1.60623
Why we like it:
There is a pullback resistance.
Enjoying your TradingView experience? Review us!
Please be advised that the information presented on TradingView is provided to Vantage (‘Vantage Global Limited’, ‘we’) by a third-party provider (‘Everest Fortune Group’). Please be reminded that you are solely responsible for the trading decisions on your account. There is a very high degree of risk involved in trading. Any information and/or content is intended entirely for research, educational and informational purposes only and does not constitute investment or consultation advice or investment strategy. The information is not tailored to the investment needs of any specific person and therefore does not involve a consideration of any of the investment objectives, financial situation or needs of any viewer that may receive it. Kindly also note that past performance is not a reliable indicator of future results. Actual results may differ materially from those anticipated in forward-looking or past performance statements. We assume no liability as to the accuracy or completeness of any of the information and/or content provided herein and the Company cannot be held responsible for any omission, mistake nor for any loss or damage including without limitation to any loss of profit which may arise from reliance on any information supplied by Everest Fortune Group.
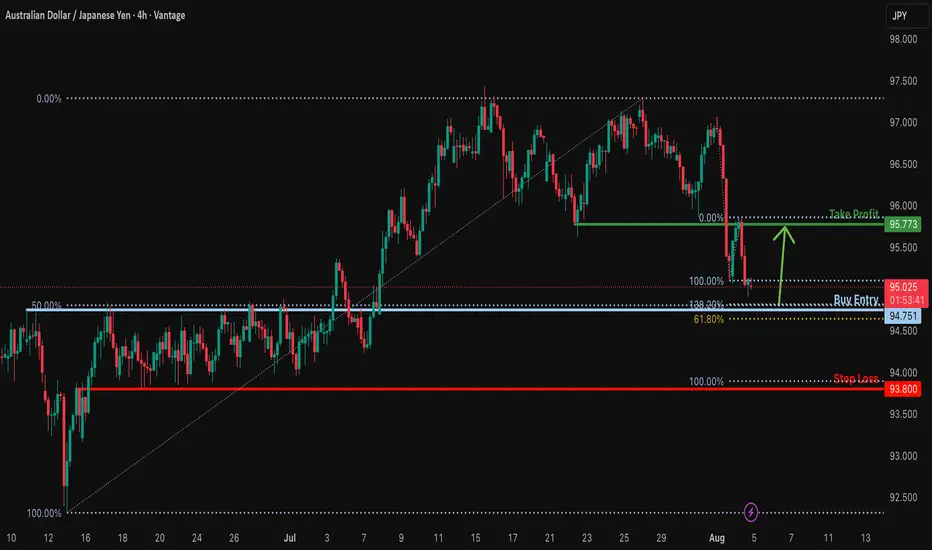
Bullish reversal off Fibonacci confluence?AUD/JPY is falling towards a support level, which is a pullback support aligning with the 138.2% Fibonacci extension, the 50% Fibonacci retracement, and the 61.8% Fibonacci projection. A bounce from this level could push the price toward our take-profit target.
Entry: 94.75
Why we like it:
There is a pullback support level that aligns with the 50% Fibonacci retracement, the 138.2% Fibonacci extension and the 61.8% Fibonacci projection.
Stop loss: 93.80
Why we like it:
There is a pullback support that lines up witht he 100% Fibonacci projection.
Takeprofit: 95.77
Why we like it:
There is an overlap resistance.
Enjoying your TradingView experience? Review us!
Please be advised that the information presented on TradingView is provided to Vantage (‘Vantage Global Limited’, ‘we’) by a third-party provider (‘Everest Fortune Group’). Please be reminded that you are solely responsible for the trading decisions on your account. There is a very high degree of risk involved in trading. Any information and/or content is intended entirely for research, educational and informational purposes only and does not constitute investment or consultation advice or investment strategy. The information is not tailored to the investment needs of any specific person and therefore does not involve a consideration of any of the investment objectives, financial situation or needs of any viewer that may receive it. Kindly also note that past performance is not a reliable indicator of future results. Actual results may differ materially from those anticipated in forward-looking or past performance statements. We assume no liability as to the accuracy or completeness of any of the information and/or content provided herein and the Company cannot be held responsible for any omission, mistake nor for any loss or damage including without limitation to any loss of profit which may arise from reliance on any information supplied by Everest Fortune Group.
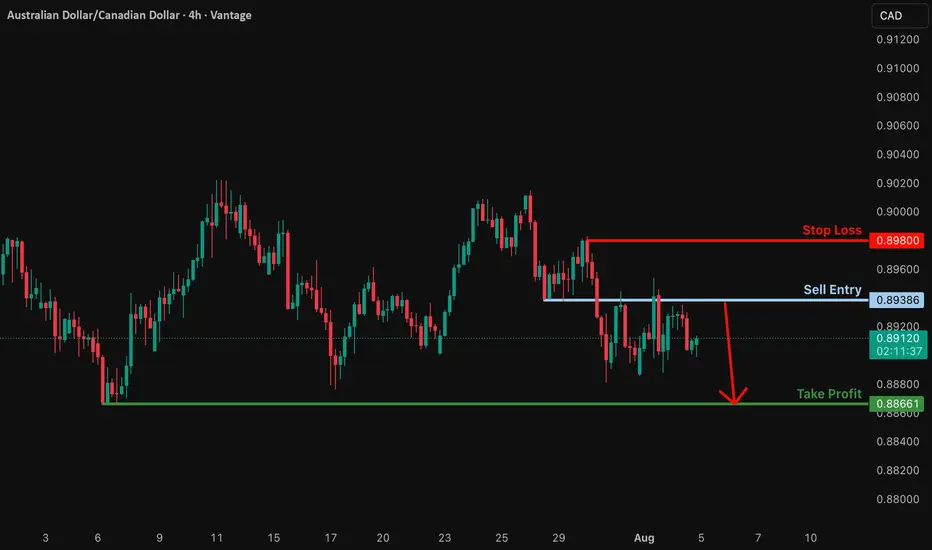
Bearish drop?AUD/CAD has rejected off the resistance level whihc is a pullback resistance and could drop from this level to our take profit.
Entry: 0.89386
Why we like it:
There is a pullback resistance.
Stop loss: 0.89800
Why we like it:
There is a pullback resistance.
Take profit: 0.88661
Why we like it:
There is a swing low support.
Enjoying your TradingView experience? Review us!
Please be advised that the information presented on TradingView is provided to Vantage (‘Vantage Global Limited’, ‘we’) by a third-party provider (‘Everest Fortune Group’). Please be reminded that you are solely responsible for the trading decisions on your account. There is a very high degree of risk involved in trading. Any information and/or content is intended entirely for research, educational and informational purposes only and does not constitute investment or consultation advice or investment strategy. The information is not tailored to the investment needs of any specific person and therefore does not involve a consideration of any of the investment objectives, financial situation or needs of any viewer that may receive it. Kindly also note that past performance is not a reliable indicator of future results. Actual results may differ materially from those anticipated in forward-looking or past performance statements. We assume no liability as to the accuracy or completeness of any of the information and/or content provided herein and the Company cannot be held responsible for any omission, mistake nor for any loss or damage including without limitation to any loss of profit which may arise from reliance on any information supplied by Everest Fortune Group.
USDJPY (Next 24 Hours) Technical Analysis & Forecast 1. Japanese Candlestick Analysis
4H/1H: Price opened at 147.056 near resistance (147.00–147.20). Recent candles show bearish engulfing (4H) and dark cloud cover (1H), signaling rejection.
30M/15M: Shooting star at 147.056 and bearish harami indicate exhaustion. Failure to close above 147.20 confirms weakness.
5M: Three black crows pattern emerging, suggesting strong short-term bearish momentum.
Outlook: Bearish reversal likely if 147.00 breaks.
2. Harmonic Patterns
4H/1H: Bearish Gartley Pattern completing at 147.056 (D-point).
PRZ: 147.00–147.20 (confluence of 78.6% XA and 127.2% BC).
Fibonacci Ratios: AB=CD symmetry (147.00–147.20).
30M: Bullish Crab forming at 146.50, but secondary to larger bearish setup.
Outlook: High-probability short entry at 147.00–147.20 with target 146.20.
3. Elliott Wave Theory
4H: Wave 5 of impulse cycle peaked at 147.056.
Structure: Completed 5-wave sequence from 145.50 → 147.056.
Corrective Phase: ABC pullback targeting 146.20 (Wave A) and 145.80 (Wave C).
1H: Sub-wave (v) of 5 ending at 147.056. RSI divergence confirms exhaustion.
Outlook: Bearish correction to 145.80–146.20 within 24 hours.
4. Wyckoff Theory
Phase: Distribution (after markup from 145.50 → 147.056).
Signs: High volume at 147.056 (supply), upthrust above 147.20 failed.
Schematic: Phase C (markdown) initiating.
1H/30M: Spring at 147.00 failed to hold, indicating weak demand.
Outlook: Break below 147.00 triggers markdown to 146.20.
5. W.D. Gann Theory
Time Theory
24H Cycle: Key reversal windows:
UTC+4: 10:00–12:00 (resistance test), 16:00–18:00 (trend reversal).
Square of 9: 147.056 aligns with 0° angle (resistance).
Square of 9
147.056 → Resistance Angles:
0° (147.00), 90° (147.80), 180° (148.60).
Support: 45° (146.20), 315° (145.40).
Price Forecast: Reversal at 147.00 (0° angle).
Angle Theory
4H Chart: 1x1 Gann Angle (45°) from 145.50 low at 146.20. Price above angle = bullish, but overextended.
1H Chart: 2x1 Angle (63.75°) at 147.056 acting as resistance.
Squaring of Price & Time
Price Range: 145.50 → 147.056 (1.556 points).
Time Squaring: 155.6 hours from 145.50 low → 147.00 resistance (155.6 points ≈ 155.6 hours).
Harmony: 147.056 = Time Cycle Peak (24H from open).
Ranges in Harmony
Primary Range: 145.50–148.00 (250 pips).
50% Retracement: 146.75 (support).
61.8% Retracement: 146.20 (critical support).
Secondary Range: 146.20–147.20 (100 pips).
Key Levels: 146.70 (50%), 146.20 (61.8%).
Price & Time Forecasting
Price Targets:
Short-Term: 146.20 (61.8% Fib, Gann 45° angle).
Extension: 145.80 (100% of prior correction).
Time Targets:
First Reversal: 8–12 hours from open (UTC+4 12:00–16:00).
Second Reversal: 20–24 hours (UTC+4 00:00–04:00 next day).
Synthesized 24H Forecast
Bearish Scenario (High Probability)
Trigger: Break below 147.00 (confirmed by 1H/30M close).
Targets:
T1: 146.20 (61.8% Fib, Gann 45° angle).
T2: 145.80 (Wyckoff markdown, Elliott Wave C).
Timeline:
8–12H: Drop to 146.20 (UTC+4 12:00–16:00).
20–24H: Test 145.80 (UTC+4 00:00–04:00 next day).
Confirmation: RSI <50 on 1H, volume spike >20% average.
Bullish Scenario (Low Probability)
Trigger: Sustained close above 147.20 (Gann 0° angle).
Targets: 147.80 (90° angle), 148.60 (180° angle).
Timeline: 12–16 hours (if 147.20 breaks).

GBPUSD ANALYSISAfter seeing the previous day close and reject an area of resistance and a break below the trendline area of support on the lower timeframe, but with the daily still bearish the 4hr is pushing to the upside. A break of 4hr structure support could be a clear signal that sellers are now pushing price.

EURJPY ANALYSISAfter seeing the previous weekly candle close bearish and the daily from Monday close below the low of the last bearish candle which is a sign of sellers strength, we could expect further sells to continue but a simple retracement on the 4hr back to an area of interest for a potential LH structure point before further sells

Bullishbuyer are entering the market at a key level as you can see price formed a bullish flag broke out now retesting looking to target the monthly high

ENTRY USDJPYDisclaimer:
This is merely a chart-based analytical trading idea and is not considered investment advice. Please manage your risks carefully and conduct your own research before making any trading decisions.

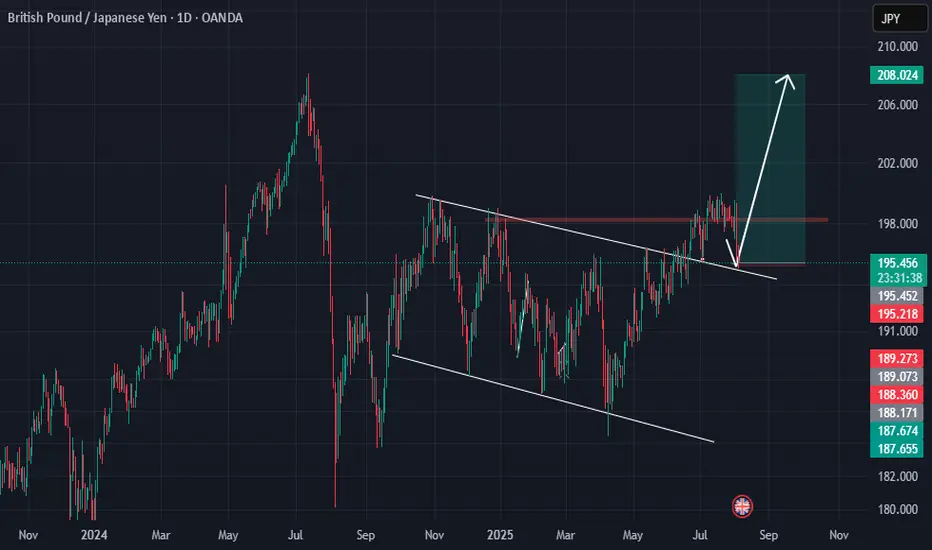
GBPJPY Wave Analysis – 4 August 2025
- GBPJPY reversed from the resistance zone
- Likely to fall to support level 194.00
GBPJPY currency pair recently reversed from the resistance zone between the round resistance level 200.00 (which has been reversing the price from October) and the upper daily Bollinger Band.
The downward reversal from this resistance zone created the daily Japanese candlesticks reversal pattern Bearish Engulfing, which started the active wave c.
Given the predominantly bearish sterling sentiment seen today, GBPJPY can be expected to fall to the next support level 194.00 (target for the completion of the active wave 2).

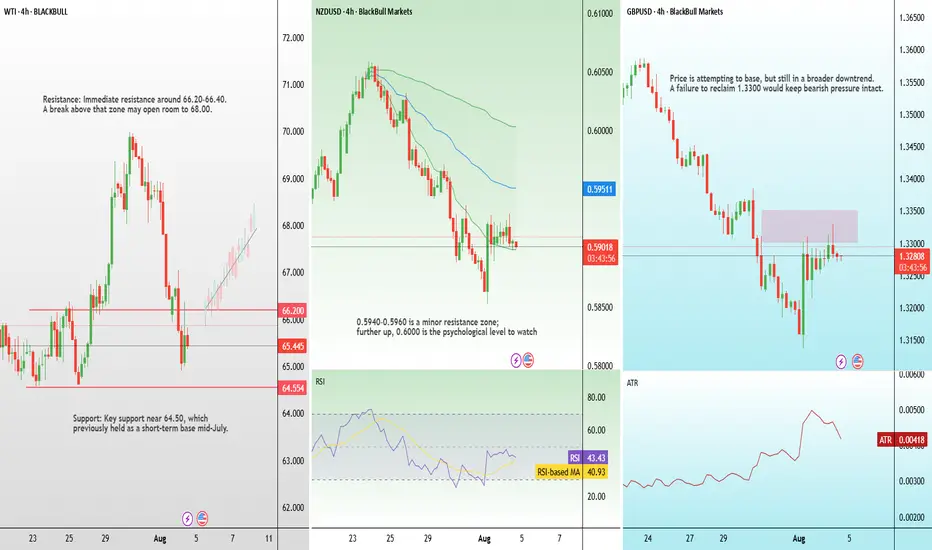
Tariffs, NZ unemployment, and rate cuts: Highlights for the weekAfter a packed calendar last week, this one looks lighter—but there are still key events across major economies likely to drive FX market movement.
India Tariffs and Oil Prices
U.S. President Donald Trump has announced plans to raise tariffs on Indian imports, citing India’s continued purchase and resale of Russian oil. The White House rightly claims this undermines sanctions and helps fund the war in Ukraine. India’s Ministry of External Affairs called the move “unjustified and unreasonable.”
New Zealand Jobs Data — Wednesday
New Zealand’s Q2 unemployment rate is expected to rise from 5.1% to 5.3%, the highest level since late 2015. With inflation back within the RBNZ’s 1–3% target range, a soft labour print could provide the final justification for a rate cut at the next policy meeting.
Bank of England Rate Decision — Thursday
The BoE is widely expected to cut its policy rate by 25 basis points this week, responding to slowing economic momentum despite ongoing inflation concerns. Traders will closely watch Governor Bailey’s remarks to gauge whether this marks the start of a broader easing cycle or a single adjustment.
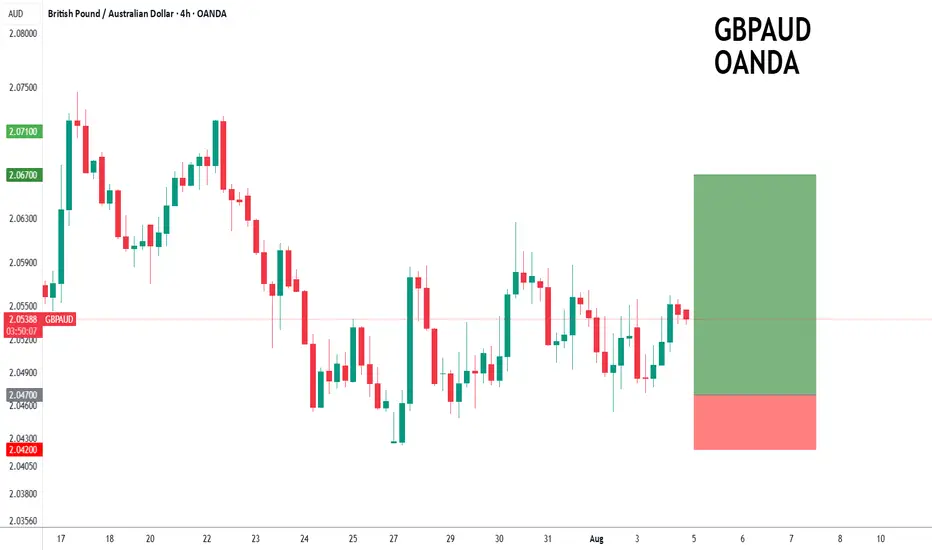
GBPAUD forming a bottom?GBPAUD - 24h expiry
The primary trend remains bullish.
Price action looks to be forming a bottom.
We look for a temporary move lower.
Preferred trade is to buy on dips.
Bespoke support is located at 2.0470.
We look to Buy at 2.0470 (stop at 2.0420)
Our profit targets will be 2.0670 and 2.0700
Resistance: 2.0600 / 2.0670 / 2.0700
Support: 2.0450 / 2.0420 / 2.0390
Risk Disclaimer
The trade ideas beyond this page are for informational purposes only and do not constitute investment advice or a solicitation to trade. This information is provided by Signal Centre, a third-party unaffiliated with OANDA, and is intended for general circulation only. OANDA does not guarantee the accuracy of this information and assumes no responsibilities for the information provided by the third party. The information does not take into account the specific investment objectives, financial situation, or particular needs of any particular person. You should take into account your specific investment objectives, financial situation, and particular needs before making a commitment to trade, including seeking, under a separate engagement, as you deem fit.
You accept that you assume all risks in independently viewing the contents and selecting a chosen strategy.
Where the research is distributed in Singapore to a person who is not an Accredited Investor, Expert Investor or an Institutional Investor, Oanda Asia Pacific Pte Ltd (“OAP“) accepts legal responsibility for the contents of the report to such persons only to the extent required by law. Singapore customers should contact OAP at 6579 8289 for matters arising from, or in connection with, the information/research distributed.
EURUSD SELLEUR/USD appears offered around 1.1550
After failing to break above the 1.1600 barrier, EUR/USD is currently under renewed selling pressure and is testing the mid-1.1500s again on Monday. The US Dollar, on the other hand, rises slightly across the board as investors absorb Friday's big drop after the US employment data and turn their focus to trade.
The daily chart for the EUR/USD pair shows the pair met buyers just ahead of a bullish 100 Simple Moving Average (SMA) currently at around 1.1370. A flat 20 SMA, in the meantime, provides resistance at around 1.1640, the level to overcome to turn bullish. Finally, technical indicators corrected oversold conditions, but lost their upward strength just below their midlines, suggesting buyers are still on the sidelines.
In the 4-hour chart, the EUR/USD pair is range-bound, although there are no signs of a potential slide. The 20 SMA lost its bearish strength and turned flat in the 1.1480 area, while technical indicators remain directionless well above their midlines. The pair flirted with the 1.1600 level during Asian trading hours, with gains beyond the level turning the risk towards the upside in the near term.
SUPPORT 1.15387
SUPPORT 1.14950
SUPPORT 1.14520
RESISTANCE 1.16032
RESISTANCE 1.15832

EURCAD What Next? BUY!
My dear friends,
My technical analysis for EURCAD is below:
The market is trading on 1.5784 pivot level.
Bias - Bullish
Technical Indicators: Both Super Trend & Pivot HL indicate a highly probable Bullish continuation.
Target - 1.5907
About Used Indicators:
A pivot point is a technical analysis indicator, or calculations, used to determine the overall trend of the market over different time frames.
Disclosure: I am part of Trade Nation's Influencer program and receive a monthly fee for using their TradingView charts in my analysis.
———————————
WISH YOU ALL LUCK

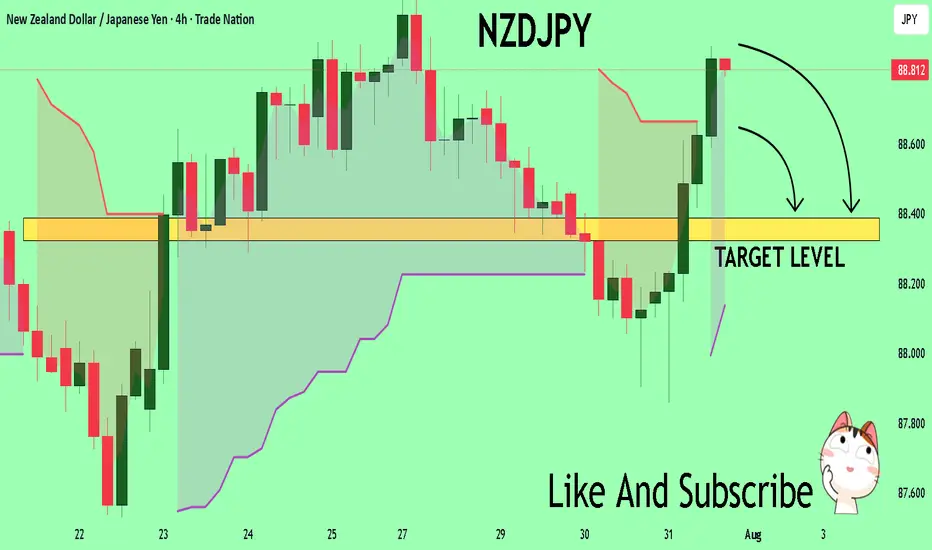
NZDJPY The Target Is DOWN! SELL!
My dear friends,
Please, find my technical outlook for NZDJPY below:
The price is coiling around a solid key level - 88.806
Bias - Bearish
Technical Indicators: Pivot Points Low anticipates a potential price reversal.
Super trend shows a clear sell, giving a perfect indicators' convergence.
Goal - 88.388
About Used Indicators:
The pivot point itself is simply the average of the high, low and closing prices from the previous trading day.
Disclosure: I am part of Trade Nation's Influencer program and receive a monthly fee for using their TradingView charts in my analysis.
———————————
WISH YOU ALL LUCK
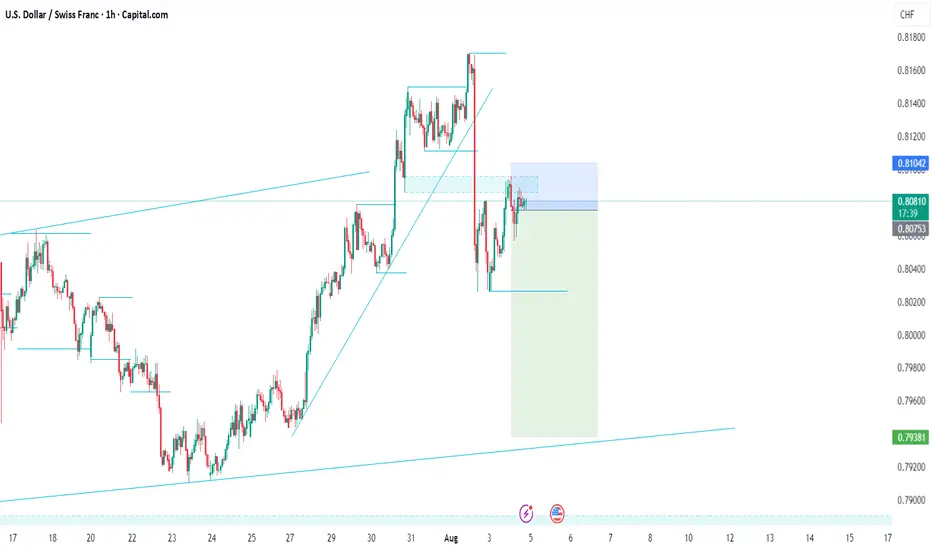
USDCHF SHORT IDEA FULL BREAKDOWNUSD/CHF is flashing a strong bearish signal from both a macro and sentiment perspective.
✅ Bearish USD Drivers:
FOMC Pivot Watch: July meeting minutes hinted at potential rate cuts before year-end due to inflation moderating and soft jobs data.
Rising Swiss Franc Demand: CHF is benefiting from safe haven flows amid escalating tensions in Eastern Europe and shaky U.S. equity markets.
Swiss CPI Stable: Inflation is in check, allowing SNB to maintain their policy stance without pressure.
Institutional traders are reducing their exposure to the U.S. dollar, while retail traders are net long USDCHF — a classic contrarian bearish signal. Seasonality also favors Swiss Franc strength in August. On the macro side, U.S. data is underwhelming: job growth has slowed, services PMI is soft, and inflation metrics (CPI, PCE) are cooling. This has increased expectations for a Fed rate cut later in the year. Meanwhile, the Swiss National Bank remains stable with no urgency to ease policy. Combined with global risk-off sentiment, capital is flowing into CHF, giving it an added edge over the dollar.

USDJPY M15 Pending SELL Setup 🧭 1. Market Structure (15M + Higher TF Context)
Recent Shift: Bullish structure broke down with an aggressive bearish move (clear BOS).
Consolidation Zone (~147.45–148.17): Price accumulated after the impulsive drop.
Now: Currently trading just above 147.00, testing intraday support.
✅ Structure:
Prev. Highs swept (liquidity grab at top), followed by impulsive drop.
Price formed a bearish flag, broke down, and is now retesting the lower zone.
🗃️ 2. Liquidity Zones
🔴 Buy-side Liquidity Grab: Fakeout to the upside just before the dump — textbook inducement.
🔵 Sell-side Liquidity: Now building under 147.00, with lows being swept but no follow-through (yet) → potential liquidity engineering.
⚠️ If price closes below 146.90, sellers may step in with conviction.
🕯️ 3. Candlestick Behavior
Inside the consolidation box, candles show:
Weak bullish momentum
No strong engulfing or continuation
On the breakout, large bearish candles with follow-through, showing institutional intent
Now: Wicks on both sides → market indecision, likely accumulation before expansion
🔍 4. Chart Patterns Identified
🏁 Bear Flag: Formed after breakdown → continuation pattern
📦 Consolidation box (~147.0–148.15): Liquidity build-up
📉 Descending Triangle Potential: Multiple touches at support (~147.00) with lower highs — bearish pressure building
🔢 5. Fibonacci Reference (Swing High ~149.10 to Swing Low ~146.90)
Level Price Notes
0.382 ~147.70 Rejected here
0.5 ~148.00 Mid-consolidation box
0.618 ~148.25 Price failed to touch
📉 Bias stays bearish unless 148.25 is breached & closed above with volume.
📌 6. Trade Setup
📍 Pending Sell Setup
🔄 Alternative Scenario
📍 Invalidation & Buy Scenario
Only if strong bullish candle closes above 148.20
That would flip structure bullish
But current order flow does not favor this yet.
🧠 Final Notes:
Wait for clear breakout and candle close below 146.90 — no impulse entries inside the range.
Use 1M/5M price action to fine-tune entries once breakout occurs (look for break of structure + BOS on LTF).
Watch Tokyo/London open for real volume to kick in.

USDCHF SELLWe have officially gotten a change of trend as proven by the transition from a sequence of higher highs and higher lows to a lower low and lower high. Stacked on top of this sequence is a pullback for a retest of a key level confirming our setup.
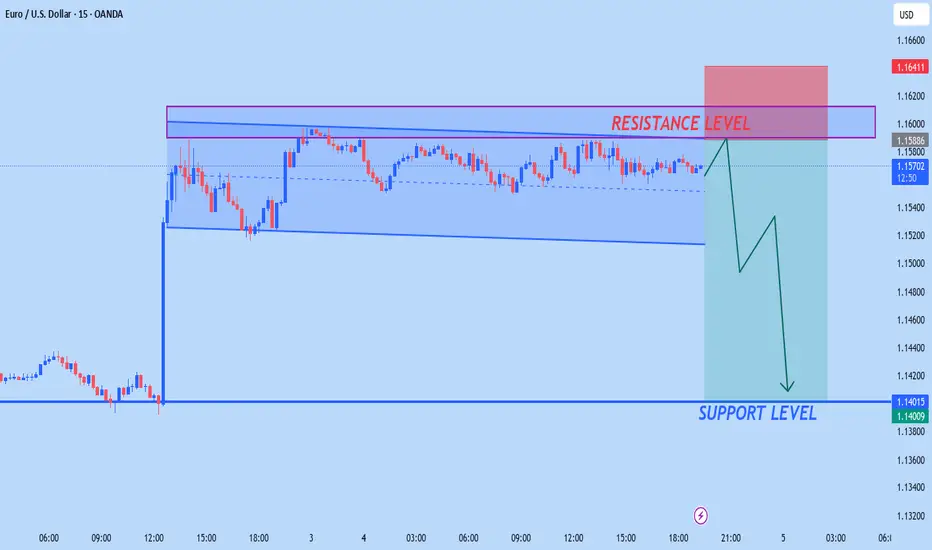
EUROUSD WILL FALLING SOONaccording to M15 analysis EUROUSD market running in side wave from today now market is almost is resistance level
if you want to sell you have good opportunity to go sell from RESISTANCE ZONE
TRADE AT YOUR OWN RISK
USD/JPY 30Min Engaged ( Bullish Reversal Entry Detected )Time Frame: 30-Minute Warfare
Entry Protocol: Only after volume-verified breakout
🩸Bullish Reversal : 146.850
➗ Hanzo Protocol: Volume-Tiered Entry Authority
➕ Zone Activated: Dynamic market pressure detected.
The level isn’t just price — it’s a memory of where they moved size.
Volume is rising beneath the surface — not noise, but preparation.
🔥 Tactical Note:
We wait for the energy signature — when volume betrays intention.
The trap gets set. The weak follow. We execute.

Choppy week NZDUSD BuyHello traders I hope you are doing well
As you can see the inverted head and shoulders.
Multiple touches on the top trendline.
Lets just be patient and let the market come to us.
