USDCAD H1 | Bullish Bounce Off Pullback SupportBased on the h1 chart analysis, we could see the price fall to our by entry level at 1.3680, which is a pullback support that aligns with the 38.2% Fibonacci retracement.
Our stop loss is set at 1.3659, which is a pullback support that is slightly above the 78.6% Fibonacci retracement.
Our take profit is set at 1.3736, which is a pullback resistance that is slightly below the 61.8% Fibonacci retracement.
High Risk Investment Warning
Stratos Markets Limited (
Forex market

NEUTRALfor theprice to be bought and being sold, we must see it at premium or discount of levels.
Now GBPJPY is now obeying trendline levels aas shown, we must wait until it drops to the discounted level where it may
a) break the trend line and sell
b) it may false break and buy
c) it may bounce above the trendline.
i feel to wait.
Remember, i am not your financial advisor, trade wisel

USDCHF H1 | Potential Bullish RiseBased on the H1 chart analysis, we can see that the price has bounced off our buy entry level at 156.31, which is a pullback support.
Our stop loss is set at 155.76, which is a pullback support.
Our take profit is set at 157.27, which is a pullback resistance that is slightly below the 161.8% Fibonacci extension.
High Risk Investment Warning
Stratos Markets Limited (

EURUSD 1H Intraday AnalysisEURUSD 1H Intraday Analysis: Holding 1.173 Demand, Upside Path Toward 1.180
EURUSD is sitting on a clean 1H demand/reclaim area around 1.173, after a steady pullback from the 1.180 swing high. The chart shows a classic “support test + bounce attempt” structure: if buyers can keep price accepted above 1.173, the next rotation targets the mid-range first, then a retest of 1.180.
Today’s game plan is straightforward: trade the 1.173 decision zone, and let price confirm whether this is a continuation bounce or a breakdown setup.
Key Support and Resistance Levels (Most Important Today)
Support
1.1730–1.1740 (Main demand / decision zone): the green box on your chart, must hold for bullish continuation.
1.1700 (Major floor): prior swing low; break and hold below shifts bias bearish.
1.1685–1.1665 (Deeper support): only in play if 1.170 fails cleanly.
Resistance
1.1760–1.1770 (First supply / pullback cap): first area to react during the bounce.
1.1780 (Structure level): break above improves odds of a run to highs.
1.1800 (Key resistance): top line on the chart, major target and likely sell-response area.
Fibonacci Confluence (Swing High 1.180 to Swing Low 1.170)
Using the visible swing from 1.180 → 1.170, the most useful intraday Fib cluster aligns well with the current structure:
0.382: ~1.1738 (right inside the 1.173 demand area)
0.50: ~1.1750 (first magnet if bounce holds)
0.618: ~1.1762 (key mid resistance)
0.786: ~1.1779 (often the “last gate” before highs)
This makes 1.173 the pivot: if it holds, Fib levels above become natural step targets.
Trendline Read (Market Structure)
The move down from the 1.180 peak forms a short-term descending pressure line (lower highs).
Bulls need a break and hold above 1.176–1.178 to confirm the trendline break and shift the intraday structure back to bullish.
If price keeps rejecting under 1.176–1.178, expect choppy rotations back into 1.173.
EMA + RSI Checklist (Confirmation Tools)
EMA (20/50/200 approach)
If price is below EMA50 on 1H, rallies often stall at resistance first (1.176–1.178).
Bullish continuation quality increases if:
price reclaims EMA20, then
holds above EMA50 on retests (support flip behavior).
If price rejects repeatedly at EMA20/EMA50, treat bounces as corrective.
RSI (1H)
Bullish confirmation: RSI reclaims and holds above 50 during pullbacks.
Bearish continuation: RSI stays heavy under 50, especially if 1.173 breaks.
High-Probability Trade Plans (Intraday)
Plan A: Buy the 1.173 Demand Retest (Best Risk-to-Reward)
Entry idea: 1.1730–1.1740 after bullish rejection (wicks + stronger closes)
Invalidation: below 1.1700
Targets:
TP1: 1.1750
TP2: 1.1762–1.1770
TP3: 1.1780
TP4: 1.1800
Plan B: Breakout Buy Toward 1.180 (Confirmation Setup)
Trigger: 1H close above 1.1780, then a retest that holds
Invalidation: back below 1.1760 after the breakout
Targets:
TP1: 1.1800
Extension: only if momentum is strong and 1.180 breaks cleanly
Plan C: Sell Rejection Into 1.176–1.178 (If Bounce Looks Weak)
Trigger: rejection wicks + failure to close above 1.1762/1.1780, RSI unable to hold 50
Invalidation: close above 1.1780 with acceptance
Targets:
TP1: 1.1740
TP2: 1.1730
TP3: 1.1700
Plan D: Breakdown Sell Below 1.170 (Continuation Bearish)
Trigger: clean break and 1H acceptance below 1.1700
Invalidation: reclaim back above 1.1700
Targets:
TP1: 1.1685
TP2: 1.1665
What to Watch During the Session
If 1.173 holds and price prints higher lows: expect step-by-step upside through 1.175 → 1.1762 → 1.178 → 1.180.
If 1.173 fails and price accepts below 1.170: the bullish idea is invalidated and the path opens lower.
The cleanest momentum signal today is a reclaim and hold above 1.178.
Risk Note
This is a technical analysis perspective for education, not financial advice. Intraday conditions can turn volatile quickly, so keep risk fixed per trade and avoid forcing entries in the middle of the range.
If this EURUSD level map helps, follow and save the idea so you can reference the zones and session plans later.

TheGrove | NZDUSD buy | Idea Trading AnalysisNZDUSD is falling towards a support level which is a pullback support and could bounce from this level to our take profit.
We expect a decline in the channel after testing the current level which suggests that the price will continue to rise
Hello Traders, here is the full analysis.
I think we can soon see more fall from this range! GOOD LUCK! Great BUY opportunity NZDUSD
I still did my best and this is the most likely count for me at the moment.
-------------------
Traders, if you liked this idea or if you have your own opinion about it, write in the comments. I will be glad 🤝

JPYUSD 1H Technical AnalysisJPYUSD 1H Technical Analysis: Range Compression Near 0.00638, Bounce-Then-Drop Scenario in Play
JPYUSD (Japanese Yen vs U.S. Dollar) on the 1H chart is moving in a tight, choppy range after a strong impulse earlier in the session. Price is now sitting directly on a clearly defined base support around 0.00638, while multiple failed pushes higher suggest the market is still in distribution mode.
The structure on your chart highlights a common end-of-range behavior: a controlled rebound (liquidity build) into resistance, followed by a sharp dump back toward the range floor. Today’s edge is to trade the boundaries and wait for confirmation at the key levels.
Market Structure and Price Behavior (1H)
After the initial flush, price recovered and rotated into a sideways structure.
Multiple swing points formed around the same mid-band area, showing heavy supply absorption on rallies.
The most recent candles are compressing near support, signaling a decision point: either a short rebound to rebalance, or direct continuation lower if support breaks.
This is a classic “range compression before expansion” environment. Expect wicks and stop-runs around the marked lines.
Key Support and Resistance Levels (Based on the Chart)
Support Zones
0.006385–0.006380 (Primary support / decision base): current holding area. As long as price holds above it, a rebound is possible.
0.006370–0.006365 (Range floor target): the next major downside magnet if 0.00638 fails.
0.006360 (Major low / liquidity pool): previous extreme. If reached again, it becomes the main “reaction-or-break” zone.
Resistance Zones
0.006395–0.006400 (First rebound cap): near-term resistance where bounce attempts often stall.
0.006410–0.006420 (Major supply): upper boundary of the recent distribution. Strong rejection probability on first touch.
Fibonacci Map (How to Frame the Range)
Use Fibonacci on the most recent visible swing (from the last local high near 0.00641–0.00642 down to the base near 0.00638):
0.382–0.50 retracement: typically lands around 0.006395–0.006402 (matches the first resistance zone)
0.618 retracement: often aligns with 0.00641 (matches upper supply boundary)
If price cannot reclaim the 0.50–0.618 area, rallies are usually corrective and favor “sell-the-rip” logic.
This Fib alignment supports a tactical plan: bounce into resistance first, then watch for a reversal signal.
Trendline and Structure (Simple Read)
A clean way to trade this is to draw a short-term descending trendline across the recent lower highs. If price keeps respecting that line while holding below the 0.00640–0.00641 band, it confirms sellers are still controlling the rebound.
The bullish case only becomes valid if price reclaims 0.00641 and holds it with acceptance (multiple closes, not just a wick).
EMA and RSI Confirmation (Intraday Rules)
EMA
When price is below the faster EMAs (EMA20/EMA50 on 1H), rebounds into resistance are often corrective.
Bullish continuation improves only if price:
reclaims EMA20, then
holds above EMA50 while building higher lows.
If EMAs are stacked down, treat bounces as short-lived.
RSI
RSI pushing back above 50 supports continuation higher.
RSI failing under 50 during a rally into 0.00640–0.00641 increases rejection odds.
If support breaks and RSI stays heavy, downside continuation becomes the higher-probability path.
Intraday Trade Plans (Clean Triggers, Clear Invalidations)
Plan A: Range Long From Base Support (Scalp-to-Swing Hybrid)
Best when price prints rejection wicks and holds above the base.
Entry idea: 0.006385–0.006380 after bullish confirmation
Invalidation: 1H acceptance below 0.006370
Targets:
TP1: 0.006395
TP2: 0.006400
TP3: 0.006410–0.006420 (only if momentum is strong)
Key note: This is a “location trade.” If price bounces but cannot reclaim 0.00640, reduce exposure and protect.
Plan B: Sell-the-Rally Into Supply (Best If Bounce Looks Weak)
Best when the rebound shows weak closes and RSI cannot hold 50.
Entry idea: rejection signal inside 0.006400–0.006420
Invalidation: 1H acceptance above 0.006420
Targets:
TP1: 0.006385
TP2: 0.006370–0.006365
TP3: 0.006360
This aligns with the scenario drawn on your chart: rebound into liquidity, then drop to the floor.
Plan C: Breakdown Sell Below 0.006370 (Continuation Setup)
Best when support snaps and price re-tests it from below.
Trigger: clean break + retest failure under 0.006370
Invalidation: reclaim back above 0.006380
Targets:
TP1: 0.006365
TP2: 0.006360
Extension: only if downside momentum accelerates
What to Watch During the Session
If price holds the 0.00638 base and starts printing higher lows, expect a controlled rebound toward 0.00640 first.
The zone 0.00640–0.00642 is the key decision ceiling. If price rejects there, the drop scenario becomes much more likely.
A clean loss of 0.00637 shifts bias bearish and opens the path back to 0.00636.
Risk Note
This is a technical analysis view for education, not financial advice. Tight ranges can create false breaks and wicks. Keep risk fixed per trade and avoid chasing price in the middle of the range.
If you want more 1H level maps like this using Fibonacci, trendlines, EMA, and RSI confirmation, follow and save this idea so you can reference the key zones for the next session.

Potential bullish rise?CAD/CHF has reacted off the pivot and could rise to the 1st resistance.
Pivot: 0.57802
1st Support: 0.57621
1st Resistance: 0.58186
Disclaimer:
The opinions given above constitute general market commentary and do not constitute the opinion or advice of IC Markets or any form of personal or investment advice.
Any opinions, news, research, analyses, prices, other information, or links to third-party sites contained on this website are provided on an "as-is" basis, are intended to be informative only, and are not advice, a recommendation, research, a record of our trading prices, an offer of, or solicitation for, a transaction in any financial instrument and thus should not be treated as such. The information provided does not involve any specific investment objectives, financial situation, or needs of any specific person who may receive it. Please be aware that past performance is not a reliable indicator of future performance and/or results. Past performance or forward-looking scenarios based upon the reasonable beliefs of the third-party provider are not a guarantee of future performance. Actual results may differ materially from those anticipated in forward-looking or past performance statements. IC Markets makes no representation or warranty and assumes no liability as to the accuracy or completeness of the information provided, nor any loss arising from any investment based on a recommendation, forecast, or any information supplied by any third party

EURCAD CONTINUATION Technically:
EURCAD printing cup&handle
EURCAD did not print bullish divergence
EURCAD printed buying zone
EURCAD bullish on daily

Bearish drop off?NZD/JPY has rejected off the pivot and could potentially drop to the 1st support.
Pivot: 90.86
1st Support: 89.90
1st Resistance: 91.35
Disclaimer:
The opinions given above constitute general market commentary and do not constitute the opinion or advice of IC Markets or any form of personal or investment advice.
Any opinions, news, research, analyses, prices, other information, or links to third-party sites contained on this website are provided on an "as-is" basis, are intended to be informative only, and are not advice, a recommendation, research, a record of our trading prices, an offer of, or solicitation for, a transaction in any financial instrument and thus should not be treated as such. The information provided does not involve any specific investment objectives, financial situation, or needs of any specific person who may receive it. Please be aware that past performance is not a reliable indicator of future performance and/or results. Past performance or forward-looking scenarios based upon the reasonable beliefs of the third-party provider are not a guarantee of future performance. Actual results may differ materially from those anticipated in forward-looking or past performance statements. IC Markets makes no representation or warranty and assumes no liability as to the accuracy or completeness of the information provided, nor any loss arising from any investment based on a recommendation, forecast, or any information supplied by any third party

EURUSD Is Not Breaking Out Yet — It’s Still Balancing Hello everyone,
On the H1 timeframe, the key focus right now is not an immediate bullish breakout, but the fact that EURUSD remains locked inside a clearly defined range, rotating between strong resistance and a well-respected support base.
After multiple attempts into the upper resistance zone around 1.1800–1.1820, price has repeatedly failed to gain acceptance above this area. Each push higher has been met with selling pressure, resulting in sharp rejections and a return back into the range. This behavior confirms that supply remains active overhead and that buyers are not yet strong enough to force a directional expansion.
From a structural perspective, the market is printing overlapping highs and lows, which is a classic sign of balance rather than trend. There is no clean sequence of higher highs to validate an uptrend, and at the same time, sellers have been unable to drive price decisively below support. This tells us that both sides are active, but neither is in control.
The support zone around 1.1750–1.1760 continues to act as a demand area. Every test into this zone has been absorbed, leading to short-term rebounds rather than continuation lower. As long as this support holds, downside risk remains contained, and the market stays in a consolidation phase.
The projected path on the chart reflects this logic well: a possible dip into support to test demand, followed by another rotation higher toward resistance. Only a clean breakout and acceptance above the resistance zone would confirm bullish continuation and open the door for a move toward higher levels. Conversely, a decisive breakdown below support would invalidate the range structure and shift the bias bearish.
Until one of those scenarios plays out, EURUSD is not trending. It is rebalancing and building liquidity inside the range, and patience remains essential.
Wishing you all effective and disciplined trading.

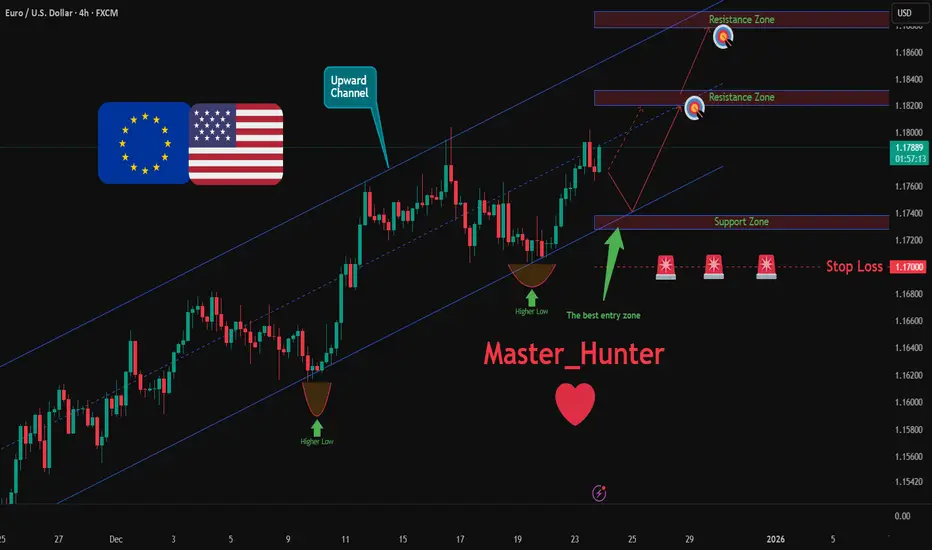
EURUSD: Bullish Push to 1.1878?As the previous analysis worked exactly as predicted, FX:EURUSD is eyeing a bullish breakout on the 4-hour chart , with price rebounding from higher lows in an upward channel after a breakout candle, converging with a potential entry zone that could ignite upside momentum if buyers push through short-term resistance amid recent volatility. This setup suggests a continuation opportunity in the uptrend, targeting higher levels with overall risk-reward exceeding 1:3.5 .🔥
Entry between 1.1728–1.1738 for a long position. Targets at 1.1820 (first), 1.1878 (second). Set a stop loss at a daily close below 1.1700 , yielding a risk-reward ratio of more than 1:3.5 in total . Monitor for confirmation via a bullish candle close above entry with rising volume, leveraging the pair's momentum in the channel.🌟
Fundamentally , EURUSD is trading around 1.178 in late December 2025, with key US Dollar events this week potentially weakening USD if data underperforms, favoring euro strength. For the US Dollar, Tuesday, December 23 at 05:30 AM UTC brings GDP Growth Rate QoQ Q3 (forecast 3.3%, previous 4.3%), Core PCE Prices QoQ Q3 (forecast 2.9%, previous 2.9%), PCE Prices QoQ Q3 (forecast 2.8%, previous 2.8%), and Real Consumer Spending QoQ Q3 (previous 3.5%); followed by CB Consumer Confidence DEC at 07:00 AM UTC (forecast 91, previous 89.1). No major high-impact events for the Euro this week, leaving the pair sensitive to USD catalysts. 💡
📝 Trade Setup
🎯 Entry (Long):
1.1728 – 1.1738
(Entry at these levels is valid with proper risk & capital management.)
🎯 Targets:
• 1.1820 (TP1)
• 1.1878 (TP2)
❌ Stop Loss:
• Daily close below 1.1700
⚖️ Risk-to-Reward:
• > 1:3.5 (total)
💡 Your view?
Does EURUSD defend the channel and push toward 1.1878 — or do we see deeper consolidation before continuation? 👇
GBPUSD SELLSI am going to short GBPUSD based on a break of structure on the daily time frame. I am risking 1% on this trade.

USDJPY : RANGE IDENTIFIED The pair has been sideways since the holidays started...we are about to complete these and there the market is eager to return to the normal course of movement.
Gear up we are going to have a nice swing to the range low of the pd.
the idea is my summary of the logic.
GOOD TRADING

possibility of uptrend Given the price behavior within the current support range, a trend change will be likely. Otherwise, the continuation of the corrective trend to the next support levels will be possible.

GBP/USD Bearish Reversal and Downside Targets AnalysisThe GBP/USD 4-hour chart shows signs of a potential bearish reversal after an extended bullish trend. Price has been trading within a marked supply zone near recent highs and is now showing rejection from this area. The upward trendline has been tested, and price action is struggling to maintain bullish momentum. The Ichimoku cloud suggests weakening support as price dips back into the cloud, indicating possible trend exhaustion. Failure to reclaim the upper resistance zone increases the likelihood of a corrective move lower. A bearish continuation is anticipated if price remains below the highlighted resistance. The first downside target is 1.34275, followed by a deeper move toward 1.33840. If bearish momentum strengthens, an extended decline toward the third target at 1.32890 could unfold.
If you found this XAUUSD analysis helpful, don’t forget to LIKE 👍 and COMMENT 💬!

USDCHF SELL 0.7973On the 4-hour chart, USD/CHF has stabilized and rebounded, with bulls currently in control in the short term. Attention should be paid to the area around 0.7973, which is a potential shorting entry point for a bearish bat pattern.

GBPAUD Trading Idea – Dreams FXDate: December 31, 2025 | Timeframe: 1-Hour
Market Overview & Bias
GBPAUD has been in a downtrend within a descending channel, forming consistent lower highs and lower lows. Price recently swept the channel lows, trapped early sellers, then retraced into the supply zone (~2.01300–2.01600) where heavy rejection is now occurring.
Current candles show strong bearish pressure pushing lower. Bias: Strongly bearish. Single trade setup (Sell) with two scaled take profits — reversal point uncertain, so we scale out inside the demand zone.
Key Technical Confluence
Supply Zone : ~2.01300–2.01600 – multiple rejections (SL at top/end of pink box).
Demand Zone : ~2.00400–2.01000 – next major support (two TPs inside this zone).
Descending Channel: Upper trendline capping upside perfectly.
Single Trade: Bearish Continuation (Sell)
Trade Type: Channel rejection continuation (Sell)
Entry: Sell on current bearish momentum or sell limit inside pink supply zone
Stop Loss: Top/end of pink box (~2.01750–2.01800)
Take Profit (Scaled):
TP1 → Mid/upper teal zone (~2.01000–2.01100) → ~1:2 RR (partial close, lock profit)
TP2 → Bottom/end of teal box (~2.00400–2.00500) → ~1:4 RR (remainder, max target before possible reversal)
Risk-Reward: Overall 1:3+ (blended after scaling).
Risk Management
Risk 0.5–1% total. Close 50% at TP1, move stop to breakeven, let rest run to TP2. Trail if downside momentum stays strong beyond TP1.
Why This Setup Has Edge
Low sweep trapped buyers early, retracement induced longs, now clear distribution and rejection at supply. We don’t know exact reversal depth, so scale TPs inside the teal demand zone — secure early gains, chase the full move. Market whispering strong downside continuation.
Note: Trading involves substantial risk. Past performance is not indicative of future results. Always use proper risk management.
Dreams FX

GBP/USD Trading Idea – Dreams FXDate: December 31, 2025 | Timeframe: 30-Minute
Market Overview & Bias
GBP/USD is in a downtrend with clear lower highs, multiple CHoCH and BOS confirming seller control. Price swept lows, trapped early sellers, retraced into the supply zone (~1.35200–1.35400), and is now rejecting heavily.
Primary Bias: Bearish continuation.
Plan: Buy the low sweep/pullback into demand (swing buy), then sell from the top (supply rejection) for the main move lower.
Key Technical Confluence
Demand Zone : ~1.34500–1.34900 – fresh support after low sweep (buy zone).
Supply Zone : ~1.35200–1.35400 – strong overhead resistance (sell zone, SL at top/end of pink box).
Structure: Clean descending trend with breaks of structure.
First Trade: Swing Buy (Buy the Dip)
Trade Type: Swing buy from demand
Entry: Buy limit inside teal demand zone (~1.34600–1.34800) on pullback/retest
Stop Loss: Below demand (~1.34300–1.34400)
Take Profit: Scale out near supply (~1.35100–1.35200) → ~1:2–3 RR
Goal: Ride the retracement higher, lock profit before rejection.
Main Trade: Sell from the Top (Primary Bearish Continuation)
Trade Type: Trend continuation sell from supply rejection
Entry: Sell on clear rejection inside pink supply zone (after buy hits TP or on direct rejection)
Stop Loss: Top/end of pink box (~1.35500–1.35600)
Take Profit (Scaled):
TP1 → Mid demand retest (~1.34800–1.34900) → ~1:2 RR (partial close)
TP2 → Bottom/end of teal box (~1.34500) → ~1:4 RR (main target)
Risk-Reward: Overall 1:3+ on the sell (high reward in trend direction).
Risk Management
Risk 0.5–0.8% on the buy (swing position).
Risk 0.8–1% on the main sell.
Close buy fully or partially at supply to free margin for the sell. Trail sell aggressively after TP1.
Why This Setup Has Edge
Classic manipulation: sweep lows → induce buys → distribute at supply → continue downtrend. Buy the dip for a solid retracement play, but the real money is selling from the top into the next leg lower. Market whispering bearish — play both sides smartly.
Note: Trading involves substantial risk. Past performance is not indicative of future results. Always use proper risk management.
Dreams FX

Clean Rejection from Resistance on GBPUSDPrice reacted cleanly from the marked sell zone, confirming strong bearish pressure at a key supply area. After multiple rejections and failure to hold above resistance, GBPUSD shifted momentum to the downside. The move followed the expected structure, breaking minor support and continuing lower with healthy bearish candles.
The downside objective at the highlighted target zone has now been successfully reached, validating the sell bias from the supply area. This move aligns with overall market structure and intraday momentum, making it a well-respected technical reaction.
Traders can now look for:
Partial or full profit booking at target
Possible short-term pullback or consolidation from the target zone
Fresh setups only after confirmation, avoiding late entries
This idea demonstrates disciplined zone-based trading with clear risk-to-reward execution.

Sell Opportunity USDCHF is now showing a potential sell opportunity as price reacts strongly to the same key resistance zone where the previous buy TP was hit. With bullish momentum slowing and rejection visible at this level, sellers may step in for a corrective move lower. This setup favors a sell from resistance, targeting downside continuation with a clear invalidation above the zone for controlled risk.

Finally some ShortingThis is not financial advice and I'm not an expert by any stretch.
Finally some movement towards where i want to be, in my opinion USD should be at 1.1550 level without any news

EUR/USD – 1H Technical Outlook : Bullish BiasThe pair is currently trading around 1.1742, showing signs of stabilization after a recent decline. Price is approaching a Rally-Base-Rally demand zone near 1.1738, which aligns with a short-term support area. This zone could act as a springboard for bullish momentum if buyers step in.
Key observations:
Significant Support: 1.1707 remains a critical level; a break below could invalidate the bullish scenario and open the door for deeper retracement.
Upside Target: The chart highlights buy-side liquidity around 1.1808, suggesting potential for a liquidity grab if bullish momentum resumes.
Market Structure: Current price action indicates a corrective move within an overall bullish framework. A strong reaction from the demand zone could trigger a rally toward the liquidity pool.
Trading Bias:
Bullish scenario: Look for confirmation of demand at 1.1738–1.1740. A sustained bounce could target 1.1808.
Bearish scenario: Failure to hold above 1.1707 would shift bias toward further downside.
Risk management remains key—watch for rejection signals or strong volume confirmation before entering.

USD/JPY 160 is the Big Deal for 2026Even with the US Dollar showing considerable weakness in DXY and against many major currencies like the Euro or British Pound, USD/JPY is roughly flat on the year.
After coming into 2025 riding a wave of strength a dramatic sell-off developed in the first quarter of the year, with the pair plunging down for another test of the 140.00 handle. But, like the two tests before that, sellers suddenly shied away, and prices began to push-higher although it wasn't until later in the year that buyers were able to push a bullish trend.
And then, in H2 of 2025, even as USD held near lows, USD/JPY rallied and another shot of life showed up in October on the heels of Japanese elections. The pair even rallied through the December rate hike, and this sets the stage for an interesting tangle as we go into 2026.
The recently elected Japanese government was very much supported by a pro-growth economic policy that seems to run counter to rate hikes and policy tightening, but one look at Japanese government bonds highlights that we may soon be nearing a point where the BoJ has to decide whether to defend Japanese bond rates or defend the Yen. Hiking rates more aggressively could possibly slow the run in yields, but then threatens a JPY reversal, which could have some pretty considerable collateral damage. Or, taking a looser approach to policy could allow the Yen to continue to sell-off, and USD/JPY to continue to break out, which can also drive Japanese borrowing costs higher.
There's also the Finance Ministry to consider, as it's their task to monitor the currency and as we've seen multiple times in the now almost five years of USD/JPY strength, they can and will order the Bank of Japan to intervene to stem the bleeding in JPY. This doesn't necessarily 'work,' however, as we can see from the example in April of 2024, when the BoJ intervened following a test of the 160.00 handle, only for buyers to bid the pullback and drive the pair right back above the big figure just weeks later.
The example a few months later, in July, shows what the consequence can be, as another intervention hit on the morning of a below-expected CPI print, and that sent the pair spiraling lower, along with many other global risk markets. It didn't take long for the headlines to make the connection, alleging the sell-off in US equities as a repurcussion of the unwinding Japanese Yen carry trade. This helped to produce the third-highest spike in the VIX index - ever - on the morning of August 5th, 2024.
So there's not really an easy path forward here for the BoJ, or for Japanese markets in 2026. But, for now, the look is at what happens after that next test of 160.00, and whether the MoF orders the BoJ to fire a shot across the bow to try to shake speculators out of long USD/JPY positions. - js
