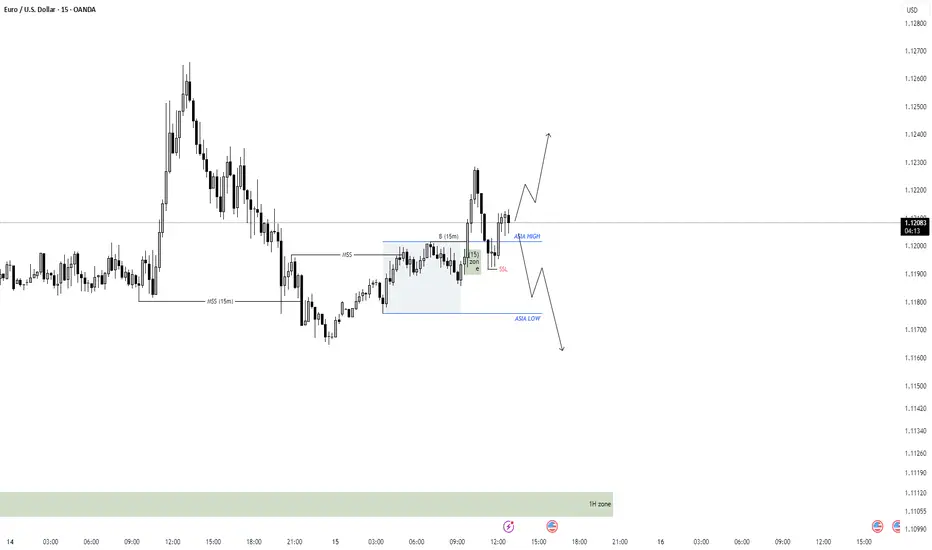
EURUSD Daily analysisOANDA:EURUSD
1H : Bullish MSS + OB + IMB 15m : Bullish BOS + OB + IMB
The trend is up and right now we have hit a 15 minute bullish ob. You can enter a buy trade with confirmation. If the 15 minute zone breaks, we will wait for a sell trade in the newly formed zone. I am 100% sure that it will move down to the 1 hour zone.
Forex market
EURUSD_1DEurodollar Times Daily Five Elliott Waves Up Maintaining Wave 4 Low at 1.1111 Important With this support, the uptrend for Wave 5 at 1.1717 and 1.1881

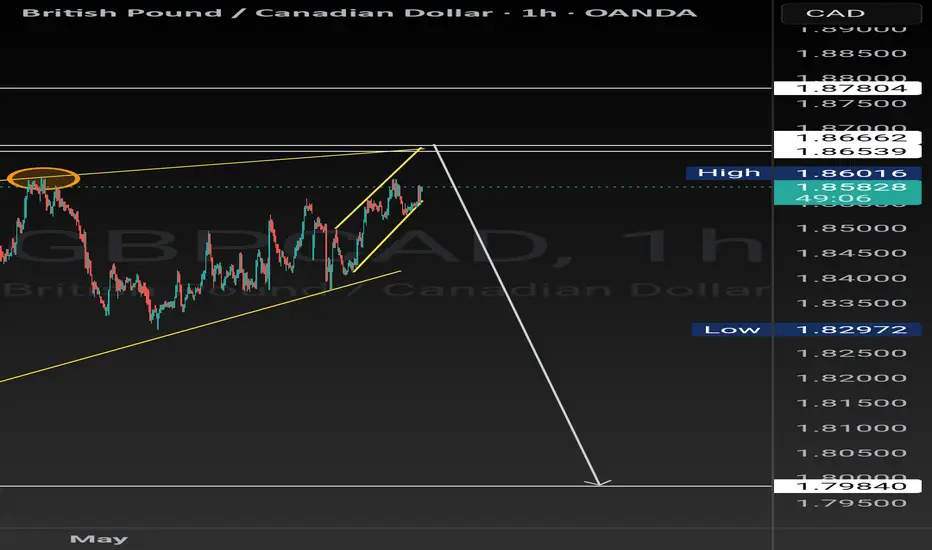
GBPCAD1. Possibility of double top
2. 4hour timeframe divergence resistance if waiting for 3rd touch
3. 1hour 123 channel is in play
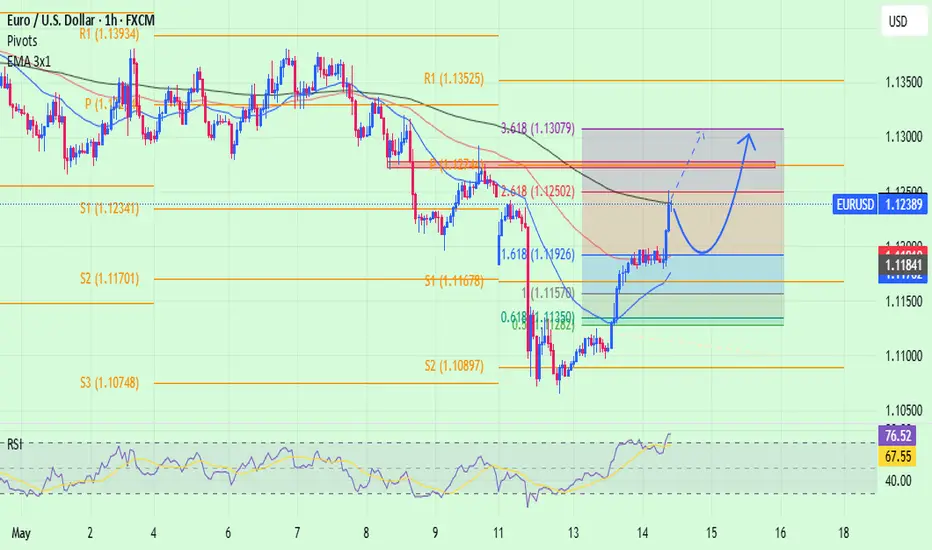
EUR/USD – Bullish Wave 3 in Play | AO Convergence + Fib Target PPair: EUR/USD
Timeframe: 15-Minute
Date: May 15, 2025
🧠 Technical Breakdown:
This analysis focuses on a clean impulsive Elliott Wave structure, Fibonacci projections, and Awesome Oscillator (AO) confirmation to support a bullish continuation.
🔍 Wave Count:
Wave 1: Clear impulsive push upwards, breaking previous market structure.
Wave 2: Completed corrective pullback into the key support zone, respecting the golden ratio levels.
Wave 3: Initiated after a dominant break above the minor structure and trendline resistance, confirming bullish momentum.
⚙️ AO (Awesome Oscillator) Confirmation:
Strong AO divergence between the Wave 1 and Wave 2 low confirms the bullish structure.
Within the early stage of Wave 3, the AO shows a convergence pattern forming between subwaves 1, 2, and 3 — indicating strengthening bullish momentum.
AO flipped green again after a minor pullback, signaling bullish continuation potential.
🎯 Fibonacci Extensions:
TP1 Zone: 1.618 – 1.88 Fibonacci extension range → 1.1216 – 1.1226
(High probability for Wave 3 termination)
TP2 Zone: 2.618 – 2.88 Fibonacci extension range → 1.1241 – 1.1258
(Extended target if bullish momentum accelerates)
Further projections (Wave 5 estimate):
4.236 – 4.618 → 1.1276 – 1.1288
🧱 Key Structural Zone:
1.11813 is the most critical support-turned-resistance (SNR) level — price broke above this level, retested, and bounced.
The green highlighted box marks the ideal buy zone, aligned with:
Dominant break confirmation
Fibonacci confluence
Bullish AO setup
✅ Trade Plan:
Entry: On retest or bounce from the green zone
Stop Loss: Below 1.11800 or below Wave 2 low (to protect structure)
Take Profit 1: 1.1216 – 1.1226
Take Profit 2: 1.1241 – 1.1258
Optional TP3 (extended): 1.1276 – 1.1288 (Wave 5 projection)
🧭 Summary:
This setup combines Elliott Wave theory, Fibonacci projections, and AO convergence to provide a highly probable bullish continuation scenario. Ideal for breakout traders and structure-based wave analysts.
📌 “Confluence is key. Let structure, momentum, and fibs guide the trade.”
#EURUSD #ElliottWave #Wave3 #AOIndicator #ForexAnalysis #Fibonacci #PriceAction #FXTrading #StructureBreak #TechnicalAnalysis

NZD/JPY Potential Bullish ContinuationNew Zealand Dollar/Yen price seems to exhibit signs of potential bullish momentum as the price action may form a credible Higher Low on key Fibonacci and Support levels.
Trade Plan :
Entry @ 86.29
Stop Loss @ 84.85
TP 0.9 - 1 @ 87.586 - 87.730

GBPUSD: Bearish Move Confirmed?! 🇬🇧🇺🇸
GBPUSD looks bearish after a release of UK GDP this morning.
I see a strong bearish imbalance after a test of a key horizontal resistance
and a confirmed Change of Character CHoCH as a confirmation.
I expect a bearish continuation at least to 1.3224
❤️Please, support my work with like, thank you!❤️
I am part of Trade Nation's Influencer program and receive a monthly fee for using their TradingView charts in my analysis.

Drop down and continue uptrend🔔🔔🔔EUR/USD news:
➡️ The EUR/USD pair rose to around 1.1240 during Wednesday’s European session as the U.S. dollar weakened against the euro following softer-than-expected U.S. inflation data for April. The greenback declined sharply in immediate response to the cooler CPI report.
➡️ Meanwhile, the U.S. and China agreed to reduce tariffs after two days of negotiations in Geneva, Switzerland. Optimism over a potential tariff deal between the world's two largest economies eased trade war concerns and lowered recession fears, which could in turn offer some support to the U.S. dollar and act as a headwind for the major currency pair.
Personal opinion:
➡️ The USD is performing less effectively than the EUR, so in the short term, this pair still maintains its upward momentum. However, the overbought zone has appeared and there may be a pullback before the short-term uptrend returns
➡️ Analysis based on important resistance - support levels and Fibonacci combined with EMA to come up with a suitable strategy
Personal plan:
🔆Price Zone Setup:
👉Buy EUR/USD 1.1200- 1.1190
❌SL: 1.1160 | ✅TP: 1.1250
FM wishes you a successful trading day 💰💰💰
CADJPY - Bearish Rising WedgeHello Traders !
The CADJPY price formed a rising wedge pattern.
The price broke the support line.
So, I expect a bearish move📉
_______________
TARGET: 103.655🎯

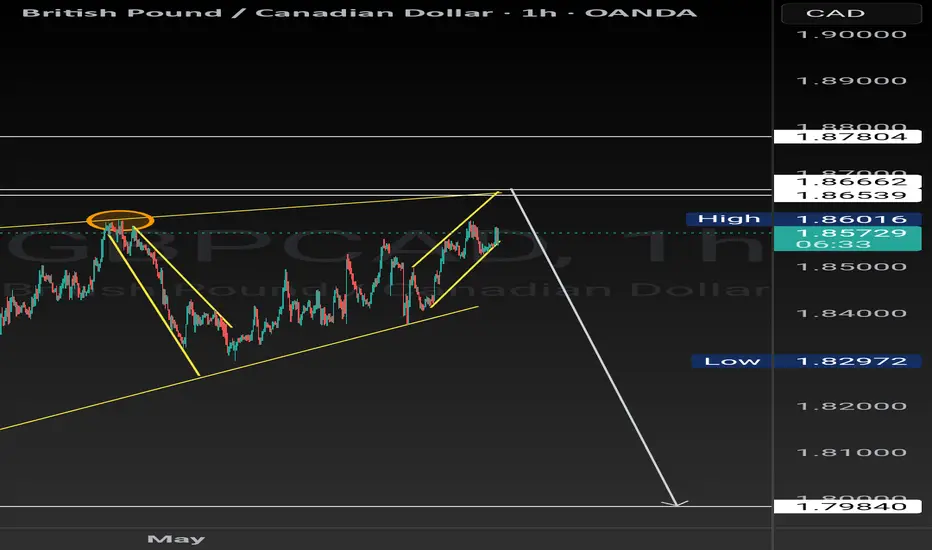
GBPCAD1.Higher time frame 123 channel is in
play.
2. Double top is in play.
3. One hour 123 pattern is also in play.
After all the middle section wasn't clear enough but we going down on the 3rd touch and the double top at the same time. Wait for marker 4 hour liquidity candle to form then enter on 1hour rejection candle.
Wish you all the best comment after taking this trade. If market didn't reach our 3rd touches that means there's no trades. Goodluck......
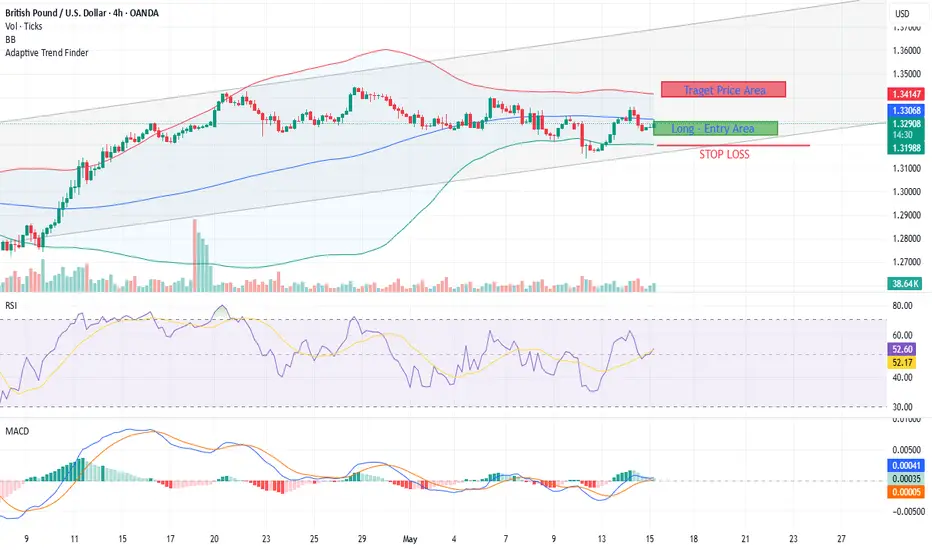
GBP/USD Long - Swing Trade Idea Targeting 1.3440GBP/USD Long - Swing Trade Idea Targeting 1.3440
GBP/USD Long
Entry - 1.3240 - 1.3300
Stop Loss - 1.3195
Target - 1.3440
Q1 GDP +0.7 % q/q & +5.9 % cap-ex jump signal UK has exited the “technical recession.” • Dollar momentum stalling after soft US CPI; PPI & U-Mich could reinforce pull-back while Trump keeps jaw-boning for cuts.
Rate-spread turning GBP-positive as BoE stresses higher-for-longer, wage/service inflation sticky.
Technical: daily close back above 20-day EMA (1.3255) and RSI > 55 show fresh bullish impulse; seasonal tail-wind (GBP tends to firm late-May)
The stronger-than-forecast UK GDP figures support, rather than undermine, the long-GBP/USD view:
They confirm the UK’s growth rebound narrative, cushioning sterling ahead of Friday’s US PPI and Michigan sentiment prints.
Industrial softness is a known drag but not material enough to offset services-led momentum or today’s positive quarterly investment surprise.
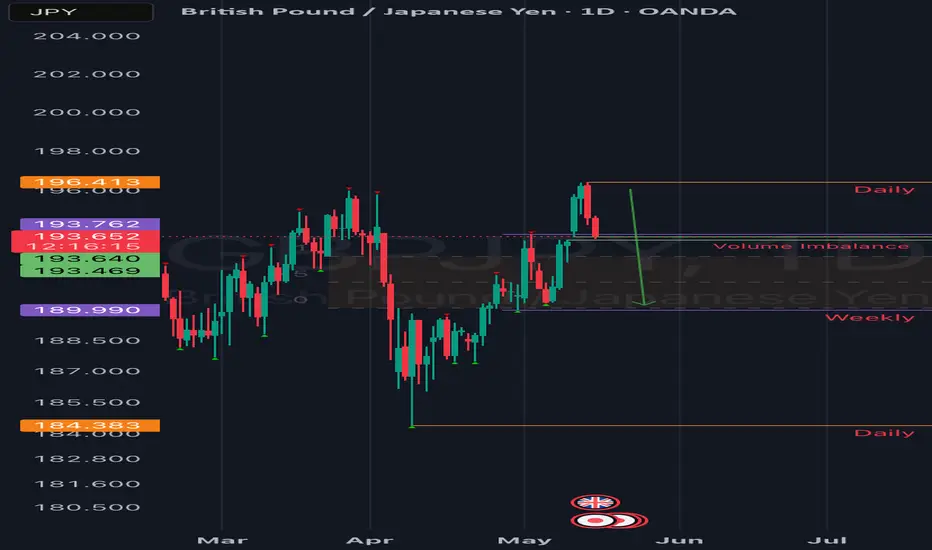
GBPJPY( British pound my banker!)Good day traders, I’m back with another idea on GbPJPY but this one is based on the strength and weakness of the pound itself. Before you ask what I mean…on this respective TF we had a break of structure higher(strength) but we saw price immediately move lower showing some weakness in price.
For the rest of the London session we can expect price to move higher on that volume imbalance to start the New York session. The rectangle is a balanced price range.
fake me out daddyfake out after fake out. thank you eur/usd for faking me out right when i had to go to bed so that i would have to stay up to keep you company and my positions reentered once, twice, three times. it was a good prank

DeGRAM | EURUSD rebound in the channel📊 Technical Analysis
● Strong rebound from 1.1070/channel base produced a V‑shape and broke a minor falling wedge; price is now carving higher lows above 1.1200 support.
● Room remains to the upper wedge rail / supply 1.1380, which aligns with the channel’s mid‑line; invalidation if 1.1200 fails.
💡 Fundamental Analysis
● US April CPI printed 0.3 % m/m (vs 0.4 % cons) while retail‑sales missed, knocking 2‑yr yields beneath 4.70 % and weakening the USD.
● ECB hawks (Vujčić, Nagel) said cuts after June hinge on data, tempering dovish bets and underpinning euro rates. FXStreet flags fresh demand above 1.12.
✨ Summary
Channel‑floor bounce + softer US data versus guarded ECB tone favour a grind to 1.1300 → 1.1380; long bias void under 1.1200.
-------------------
Share your opinion in the comments and support the idea with like. Thanks for your support!

EURUSD Approaches Key Resistance After Strong BounceThe 1.1050–1.11 support zone held EURUSD almost like a textbook example. Still, it is too early to say the retest has failed and that the main direction is now definitively upward. You can check our earlier post here:
In the short term, the bounce and breakout above 1.12 were strong. However, bulls should remain cautious as the main resistance is now within reach. The 1.1275–1.1295 zone is the key short-term resistance, in our view. This area includes a former key horizontal support level, the short-term downtrend line, and it also marks the midpoint of the April 21 to May 13 retreat.
Unless this zone is broken, EURUSD could start to lose momentum. The 1.12 level may now act as a pivot between the 1.1150–1.12 support area and the 1.1275–1.1295 resistance range.

Uptrend targetsUSD/JPY filled the May 10–11 gap and is now showing signs of a bullish bounce from the 145.36 zone. Buyers are testing higher, but 146.50 remains key resistance. A break above could open room toward 147.50, while failure may trigger another drop. Price is currently neutral-bullish; wait for confirmation before entering.

GBPUSD INTRADAY sideways consolidation support at 1.3200The GBP/USD pair continues to exhibit a bullish longer-term trend, underpinned by a series of higher highs and higher lows. However, recent price action shows consolidation within a sideways trading range, suggesting a pause or potential accumulation before the next directional move.
The key technical level to monitor is 1.3200, which aligns with a prior consolidation zone and serves as a critical support area. A corrective pullback towards this level could present a buying opportunity, particularly if price action forms a bullish reversal pattern around this zone. A successful rebound from 1.3200 would likely target resistance levels at 1.3400, followed by 1.3445 and 1.3500 on a longer-term basis.
Conversely, a daily close below 1.3200 would invalidate the current bullish bias and suggest a shift in sentiment. This scenario opens the door for further downside towards the next support at 1.3160, with extended losses potentially reaching 1.3116.
Conclusion:
While the broader trend remains bullish, GBP/USD is currently range-bound. Traders should watch for a reaction around the 1.3200 level. A bounce would reinforce bullish momentum towards 1.3400 and beyond, whereas a confirmed break below this level would signal further weakness and a possible trend shift in the near term.
This communication is for informational purposes only and should not be viewed as any form of recommendation as to a particular course of action or as investment advice. It is not intended as an offer or solicitation for the purchase or sale of any financial instrument or as an official confirmation of any transaction. Opinions, estimates and assumptions expressed herein are made as of the date of this communication and are subject to change without notice. This communication has been prepared based upon information, including market prices, data and other information, believed to be reliable; however, Trade Nation does not warrant its completeness or accuracy. All market prices and market data contained in or attached to this communication are indicative and subject to change without notice.

GBP/CHF For Bearish as pull-backyou can go short now
or
wait for entry point and then go short
general trend is up trend
current phase is pull-back
have fun :)

The Day Ahead Thursday May 15
Data: US April PPI, retail sales, industrial production, capacity utilisation, May Philadelphia Fed business outlook, Empire manufacturing index, NAHB housing market index, March business inventories, initial jobless claims, UK Q1 GDP, Japan April machine tool orders, Germany April wholesale price index, Italy March general government debt, Eurozone Q1 employment, March industrial production, Canada April housing starts, existing home sales, March manufacturing sales, Australia April labour report, Norway Q1 GDP
Central banks:
Fed's Chair Powell and Barr speak,
ECB's Cipollone, Elderson, Guindos and Villeroy speak,
BoE's Dhingra speaks
Earnings: Walmart, Alibaba, Siemens, Deutsche Telekom, Allianz, Mitsubishi UFJ, Deere, Applied Materials, National Grid, 3i Group, Engie, Take-Two, RWE, Cava
This communication is for informational purposes only and should not be viewed as any form of recommendation as to a particular course of action or as investment advice. It is not intended as an offer or solicitation for the purchase or sale of any financial instrument or as an official confirmation of any transaction. Opinions, estimates and assumptions expressed herein are made as of the date of this communication and are subject to change without notice. This communication has been prepared based upon information, including market prices, data and other information, believed to be reliable; however, Trade Nation does not warrant its completeness or accuracy. All market prices and market data contained in or attached to this communication are indicative and subject to change without notice.

GBPUSD inverted FVG update!!Good day traders, we back again we an update on the setup on GBpUSD that I posted.
Coming into this week on Monday we show a very strong push lower and it was anticipated for Thursday and Friday that move but because the narrative still holds and we saw price fail to close about the midpoint of the inverted FVG. Price did not only reject that level once but multiple times, price than moved away from the Inverted FVG.
The green arrow shows a balanced price range that we wanna see price revisit and break past, but remember price do not move in a straight line so monitor minor reversals that can really do damage. On the 4H TF we saw break structure lower and that leg has a lot of imbalances in them!! But overall bias we bearish on GBPUsD

CAD/CHF For Bearish as pull-backyou can go short now
or
wait for entry point and then go short
general trend is up trend
current phase is pull-back
have fun :)

NZD/CHF For Bearish as pull-backyou can go short now
or
wait for entry point and then go short
general trend is up trend
current phase is pull-back
have fun :)

GBPAUD BULLISH GBPAUD (1H) – Bullish Divergence Buy Setup
GBPAUD has been in a short-term bearish trend on the 1-hour chart, but a bullish divergence on the RSI oscillator suggests selling momentum is weakening and a reversal may be beginning. We propose a market buy entry with defined stop and target levels to manage this potential bounce.
Entry: Market Buy (GBPAUD at current price)
Stop Loss: 2.04803 (below recent swing low)
Take Profit 1: 2.08469
Take Profit 2: 2.10350
Risk/Reward: ~1:1 to TP1, ~2:1 to TP2
Stop is placed just below the recent low as a protective measure, and profit targets align with key resistance levels. Overall, this trade offers a favorable risk-reward profile consistent with the bullish divergence reversal setup.

Lingrid | GBPNZD Primed For BULLISH Move. LongFX:GBPNZD bounced off the upward trendline and cleared the $2.24561 resistance, reclaiming bullish momentum after a pullback and fake breakout. With a breakout retest underway, bulls are eyeing a move toward the $2.27480 resistance zone. Higher lows confirm the channel remains intact.
📌 Key Levels
Support: 2.24561
Resistance: 2.27480
Structure: Rising trendline with breakout and retest dynamics
⚠️ Risks
Failure to hold $2.24561 may trigger deeper correction
Rejection near resistance without volume may signal a bull trap
Any sharp breakdown of the upward trendline would shift the outlook to neutral or bearish
Traders, if you liked this idea or if you have your own opinion about it, write in the comments. I will be glad 👩💻
