GBP/USD pair on a 4H timeframMy analyzing the GBP/USD pair on a 4H timeframe using the Ichimoku Cloud and Volume Profile (Visible Range), along with marked support and resistance zones. From this image, I can guide you with a target price level, but you'll need to validate with price action confirmation.
Observations:
1. Ichimoku Cloud (Kumo):
Price is currently trading above the cloud, indicating a bullish bias.
However, the cloud ahead is thin and flat, suggesting weak support if a pullback happens.
Forex market

USDCHF Will Go Down From Resistance! Short!
Take a look at our analysis for USDCHF.
Time Frame: 9h
Current Trend: Bearish
Sentiment: Overbought (based on 7-period RSI)
Forecast: Bearish
The market is approaching a key horizontal level 0.813.
Considering the today's price action, probabilities will be high to see a movement to 0.806.
P.S
We determine oversold/overbought condition with RSI indicator.
When it drops below 30 - the market is considered to be oversold.
When it bounces above 70 - the market is considered to be overbought.
Disclosure: I am part of Trade Nation's Influencer program and receive a monthly fee for using their TradingView charts in my analysis.
Like and subscribe and comment my ideas if you enjoy them!

EURJPY POTENTIAL SELL OPPORTUNITY-H1 timeframe!Price is set for a sell from the current market price! Technically, we can identify the already existing bear trend. Couple of hours ago, we saw price rejection around 171.162 that rejection could be a H1 lower high which potentially means price might drop back to the low. Therefore, a sell opportunity is envisaged from the current price

GBPUSD SHORTGBPUSD SHORT — 15S Entry | 5M Confirmation | 4H Bias
📌 Check comment images for full multi-timeframe layout — due to TradingView’s publishing restriction, I couldn’t include all charts in the main post.
📸 MT5 entry screenshot also attached
Weekly demand in control. Daily demand in control.
However, 4H supply is active — price could continue bullish if OF shifts.
But for today, 4H supply stayed in control and gave reason for lower prices.
Caught the 5M structure break, which created inside bar flip liquidity for the zone above.
Dropped to 15S for entry. Exited after 3RR was achieved.
Same system. Same pair. Same outcome.
Zero emotion. Just posting what works.


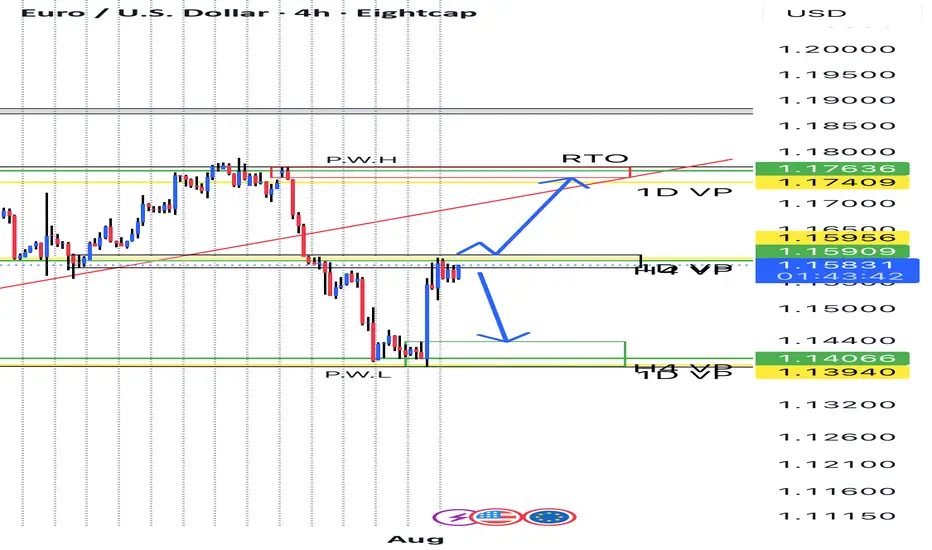
EUR/USD target 1 SHORT and after target 2 LONG big red arrows Aeria of Interest for sell and buy, probably movment...
- Real volume
- 5 of RMA (10,20,30,40,50)
- Fibo
- Market Structure
- Supply/Demand

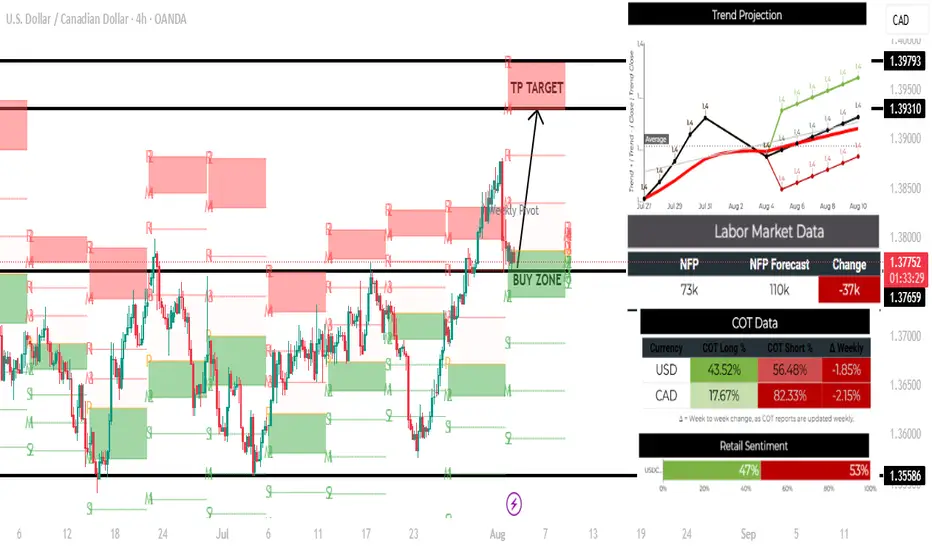
USDCAD 4H chart bullish setup - 04 August 2025🔍 1. Market Overview
🔸 Technical Outlook (4H Chart)
Price: Currently at 1.37792, just above a strong Buy Zone at 1.37659.
Structure: Bullish trend continuation with higher highs and higher lows.
Targets:
TP Target: Clearly marked at 1.39310 to 1.39793 resistance zone.
Support: Strong base near 1.37659; additional support at 1.35586.
Bias: Bullish, based on structure and rejection near support.
🔸 Trend Projection
The black average trend line shows price is likely to rebound upward starting August 4, aligning with the technical bullish zone.
Green projections suggest upside potential, supporting a long bias.
Red projections are possible but less likely based on current price structure and support strength.
📊 2. Fundamental Analysis
🔸 Labor Market (NFP Report)
Actual: 73k vs Forecast: 110k → -37k miss (Bearish for USD)
Impact: Weak U.S. labor data could temporarily weaken USD, but CAD is even weaker fundamentally (see below), making USDCAD likely to still rise.
🔸 COT (Commitment of Traders) Data
USD: Net short (43.52% long vs 56.48% short) → Slightly bearish.
CAD: Extremely bearish (17.67% long vs 82.33% short).
Net Positioning Bias: Bullish USDCAD (weaker CAD sentiment outweighs USD weakness).
🔸 Retail Sentiment
Retail is 53% Short vs 47% Long → Slightly more traders are betting against USDCAD.
Contrarian View: Retail traders are often wrong at turning points, which adds to bullish bias.
✅ 3. Trade Plan
🟢 Entry Plan
Entry Zone: Between 1.37659 and 1.37800 (buy zone, minor retracement area).
Confirmation: Look for a bullish candlestick reversal pattern (hammer, engulfing) on 1H/4H timeframe.
🎯 Take Profit (TP)
Primary TP: 1.39310 (strong resistance & marked TP target).
Extended TP: 1.39793 (monthly resistance level).
🛑 Stop Loss (SL)
Below support: 1.37250, just below the buy zone to avoid noise.
📌 4. Risk-Reward Ratio
Entry: ~1.3779
SL: 1.3725 (≈54 pips)
TP: 1.3931 (≈152 pips)
R:R ≈ 1:2.8 → Solid setup
⚠️ 5. Risk & News Events
Be aware of upcoming CAD data or USD CPI/inflation releases.
If risk sentiment worsens globally (e.g., oil prices rise → CAD strength), consider tightening stop or partial profits.
GBPUSD short term LONGHello there, here's my analysis on GU
Price took out LQ on the daily and now we see a QM structure (choch) on the, Monday opens with a bit of bullish strength
I am expecting price to drop back down and take out the BB below the LQ which will be my entry zone and buy to the daily FVG where I prepare for sells … cheers

EURUSDEURUSD needs a correction down or a break above resistance, retest and another push up this week.
Disclosure: We are part of Trade Nations Influencer Program and receive a monthly fee for using their TradingView charts in our analysis.
GBP/CAD SENDS CLEAR BEARISH SIGNALS|SHORT
GBP/CAD SIGNAL
Trade Direction: short
Entry Level: 1.833
Target Level: 1.821
Stop Loss: 1.840
RISK PROFILE
Risk level: medium
Suggested risk: 1%
Timeframe: 3h
Disclosure: I am part of Trade Nation's Influencer program and receive a monthly fee for using their TradingView charts in my analysis.
✅LIKE AND COMMENT MY IDEAS✅

EURJPY bearish continuationFriday gave a very strong bearish candle.
Asian session and Europe session observed a pullback with sideway movement.
I'm expecting bearish continuation during US session.
calculate your own risk & reward.
Good luck

CADJPY: Bullish Continuation is Expected! Here is Why:
Balance of buyers and sellers on the CADJPY pair, that is best felt when all the timeframes are analyzed properly is shifting in favor of the buyers, therefore is it only natural that we go long on the pair.
Disclosure: I am part of Trade Nation's Influencer program and receive a monthly fee for using their TradingView charts in my analysis.
❤️ Please, support our work with like & comment! ❤️

GBP/JPY BULLS ARE GAINING STRENGTH|LONG
Hello, Friends!
Previous week’s red candle means that for us the GBP/JPY pair is in the downtrend. And the current movement leg was also down but the support line will be hit soon and lower BB band proximity will signal an oversold condition so we will go for a counter-trend long trade with the target being at 197.696.
Disclosure: I am part of Trade Nation's Influencer program and receive a monthly fee for using their TradingView charts in my analysis.
✅LIKE AND COMMENT MY IDEAS✅

GBP/AUD SELLERS WILL DOMINATE THE MARKET|SHORT
Hello, Friends!
GBP-AUD uptrend evident from the last 1W green candle makes short trades more risky, but the current set-up targeting 2.049 area still presents a good opportunity for us to sell the pair because the resistance line is nearby and the BB upper band is close which indicates the overbought state of the GBP/AUD pair.
Disclosure: I am part of Trade Nation's Influencer program and receive a monthly fee for using their TradingView charts in my analysis.
✅LIKE AND COMMENT MY IDEAS✅

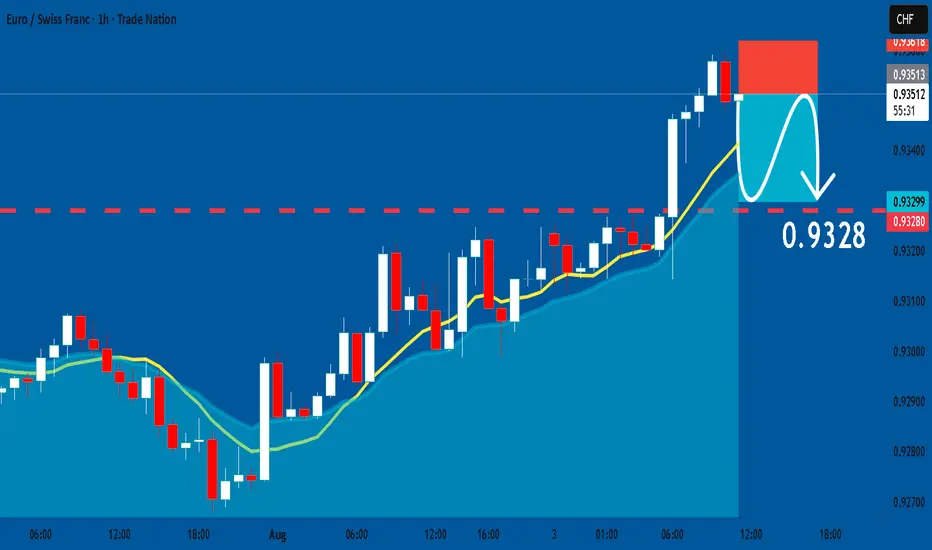
EURCHF: Short Signal Explained
EURCHF
- Classic bearish formation
- Our team expects fall
SUGGESTED TRADE:
Swing Trade
Sell EURCHF
Entry Level - 0.9350
Sl - 0.9361
Tp - 0.9328
Our Risk - 1%
Start protection of your profits from lower levels
Disclosure: I am part of Trade Nation's Influencer program and receive a monthly fee for using their TradingView charts in my analysis.
❤️ Please, support our work with like & comment! ❤️
USD/JPYThis analysis is built on volume analysis, Fibonacci retracement levels, and confirmation from the Stochastic oscillator to pinpoint a precise long entry. The setup reflects a potential bullish continuation supported by strong demand and upward momentum.
Entry: 147.76 area
Stop-Loss: 147.56 area
Take-Profit: 148.55 area
Risk-to-Reward Ratio: ~1:4.5
This setup aims to capture a breakout or bounce from a key Fibonacci level, where the volume confirms buying interest and the Stochastic indicates a reversal from oversold conditions.
⚠️ Disclaimer:
This is not financial advice. Trading involves risk and may not be suitable for all investors. Always do your own research and apply proper risk management.

NZD/JPY BEARS ARE STRONG HERE|SHORT
Hello, Friends!
Previous week’s green candle means that for us the NZD/JPY pair is in the uptrend. And the current movement leg was also up but the resistance line will be hit soon and upper BB band proximity will signal an overbought condition so we will go for a counter-trend short trade with the target being at 88.302.
Disclosure: I am part of Trade Nation's Influencer program and receive a monthly fee for using their TradingView charts in my analysis.
✅LIKE AND COMMENT MY IDEAS✅

One Sweet Bullish Candle Above 50EMA… and I’m All Yours, 1.7940I’ve got a lovely 1H bullish range from 1.7733 to 1.7940 — pure potential.
Market gave me a 100-pip pullback/retracement from 1.7940 to 1.7840 — just a little mood swing. 😒
Now I’m patiently stalking...
If a bullish candle closes above my 50EMA,
I’m not thinking twice — I’m riding the bull! 🐂💥
SL? Depends on the candle’s vibe:
If it’s a strong Marubozu, I’ll trust it like a loyal partner — SL goes just below it.
TP? Straight to 1.7940 — no detours, no drama. 🎯
Wish me luck… and a Marubozu with commitment issues! 😂📉📈

CAD/CHF BEARS WILL DOMINATE THE MARKET|SHORT
Hello, Friends!
We are targeting the 0.584 level area with our short trade on CAD/CHF which is based on the fact that the pair is overbought on the BB band scale and is also approaching a resistance line above thus going us a good entry option.
Disclosure: I am part of Trade Nation's Influencer program and receive a monthly fee for using their TradingView charts in my analysis.
✅LIKE AND COMMENT MY IDEAS✅

My Trading Journal on EURUSD 04.08.2025The first week of the month presents a new opportunity for everyone—don't give up on your dreams!
Last week was fantastic, especially with the Non-Farm Payroll (NFP) report, which had a significant impact on the market. We hope this week will also be a great one, especially since there are no major red folder news events today.
Let's keep an eye on how the GBPUSD, EURUSD, and XAUUSD perform.

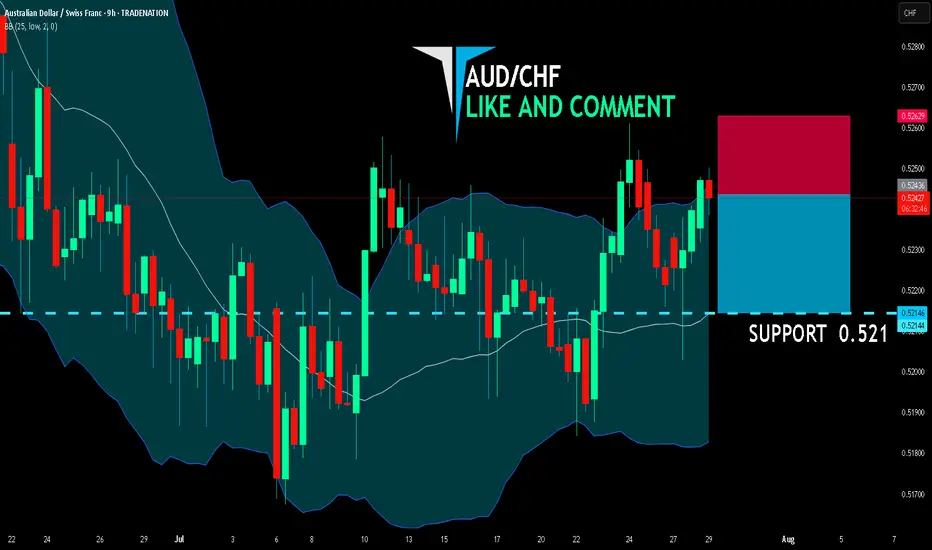
AUD/CHF BEARS ARE STRONG HERE|SHORT
AUD/CHF SIGNAL
Trade Direction: short
Entry Level: 0.524
Target Level: 0.521
Stop Loss: 0.526
RISK PROFILE
Risk level: medium
Suggested risk: 1%
Timeframe: 9h
Disclosure: I am part of Trade Nation's Influencer program and receive a monthly fee for using their TradingView charts in my analysis.
✅LIKE AND COMMENT MY IDEAS✅
USD/CHF BEARS WILL DOMINATE THE MARKET|SHORT
Hello, Friends!
Bearish trend on USD/CHF, defined by the red colour of the last week candle combined with the fact the pair is overbought based on the BB upper band proximity, makes me expect a bearish rebound from the resistance line above and a retest of the local target below at 0.804.
Disclosure: I am part of Trade Nation's Influencer program and receive a monthly fee for using their TradingView charts in my analysis.
✅LIKE AND COMMENT MY IDEAS✅

EUR/GBP BULLS ARE STRONG HERE|LONG
EUR/GBP SIGNAL
Trade Direction: long
Entry Level: 0.863
Target Level: 0.872
Stop Loss: 0.857
RISK PROFILE
Risk level: medium
Suggested risk: 1%
Timeframe: 9h
Disclosure: I am part of Trade Nation's Influencer program and receive a monthly fee for using their TradingView charts in my analysis.
✅LIKE AND COMMENT MY IDEAS✅
