GBPJPY : Short-Term Bullish SetupGBPJPY – Short-Term Bullish Setup
GBPJPY has just broken above a minor resistance zone, signaling a shift in short-term momentum.
The previous 1-hour candle closed strong and bullish, suggesting that the pair could continue gaining strength in the next few hours.
This move appears to be driven mainly by market speculation and ongoing tariff discussions, adding fuel to the bullish outlook.
Key levels to watch:
196.05
196.45
197.00
You may find more details in the chart!
Thank you and Good Luck!
PS: Please support with a like or comment if you find this analysis useful for your trading day
Disclosure: I am part of Trade Nation's Influencer program and receive a monthly fee for using their TradingView charts in my analysis.
Forex market

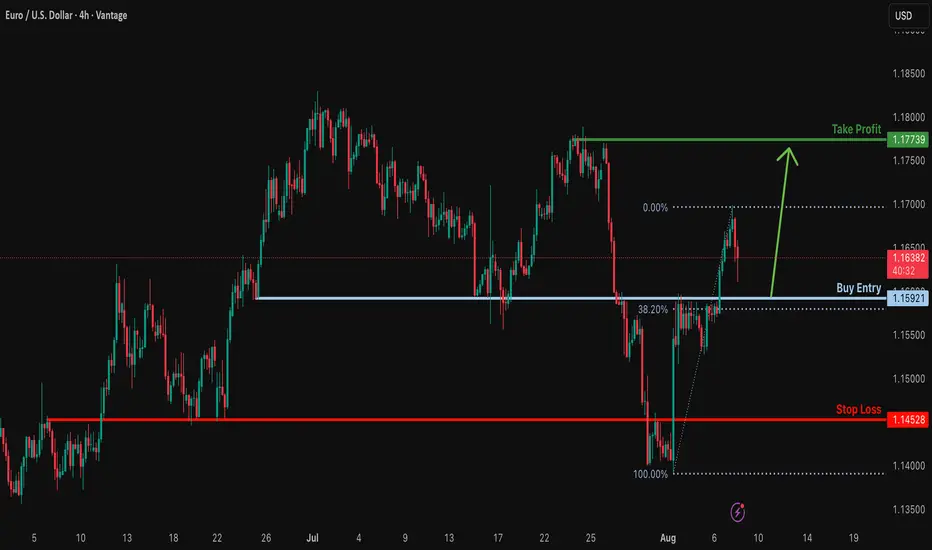
Bullish bounce off overlap support?EUR/USD is falling towards the support level which is an overlap support that aligns with the 38.2% Fibonacci retracement and could bounce from this level to our take profit.
Entry: 1.1592
Why we like it:
There is an overlap support level that lines up with the 38.2% Fibonacci retracement.
Stop loss: 1.1452
Why we like it:
There is a pullback support level that aligns with the 50% Fibonacci retracement.
Take profit: 1.1773
Why we llike it:
There is a swing high resistance.
Enjoying your TradingView experience? Review us!
Please be advised that the information presented on TradingView is provided to Vantage (‘Vantage Global Limited’, ‘we’) by a third-party provider (‘Everest Fortune Group’). Please be reminded that you are solely responsible for the trading decisions on your account. There is a very high degree of risk involved in trading. Any information and/or content is intended entirely for research, educational and informational purposes only and does not constitute investment or consultation advice or investment strategy. The information is not tailored to the investment needs of any specific person and therefore does not involve a consideration of any of the investment objectives, financial situation or needs of any viewer that may receive it. Kindly also note that past performance is not a reliable indicator of future results. Actual results may differ materially from those anticipated in forward-looking or past performance statements. We assume no liability as to the accuracy or completeness of any of the information and/or content provided herein and the Company cannot be held responsible for any omission, mistake nor for any loss or damage including without limitation to any loss of profit which may arise from reliance on any information supplied by Everest Fortune Group.

GBPAUD started an uptrend movement after BOE rate decisionGBPAUD started an uptrend movement after BOE rate decision
Today, the Bank of England cut interest rates by 25 basis points to 4% from 4.25%.
BoE Governor Bailey explained that he has not changed his view on the direction of the interest rate path, the question is the timeframe. The BoE is hinting at prolonged higher rates, weighing on growth, sending an aggressive signal to the market.
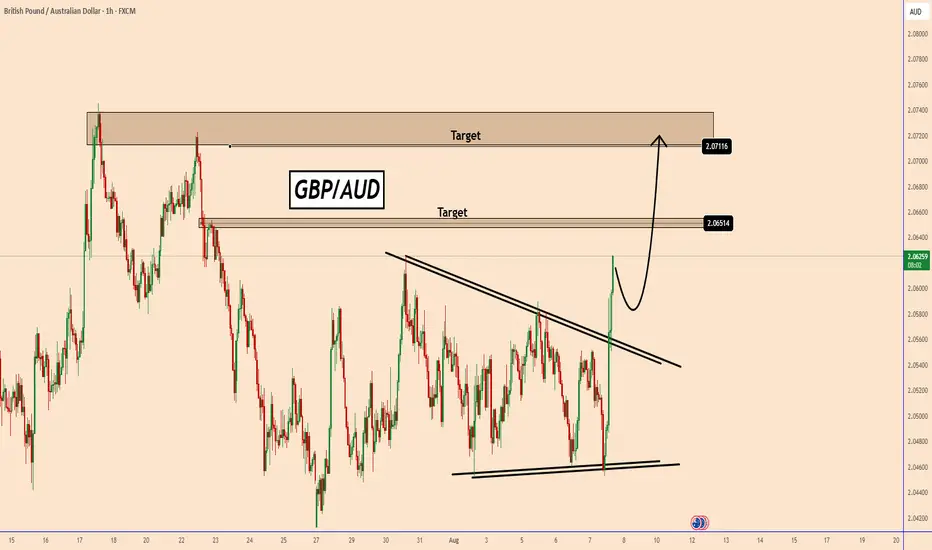
GBPAUD strengthened after the rate decision was released and has risen further since then.
GBPAUD broke out of this bullish triangle pattern. The breakout looks strong and the volume that the price has increased was high.
I expect a small pause before GBPAUD moves further to 2.0650 and possibly higher to 2.0700, where it was also rejected several times, but where it was also tested several times.
You may find more details in the chart!
Thank you and Good Luck!
PS: Please support with a like or comment if you find this analysis useful for your trading day
GBPJPYAnticipating a sell-off on GBPJPY. Price broke a trendline with heavy selling pressure ,so am expecting this trend to continue.

EURGBP – DAILY FORECAST Q3 | W32 | D7 | Y25📊 EURGBP – DAILY FORECAST
Q3 | W32 | D7 | Y25
Daily Forecast 🔍📅
Here’s a short diagnosis of the current chart setup 🧠📈
Higher time frame order blocks have been identified — these are our patient points of interest 🎯🧭.
It’s crucial to wait for a confirmed break of structure 🧱✅ before forming a directional bias.
This keeps us disciplined and aligned with what price action is truly telling us.
📈 Risk Management Protocols
🔑 Core principles:
Max 1% risk per trade
Only execute at pre-identified levels
Use alerts, not emotion
Stick to your RR plan — minimum 1:2
🧠 You’re not paid for how many trades you take, you’re paid for how well you manage risk.
🧠 Weekly FRGNT Insight
"Trade what the market gives, not what your ego wants."
Stay mechanical. Stay focused. Let the probabilities work.
FX:EURGBP

USDJPY: Trend in 2H time framePlease pay special attention to the very accurate trend, colored levels, and red level as SL.
Be careful
BEST
MT

GBPJPY - at ResistanceSterling Yen long term was consolidating since Aug 24.
Now the price reached the FR 127.2 and respected it as Resistance.
On Aug 1st the support at FR 100 was broken. Yet, price crossed down SMA200 (4H)
Now price is testing the SMA200 from below, which is aligned with FR 61.8 of the latest impulse down.
If the Resistance at 198 holds, price may commence a longer correction, potentially down to 194 or even to 190.
Just my humble opinion.

EurusdNy Reversal trade
Only perfect W formation with a 5/13 Cross will possibly give is a 1 % win ratio
TDI sharkfin low

EURUSD - We Joined If you follow my previous analysis, we joined the trend to the next level.
Risking 9 Pips, we are aiming for a 1:10+

1.17171 is the decision point.As long as the price hasn't reached that level, no position should be opened.
We need to wait for it to reach that level and then, based on the reaction to that point, see whether the trend will continue or turn bearish.

GBPUSD – DAILY FORECAST Q3 | W32 | D7 | Y25📊 GBPUSD – DAILY FORECAST
Q3 | W32 | D7 | Y25
Daily Forecast 🔍📅
Here’s a short diagnosis of the current chart setup 🧠📈
Higher time frame order blocks have been identified — these are our patient points of interest 🎯🧭.
It’s crucial to wait for a confirmed break of structure 🧱✅ before forming a directional bias.
This keeps us disciplined and aligned with what price action is truly telling us.
📈 Risk Management Protocols
🔑 Core principles:
Max 1% risk per trade
Only execute at pre-identified levels
Use alerts, not emotion
Stick to your RR plan — minimum 1:2
🧠 You’re not paid for how many trades you take, you’re paid for how well you manage risk.
🧠 Weekly FRGNT Insight
"Trade what the market gives, not what your ego wants."
Stay mechanical. Stay focused. Let the probabilities work.
FX:GBPUSD

EURGBP Roadmap EURGBP looking for entry signal at july highs for a leg down. small chance over shooting july highs before turning down.

EUR USD potential roadmapLooking for entry signal for weaker EUR favouring a major ABC -C leg down perhaps W2 ends. Currently looks like end of minor abc - c leg up at resistance (blue trendline)

Management options for GBPJPY trade.If anyone took this setup I posted last week, you can move sl to break even and protect the trade. We had a chance at 1:1 earlier in the week, which would have been a good time to get out if you were trading intraday. All else is normal; we are experiencing a correction on smaller timeframes, and I expect this trend to continue downward. We are stress-free in the trade, and that is the goal, friends. Stress-free and profitable.

GBPJPY UPDATE MAPPING 🚨 GBPJPY Update Mapping
Price has officially broken above my previous SBR, which now acts as a strong RBS zone.
Currently, I'm looking for buy opportunities based on H4 bullish engulfing confirmation. I’ll be refining my entry on M15, ideally waiting for a break of structure or a clean bullish engulfing setup before executing.
This is my current trading idea — if you guys have any thoughts or setups on this pair, feel free to share in the comments below! Let’s grow together 📈💬
#GBPJPY #TradingSetup #PriceAction #TVABreakdown #ForexCommunity #SmartMoneyConcepts #StructureTrading

AUDJPY Forming Bullish MomentumAUDJPY has recently bounced from a strong demand zone near the 94.50–95.00 region, as seen on the 4H chart. This zone has acted as a key support area in previous price action, and the market is now printing higher lows after rejecting it multiple times. Price is showing bullish momentum, and with buyers stepping in aggressively from this area, we are now anticipating a continuation to the upside toward 96.80 and beyond.
From a fundamental perspective, the Australian dollar is gaining traction due to recent upbeat economic sentiment, especially as the Reserve Bank of Australia (RBA) maintains its data-dependent stance. Although rate hikes are on pause, the RBA is leaving the door open for further tightening should inflation remain sticky. On the flip side, the Japanese yen remains weak across the board, with the Bank of Japan maintaining ultra-loose monetary policy and no near-term signals of change. This divergence in central bank policy continues to support bullish pressure on AUDJPY.
Technically, the risk-reward profile is favorable. The bullish engulfing candles off the demand zone suggest strong buyer intent. A break and hold above the intraday resistance around 96.00 would confirm bullish continuation, with upside targets stretching toward 96.80–97.20. Meanwhile, stops can be managed tightly below 94.50, keeping the setup clean and structured. With the yen facing broad weakness and Aussie resilience in play, this pair offers momentum trading potential.
Overall, AUDJPY is primed for upside as long as the support zone holds. Traders should monitor price action around current levels for bullish confirmation and scale in on minor pullbacks. This setup aligns with market sentiment and fundamental divergence, creating a high-probability opportunity in the current forex landscape.


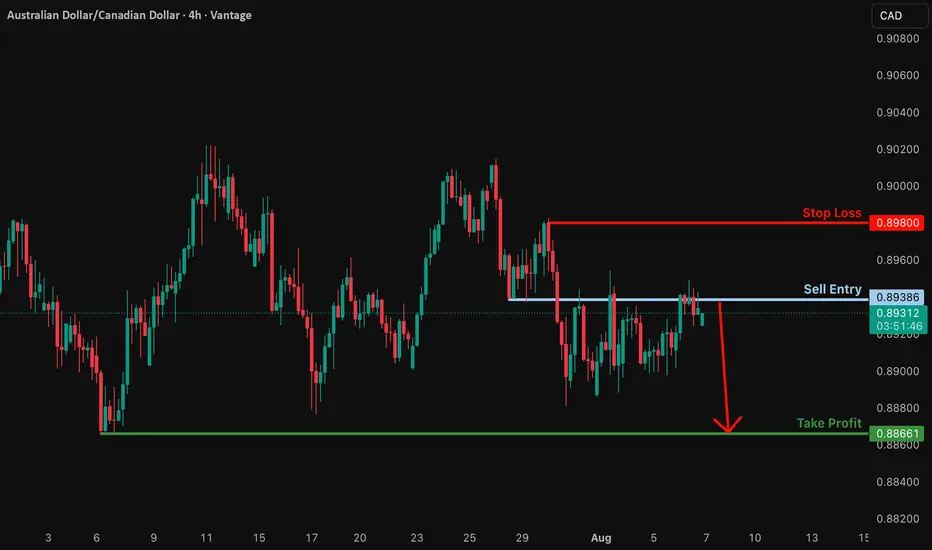
Potential bearish drop?AUD/CAD is reacting off the resistance level, which is a pullback resistance, and could drop from this level to our take-profit.
Entry: 0.89386
Why we like it:
There is a pullback resistance.
Stop loss: 0.8980
Why we like it:
There is a pullback resistance.
Take profit: 0.8866
Why we like it:
There is a swing low support.
Enjoying your TradingView experience? Review us!
Please be advised that the information presented on TradingView is provided to Vantage (‘Vantage Global Limited’, ‘we’) by a third-party provider (‘Everest Fortune Group’). Please be reminded that you are solely responsible for the trading decisions on your account. There is a very high degree of risk involved in trading. Any information and/or content is intended entirely for research, educational and informational purposes only and does not constitute investment or consultation advice or investment strategy. The information is not tailored to the investment needs of any specific person and therefore does not involve a consideration of any of the investment objectives, financial situation or needs of any viewer that may receive it. Kindly also note that past performance is not a reliable indicator of future results. Actual results may differ materially from those anticipated in forward-looking or past performance statements. We assume no liability as to the accuracy or completeness of any of the information and/or content provided herein and the Company cannot be held responsible for any omission, mistake nor for any loss or damage including without limitation to any loss of profit which may arise from reliance on any information supplied by Everest Fortune Group.
EURUSD SHORTHere on these post, i shared short analysis on PEPPERSTONE:EURUSD , Combining both weeklyTF and dailyTF chart, for further info, see the content of the video.

EURUSD SELLGlobal equities rose on Thursday, with Japanese shares hitting a record high, as tech-led gains on Wall Street, upbeat earnings, growing hopes for a ceasefire in Ukraine and expectations for U.S. rate cuts boosted sentiment.

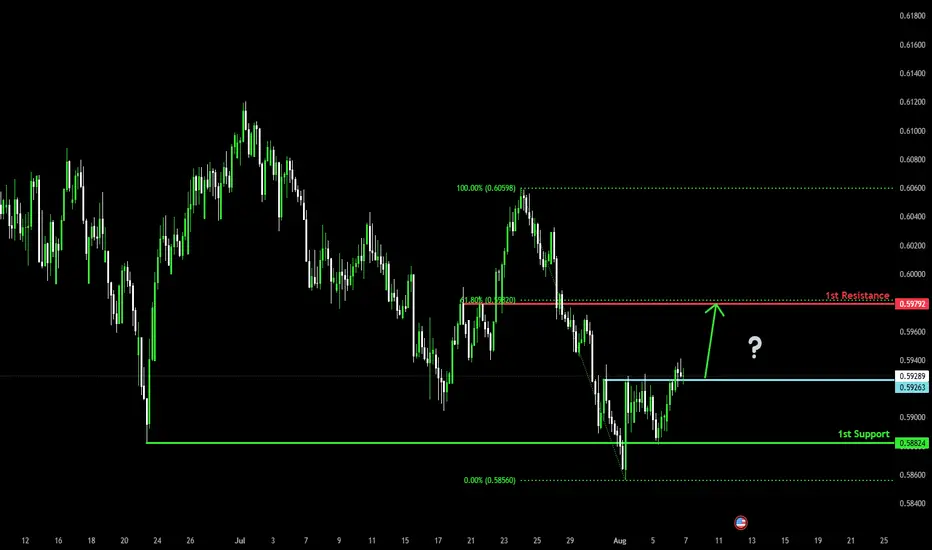
Could the Kiwi bounce from here?The price is falling towards the pivot, which is a pullback support and could potentially rise to the 1st resistance which aligns with the 61.8% Fibonacci retracement.
Pivot: 0.5926
1st Support: 0.5882
1st Resistance: 0.5979
Risk Warning:
Trading Forex and CFDs carries a high level of risk to your capital and you should only trade with money you can afford to lose. Trading Forex and CFDs may not be suitable for all investors, so please ensure that you fully understand the risks involved and seek independent advice if necessary.
Disclaimer:
The above opinions given constitute general market commentary, and do not constitute the opinion or advice of IC Markets or any form of personal or investment advice.
Any opinions, news, research, analyses, prices, other information, or links to third-party sites contained on this website are provided on an "as-is" basis, are intended only to be informative, is not an advice nor a recommendation, nor research, or a record of our trading prices, or an offer of, or solicitation for a transaction in any financial instrument and thus should not be treated as such. The information provided does not involve any specific investment objectives, financial situation and needs of any specific person who may receive it. Please be aware, that past performance is not a reliable indicator of future performance and/or results. Past Performance or Forward-looking scenarios based upon the reasonable beliefs of the third-party provider are not a guarantee of future performance. Actual results may differ materially from those anticipated in forward-looking or past performance statements. IC Markets makes no representation or warranty and assumes no liability as to the accuracy or completeness of the information provided, nor any loss arising from any investment based on a recommendation, forecast or any information supplied by any third-party.
AUD eyes yield advantage over USD UBS strategists view the Australian dollar as a compelling long opportunity at current levels, supported by expectations that the Reserve Bank of Australia will ease policy more gradually than the U.S. Federal Reserve.
The bank forecasts 75 basis points of rate cuts from the RBA through Q1 2026, compared to 100 basis points from the Fed—helping to preserve a relative yield advantage for the Aussie.
On the daily chart, AUD/USD remains within a well-defined ascending channel that began in late 2024. The pair recently bounced off the lower boundary of the channel near 0.6450, with long lower wicks potentially indicating dip-buying interest.
Immediate resistance could sit at 0.6600, followed by a major zone near 0.6670. A break above these levels could confirm bullish continuation.
