SPY Multi-Timeframe Breakdown (Weekly → 15m) + GEX for Nov. 24SPY Multi-Timeframe Breakdown (Weekly → 15m) + GEX & Options Plan
Let’s take a look across all timeframes to see what SPY wants to do next.
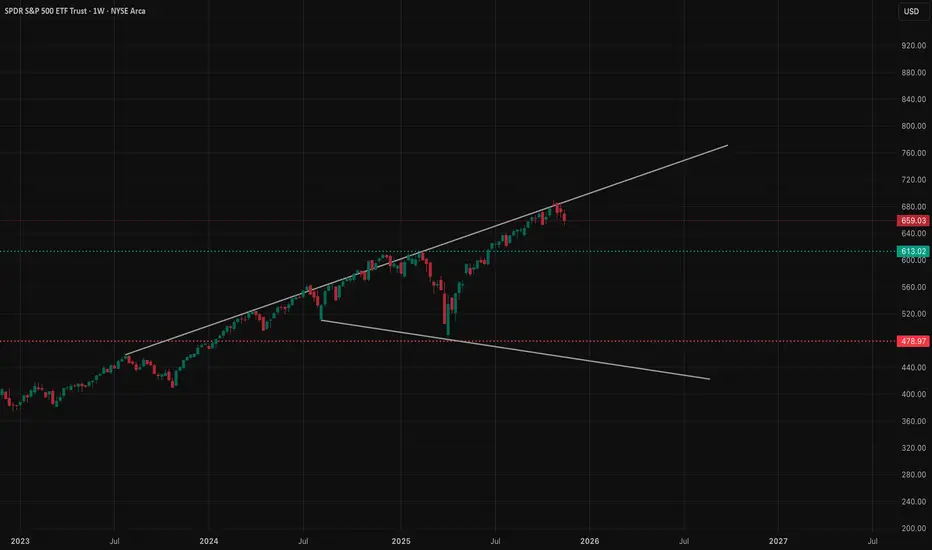
🟩 Weekly (1W) – Big Picture
On the weekly, SPY is still in a bullish long-term uptrend, riding that rising channel since 2024.
But right now price is:
✅ at the
ETF market
November 24 - November 28 2025I have recently identified an area of weakness in my trading style. Too often I find myself front-running trades by setting my bias based on where I think my Macro indicators are headed vs where they are positioned currently. Macro moves much slower than equities, so I should instead be looking for

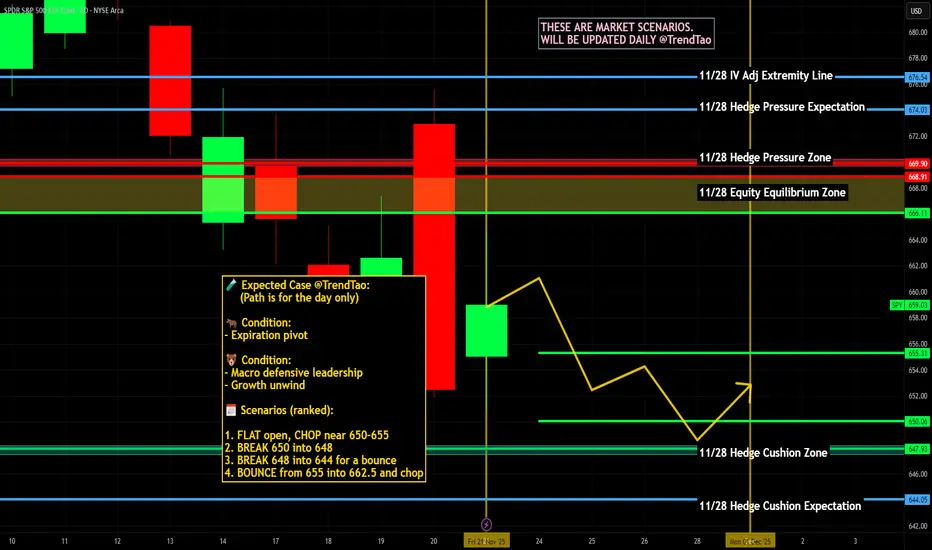
$SPY and $SPX Scenarios — Week of Nov 24 to Nov 28, 2025🔮 AMEX:SPY and SP:SPX Scenarios — Week of Nov 24 to Nov 28, 2025 🔮
🌍 Market-Moving Headlines
📉 Shutdown backlog week: Most major September reports finally drop on Tuesday and Wednesday — Retail Sales, PPI, Durable Goods — all of which normally move markets but are arriving late due to the Octob
Bias still downSo far the rally looks very strong but keep in mind we have not broken above the daily 18ma, nor has the Vix broken under it's 18ma. Bias is still down and we are still making (so far) lower highs and lower lows. I believe this is a trap into tomorrow and I still think 645-640 will be the ultimate t

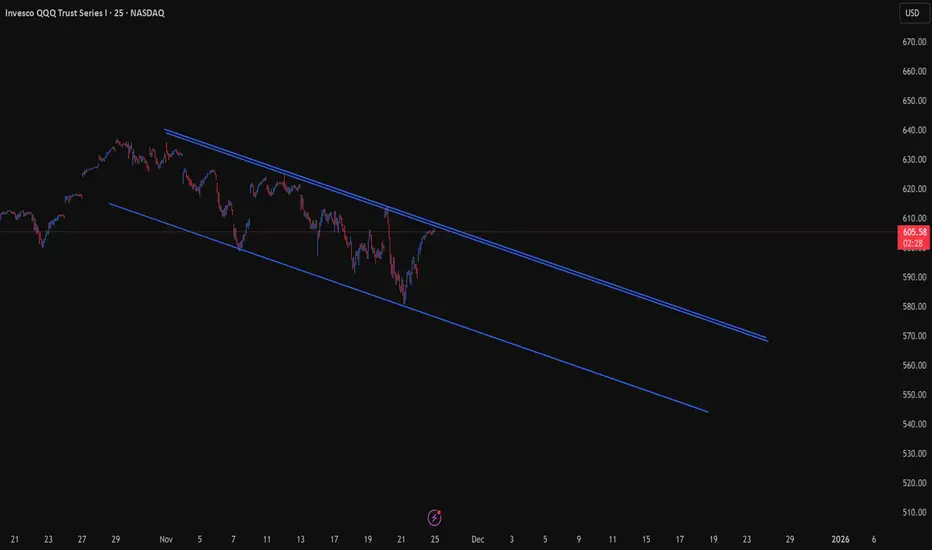
The Geometry of the Week: QQQ Inside the Declining ChannelThis week’s market map centers on a single dominant structure —
a perfect declining parallel channel guiding QQQ through the entire November decline.
Price is now rallying back into the upper rail, the same geometric boundary that rejected every advance this month.
This rail rises at a 1×2 natural
SOXL in BUY ZONEMy trading plan is very simple.
I buy or sell when at either of these events happen:
* Price tags the top or bottom of parallel channel zones
* Money flow volume spikes beyond it's Bollinger Bands
So...
Here's why I'm picking this symbol to do the thing.
Price in buying zone at bottom of channels

VGT watch $710-729: Double Golden Zone should launch next LegVGT has been correcting like most of the tech sector.
Now launching out of a Double Golden zone $710.68-729.51
Look for a Break-n-Retest of upper boundary for long entries.
.
See "Related Publications" for other examples of Golden Fibs at work ------->>>>>>>>>>>>

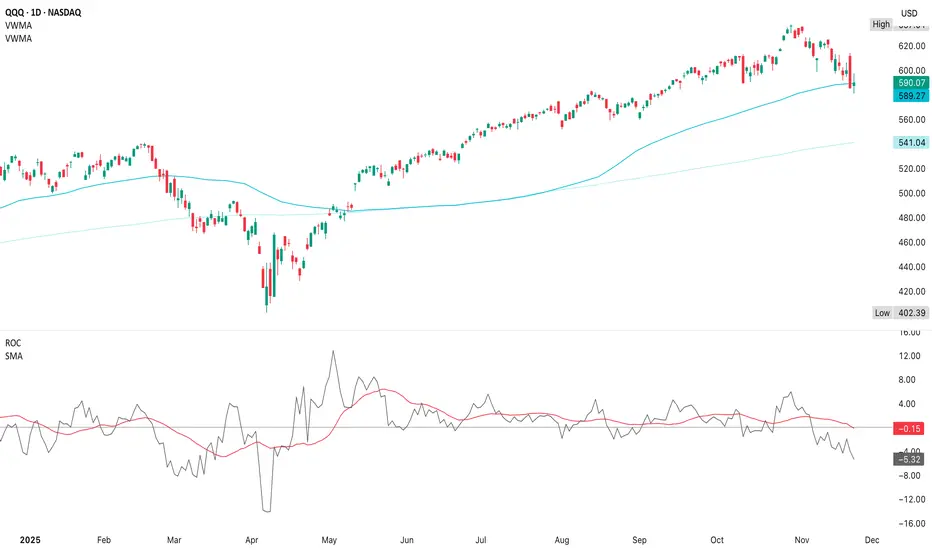
QQQ (21 November)VWMA is like an EMA, but weighted by volume, so it tells you what price the heavy money is actually paying & it exposes trend shifts earlier than simple moving averages
The 20d VWMA is curling down which shows that the short-term trend has firmly turned bearish
This downturn began well before th
Weekly QQQ (NQ-US100) Outlook - Prediction (23 NOV)Weekly QQQ (NQ-US100) Outlook - Prediction
📊 Market Sentiment
Market sentiment is driven by fear at the moment. In my opinion, we are trading inside a bearish zone. Unless we get meaningful data or positive news, I expect the market to continue declining. Core PPI will be released on Tuesday at

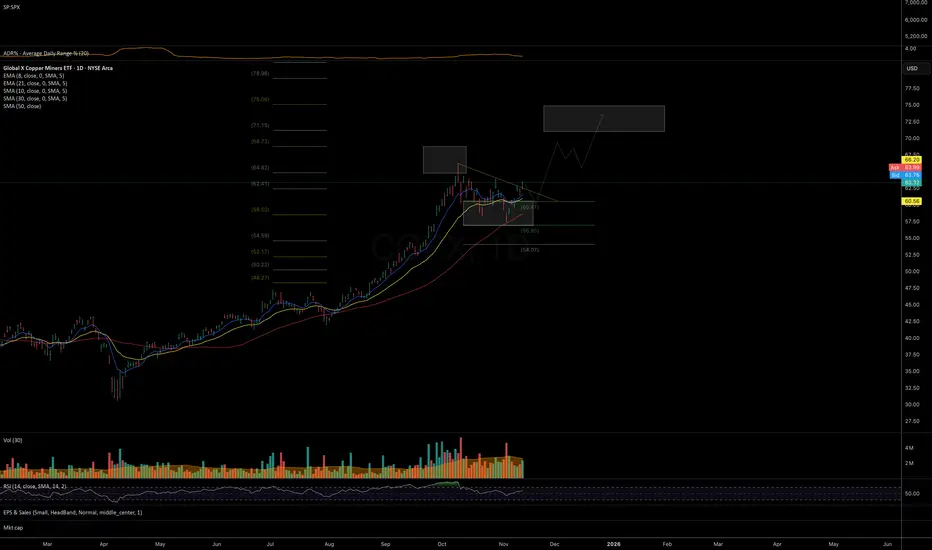
COPX: watching for upside momentum to continue Price is reacting constructively from the ideal mid-term support area established at the November bottom.
The trend structure suggests potential for at least one more leg to the upside into the 71–75 resistance zone, as long as the November lows continue to hold.
Chart:
See all popular ideas
Community trends
SymbolPrice & chgNAV total return 1Y
SymbolNAV total return 1Y / Price
SymbolPrice & chgDividend yield FWD
SymbolDividend yield FWD / Price
ETF collections
LargestHighest AUM growthHighest returnsBiggest losersEquityBitcoinEthereumGoldFixed incomeReal estateTotal marketCommoditiesAsset allocationInverseLeveragedMost tradedLargest inflowsLargest outflowsHighest discount to NAVHighest premium to NAVHighest yieldDividendMonthly distributionsHighest diversificationActively managedSectorHighest betaLowest betaNegative betaHighest expense ratioAll-time highAll-time low52-week high52-week lowETFs of the USAETFs of CanadaETFs of the United KingdomETFs of GermanyETFs of JapanETFs of AustraliaSee all