SPY Forming A Bearish Head and Shoulders PatternSPX Technical Update – Bearish Watch
Chart Focus: S&P 500 Index (30-Min Chart)
Date: July 21, 2025
🧠 Pattern Watch: Classic Head & Shoulders Formation
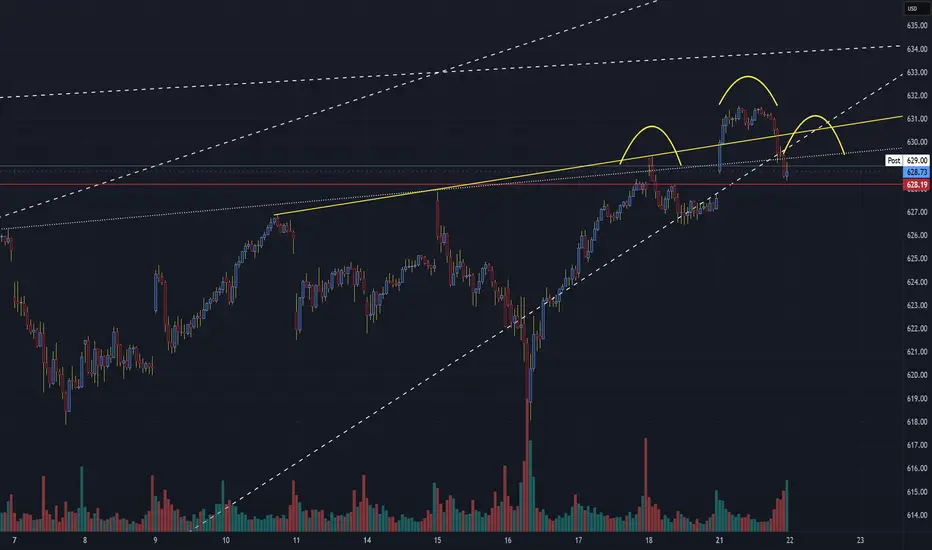
A clear head and shoulders pattern has emerged on the short-term 30-minute chart, signaling a potential bearish reversal after the recent uptrend.
Left Shoulder: Around 630.75
Head: Peaked near 633.00
Right Shoulder: Capped just under 631.00
Neckline: Sits near the 628.75–628.20 zone, marked by a yellow upward-sloping trendline and tested support.
📉 Bearish Breakdown in Play
The price has now broken below the neckline zone at 628.75 with increasing volume — an early confirmation of a bearish break.
The break beneath the rising wedge support and neckline suggests increased downside risk in the near term.
🧭 Technical Levels to Watch
Key Level Type Action
633.00 Resistance (Head) Likely capped unless strong reversal
631.00 Resistance Right shoulder, overhead rejection
628.75 Neckline Support (Broken) Bearish trigger zone
628.20 Intraday support Final support test (now resistance)
625.50 Initial Target Breakdown projection
622.75 Lower Support Measured move target zone
📌 Measured Move Projection:
A break of ~4.5 points from head to neckline projects a target near 624–625 in the near term.
📊 Volume Profile Note
Volume expanded on the neckline break, supporting the validity of the pattern.
Recent bars show a rise in selling pressure as bulls failed to reclaim above 630 after the breakdown.
🔍 Summary Outlook
Bearish Bias: Valid while below 628.75 neckline resistance.
Invalidation Zone: A sustained close above 631.00 would invalidate the bearish pattern.
Watch for Retest: Any bounce into 628.75–629.25 could act as a retest and fade opportunity.
📆 Next Steps:
Short-term traders should monitor price action around 625.50 and 622.75 as the most likely zones for support. Watch for further confirmation with broader index weakness or macro catalysts.
ETF market
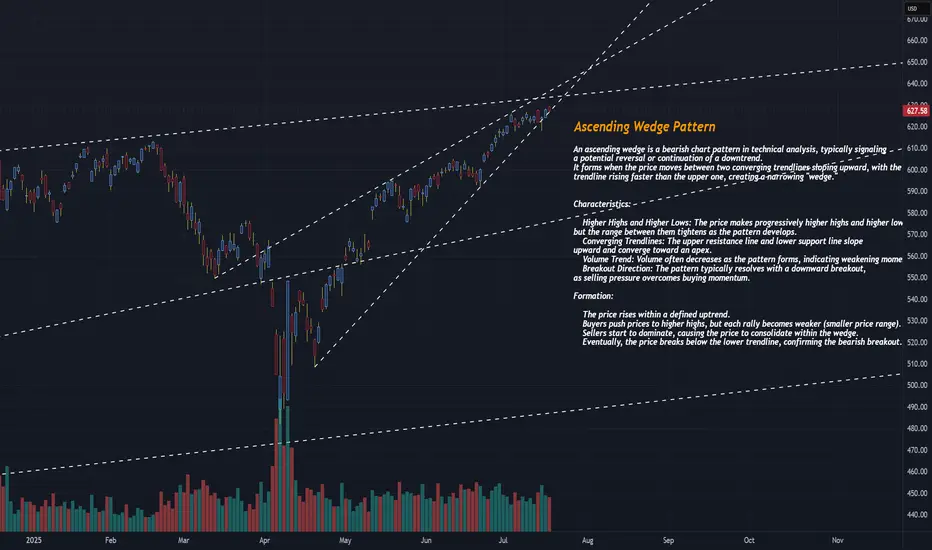
SPY CONTINUES IN AN ASCENDING WEDGE PATTERNThe SPDR S&P 500 ETF Trust (SPY) is currently exhibiting an ascending wedge pattern on the 30-minute chart, a bearish technical pattern that often signals a potential reversal or selloff when confirmed. Below, I’ll explain the ascending wedge pattern, identify key levels to watch for a potential selloff, and provide context based on recent market sentiment. Since I cannot view the real-time chart, I’ll base the analysis on the characteristics of an ascending wedge and recent posts on X that discuss SPY’s price action, ensuring a critical approach to the data.
What is an Ascending Wedge Pattern?
An ascending wedge (or rising wedge) is a bearish chart pattern formed when the price consolidates between two upward-sloping trendlines that converge over time. The upper trendline (resistance) connects higher highs, and the lower trendline (support) connects higher lows, creating a narrowing price range. This pattern typically indicates that bullish momentum is weakening, as buyers are pushing prices higher but with diminishing strength, often leading to a breakdown below the lower trendline.
Key characteristics of an ascending wedge include:
Converging Trendlines: Both the support and resistance lines slope upward, with the support line often steeper than the resistance line.
Decreasing Volume: Trading volume typically declines as the pattern forms, reflecting reduced buying conviction. A spike in volume often accompanies a breakout or breakdown.
Bearish Implication: In an uptrend, the ascending wedge signals a potential reversal to the downside. In a downtrend, it may act as a continuation pattern, but the bearish bias remains.
Breakout Confirmation: A convincing break below the lower trendline, preferably with increased volume, confirms the bearish reversal. A retest of the broken support (now resistance) may occur before further declines.
The pattern typically forms over 3–4 weeks but can appear on shorter timeframes like the 30-minute chart, making it relevant for intraday or short-term traders.investopedia.comen.wikipedia.org
SPY’s Current Ascending Wedge on the 30-Minute Chart
Given that SPY is in an ascending wedge on the 30-minute chart, we can infer the following based on recent posts on X and general technical analysis principles:
Pattern Context:
The ascending wedge suggests SPY has been making higher highs and higher lows in a tightening range, indicating a potential exhaustion of the bullish trend.
Recent posts on X (e.g., @AskPerplexity on July 16, 2025) noted a rising wedge in SPY with a breakdown through the lower trendline, suggesting bearish momentum. Another post (@YakshuMadaan on July 15, 2025) mentioned a wedge breaking below 6220, targeting 6050 on the S&P 500 index ( SP:SPX ), which correlates to SPY levels around $605–$610.
Key Levels to Watch:
Lower Trendline (Support): The critical level to monitor is the lower trendline of the wedge, which connects the higher lows. A decisive break below this level (e.g., a close below on the 30-minute chart with strong volume) signals a bearish breakdown and potential selloff. Based on recent X posts, this level may have been around $622 (equivalent to ~6220 on SP:SPX ) recently, but you should confirm the exact level on the current chart.
Upper Trendline (Resistance): The upper trendline connects the higher highs and acts as resistance. If SPY fails to break above this level, it reinforces the bearish bias. This could be near recent highs, potentially around $630–$635, depending on the chart’s progression.
Support Zones Post-Breakdown: If the lower trendline breaks, key support levels to watch include:
$590–$600: A post on X highlighted this as a major support zone based on volume profile analysis, likely corresponding to a prior consolidation area or gap fill.
$605–$610: Another post suggested a target of 6050 on SP:SPX , translating to roughly $605–$610 for SPY, aligning with a significant retracement level.
Retest Level: After a breakdown, the price may retest the broken lower trendline (now resistance). For example, if the breakdown occurs at $622, a retest could see SPY rally back to $622–$625 before resuming the decline.ig.com
Volume and Indicators:
Volume: Look for declining volume as the wedge forms, followed by a spike on the breakdown to confirm the move. Low volume during the wedge suggests waning bullish momentum.xs.com
Relative Strength Index (RSI): An RSI above 70 near the upper trendline or showing bearish divergence (lower RSI highs while price makes higher highs) strengthens the case for a selloff.xs.com
Moving Average Convergence Divergence (MACD): A bearish crossover (MACD line crossing below the signal line) near the upper trendline can confirm weakening momentum.xs.com
Potential Selloff Triggers:
A close below the lower trendline on the 30-minute chart, especially with a spike in volume, is the primary trigger for a selloff. For example, a break below $622 (if that’s the current support) could initiate a move toward $605–$610 or lower to $590–$600.
A failed retest of the broken trendline (e.g., SPY rallies to $622–$625 after breaking down but fails to reclaim the trendline) would confirm bearish continuation.
Broader Market Context: Recent X posts suggest market concerns about macroeconomic factors (e.g., interest rate fears, policy shifts) could amplify a selloff, especially if technical levels break.
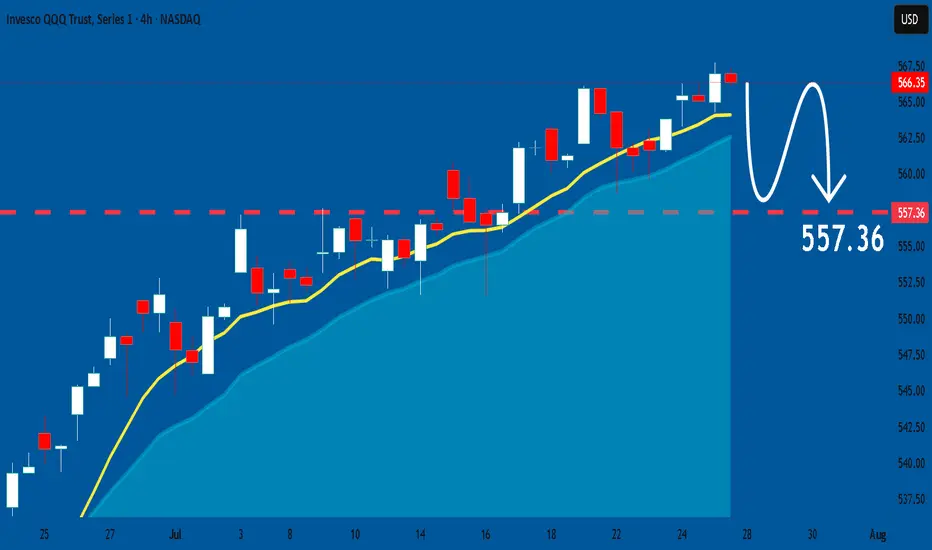
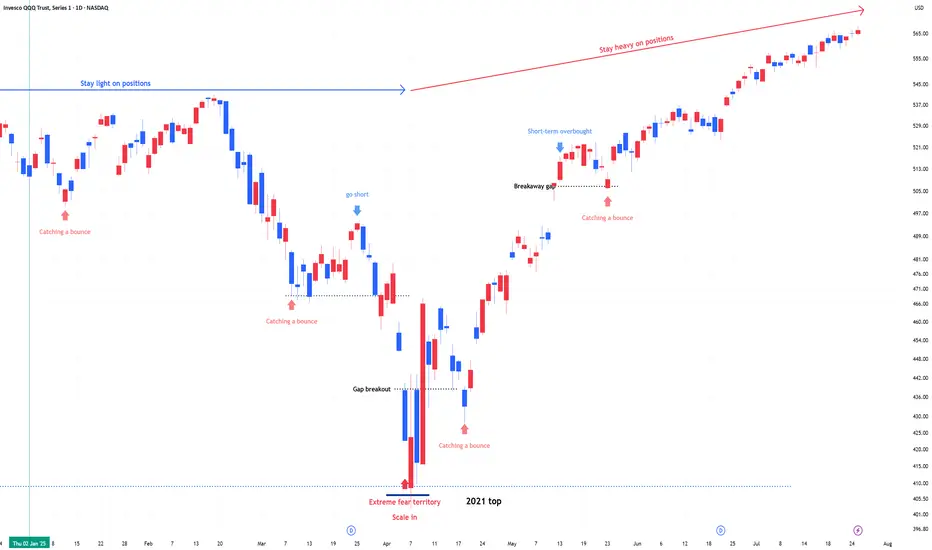
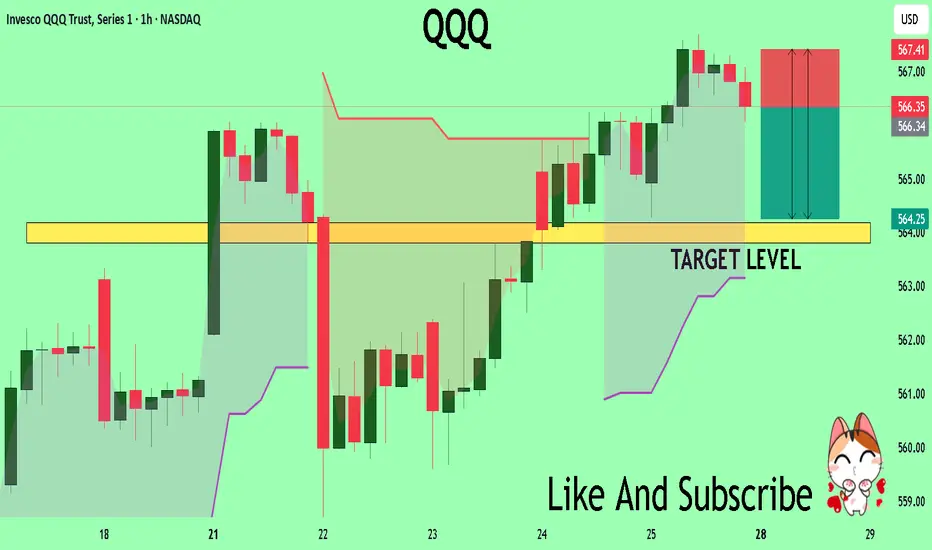
QQQ: Price Action & Swing Analysis
The analysis of the QQQ chart clearly shows us that the pair is finally about to tank due to the rising pressure from the sellers.
Disclosure: I am part of Trade Nation's Influencer program and receive a monthly fee for using their TradingView charts in my analysis.
❤️ Please, support our work with like & comment! ❤️
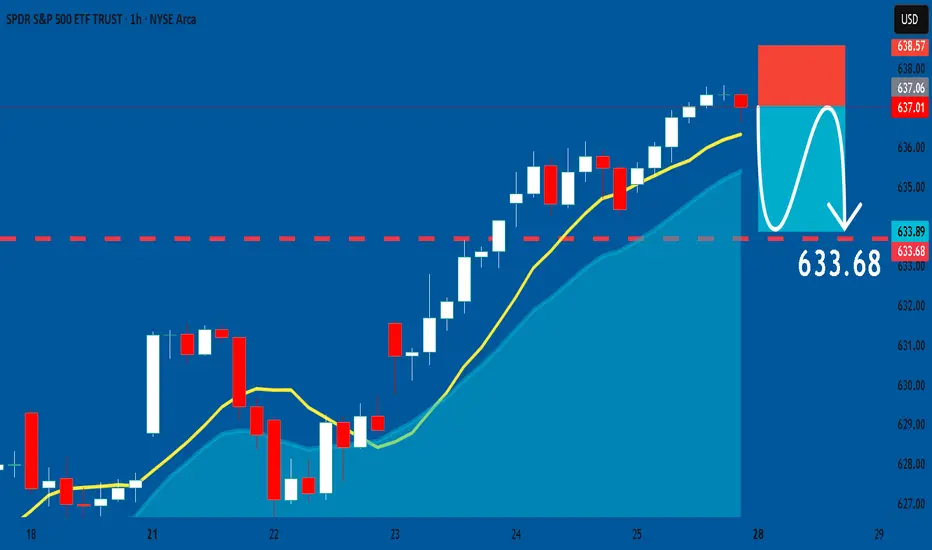
SPY Will Collapse! SELL!
My dear subscribers,
This is my opinion on the SPY next move:
The instrument tests an important psychological level 637.01
Bias - Bearish
Technical Indicators: Supper Trend gives a precise Bearish signal, while Pivot Point HL predicts price changes and potential reversals in the market.
Target - 628.63
About Used Indicators:
On the subsequent day, trading above the pivot point is thought to indicate ongoing bullish sentiment, while trading below the pivot point indicates bearish sentiment.
Disclosure: I am part of Trade Nation's Influencer program and receive a monthly fee for using their TradingView charts in my analysis.
———————————
WISH YOU ALL LUCK
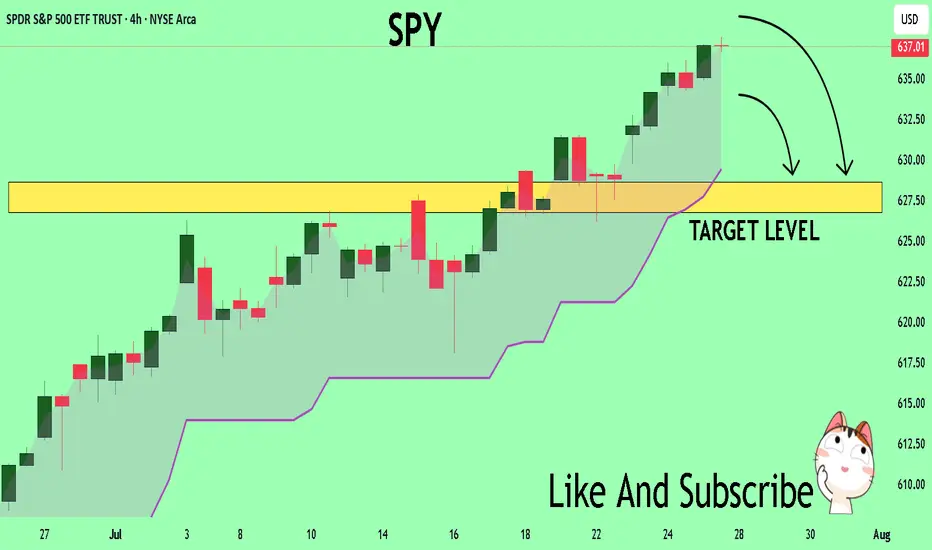
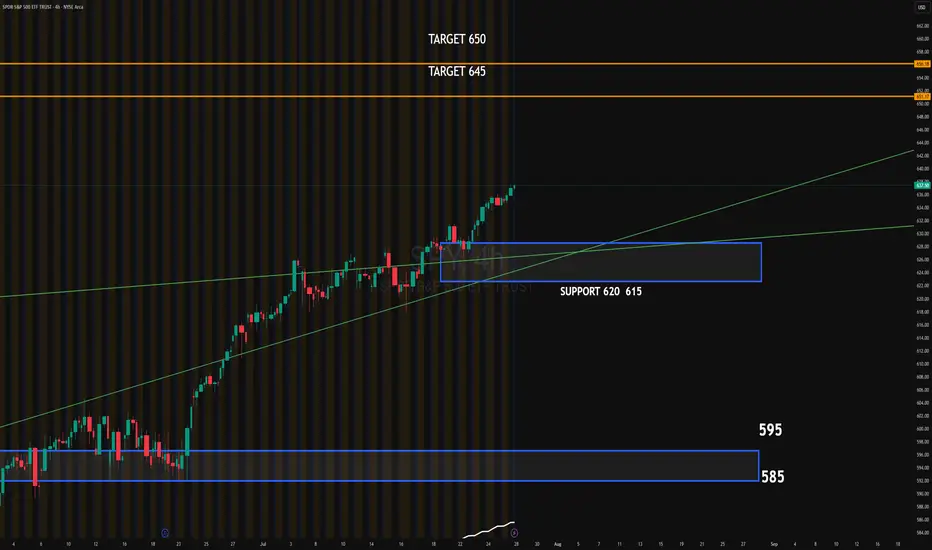
SPY 4HSSPY continues its bullish trend after breaking above the ascending channel. The recent breakout shows strong momentum, supported by institutional absorption around the 620–615 zone. This area now acts as key support.
Upside target: 645
Extended target: 650
Downside target if momentum fails: 620–615 zone, followed by 595
#SPY #globaltrade #investment #investing #stockmarket #wealth #realestate #markets #economy #finance #money #forex #trading #price #business #currency #blockchain #crypto #cryptocurrency #airdrop #btc #ethereum #ico #altcoin #cryptonews #Bitcoin #ipo


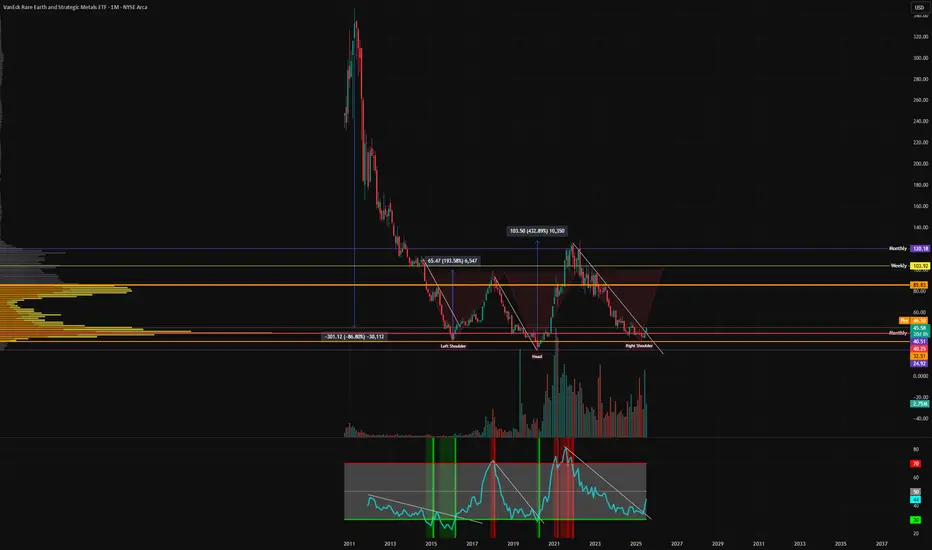
Rare Earth UpdateTo provide an update on why I went long Rare Earth. I noticed the after hours move up on MP materials, at 20% increase before market open which quickly became a 50% move when trading started. This particular ETF holds MP Material as a major holding and it hadn't moved much as it should have. I posted a trade idea on Lynas, which went up the following day. The TA on this chart suggests the move up may have plenty of room to the upside.
This is a highly cyclical ETF, as expected from any mining related asset. There's periods of huge drawdowns followed by sharp moves to the upside. We have broken out of the downtrend, we have held the POC as support and bullish volume suggests the move is not a fakeout.
Zooming out, I see a giant inverse head and shoulders pattern. You can also see the RSI downtrend has been broken.
Not financial advice, congratulations to anyone who took the trade on this with me. I have moved my stop loss to break even, if price breaks below I will get stopped out with no loss.
Not financial advice, do what's best for you.
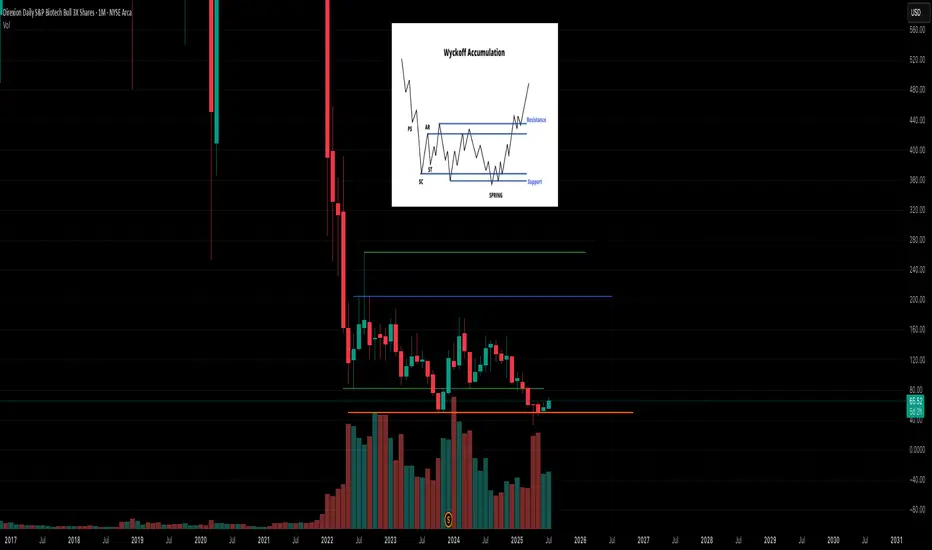
If you can hold for 2 years could be a nice entry around here haLooks to be in a very SLOW accumulation process. We will have a BIO-tech revolution it's inevitable; just make take years before it actually manifests in the sector. I have psoriasis and the should be a FKIN cure by now rofl. BS. AI will make it happen. MONTHLY CHARY

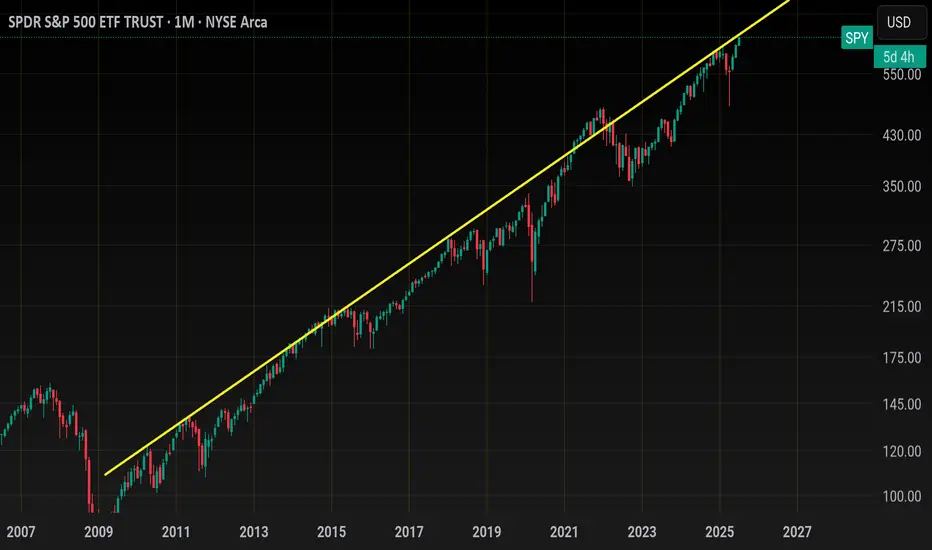
Spy.. 650 topLooking for a top this week
The top of this monthly trendline dating from 2009 should be tagged this week around 643-645.00. As you can see price can grind up here for weeks until the BIG drop.
That grind would possibly be distribution with
A range trade of 620-640 for the month of august. historically Sept is very bearish and could see a drop back below 600 then.
Summer price action looks like so
Smaller price action (Tradeable technicals)
Bull flag early July has us squeezing up this last leg here..
If we gap up Sunday night then i like the short around 638ish
If we gap down and flush i like the dip buy around 634 gap close with the next target being 640+
Daily candle closed outside Bbands so I would not long this on any gap up... on a big earnings week like this, there will be a shake out day or a flush to try and stop out all of those who bought long last week for this weeks earnings.
TVC:NYA or NYSE
Has also reached the top of its weekly channel here. 21,000 will be tough. Price could grind up here but I'd be careful trading anything non tech.
As far as tech goes
Here's NASDAQ:QQQ
monthly chart (Logarithmic)
We have room for 575-580
This should compliment Spy 550
Zoomed in on the daily chart and it's climbing back up to the resistance shown on the monthly
Hourly chart shows price action from early july... tight channel illustrates how frustrating the swings have been
562-563 is support heading into next week. If we have a major gap up Sunday night I would look to open short near 570 for a pullback before ER... if we gap down, I would buy the dip around 563 and average down if need be down to 561..
We should tag 575 this week
The sector that I think lags the most this week is the banking sector... AMEX:XLF
Banks outperform the entire market last week and are overheated at resistance I think they lag this week
I will update this more throughout the week if necessary..
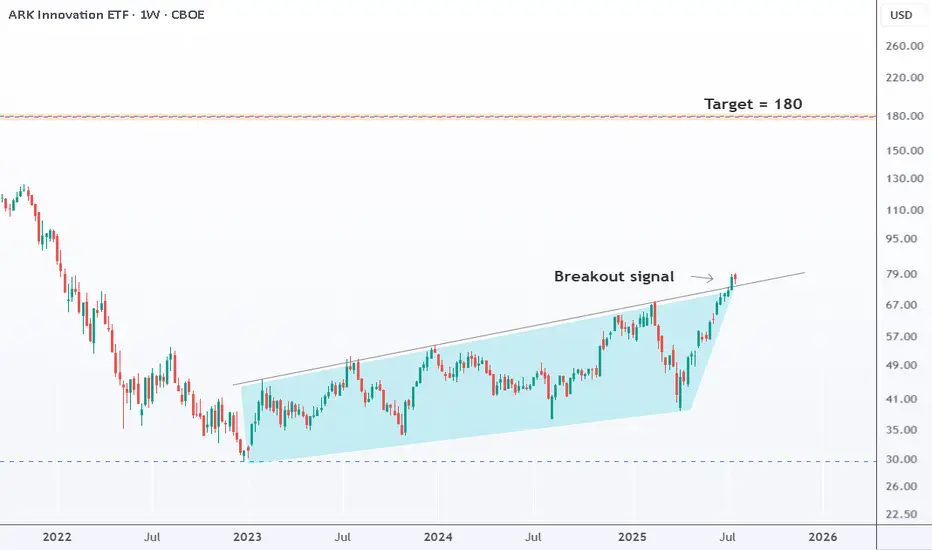
ARKK looks like it's breaking outARKK is signaling a breakout, with price likely to push higher toward the 180 target. The pattern looks strong. The only sign that would invalidate the breakout is a drop below 72. unless that happens, the bullish view remains.
SPY: Bearish Continuation & Short Signal
SPY
- Classic bearish setup
- Our team expects bearish continuation
SUGGESTED TRADE:
Swing Trade
Short SPY
Entry Point - 637.01
Stop Loss - 638.57
Take Profit - 633.58
Our Risk - 1%
Start protection of your profits from lower levels
Disclosure: I am part of Trade Nation's Influencer program and receive a monthly fee for using their TradingView charts in my analysis.
❤️ Please, support our work with like & comment! ❤️
QQQ Massive Short! SELL!
My dear followers,
This is my opinion on the QQQ next move:
The asset is approaching an important pivot point 566.35
Bias - Bearish
Safe Stop Loss - 567.41
Technical Indicators: Supper Trend generates a clear short signal while Pivot Point HL is currently determining the overall Bearish trend of the market.
Goal - 564.18
About Used Indicators:
For more efficient signals, super-trend is used in combination with other indicators like Pivot Points.
Disclosure: I am part of Trade Nation's Influencer program and receive a monthly fee for using their TradingView charts in my analysis.
———————————
WISH YOU ALL LUCK

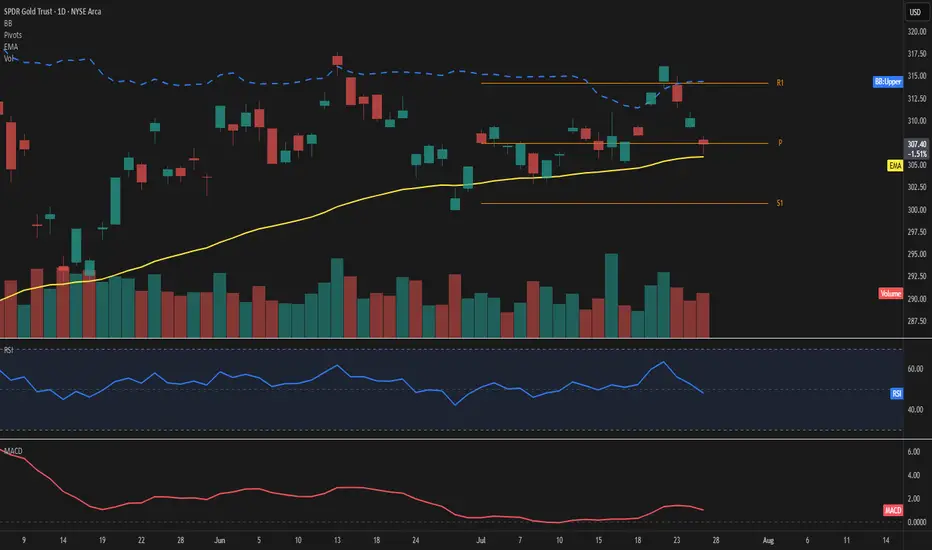
GLD – Price consolidates at highsPrice is hovering just above the 50-day EMA at 307, showing signs of short-term hesitation near the Fibonacci pivot. The upper Bollinger Band sits at 314, leaving moderate room for expansion if momentum picks up.
The RSI reads 48, reflecting a balanced setup without clear directional bias. MACD remains slightly positive, suggesting a still-constructive but soft momentum.
Key levels to watch include the pivot at 307 and the support at 301. On the upside, the 314 area aligns with both R1 and the upper band, acting as the next challenge.
Volume is up sharply (+22%) despite a mild -0.9% price pullback, indicating possible accumulation beneath the surface.
As long as price holds above the 50-day EMA, the structure remains intact.
A move away from the pivot zone will likely define the next directional wave.
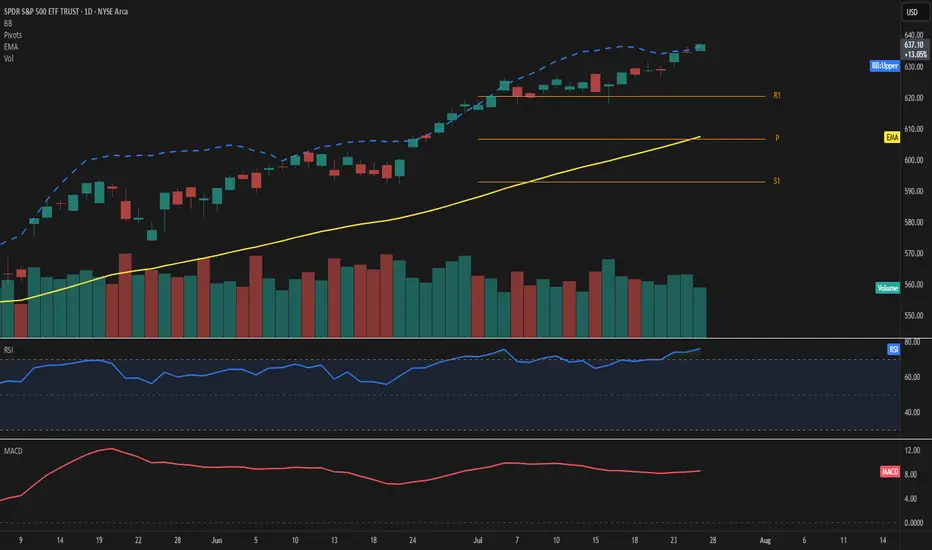
SPY – Explosive strength above resistancePrice extends well above the 50-day EMA and pierces through the upper Bollinger Band, highlighting strong bullish momentum. RSI stands at 76, confirming overbought conditions, while MACD remains firmly positive.
The ongoing move leaves the EMA50 at 608 and the Fibonacci pivot at 607—both now acting as key support levels. With R1 at 620 already surpassed, the next potential resistance zone lies in uncharted territory beyond 636.
Volume has decreased by over 20%, which tempers the move slightly and should be monitored closely.
As long as price holds above 620, the bullish scenario remains valid.
Watch for any sudden spike in volume or a drop back below 636 as a possible shift signal.
“Buy the rumor, sell the news”
---
### 🎯 **“Buy the Rumor, Sell the News” – A Trader’s Mind Game**
Imagine you’re not just following the market… you’re dancing ahead of it. This strategy flips traditional thinking on its head—and rewards those bold enough to act **before** the spotlight hits.
---
### 🕵️♂️ **Step One: Buy the Rumor**
- Traders catch whispers—like talk of a potential interest rate hike.
- The markets start to react *before* anything official is announced.
- Assets like gold might drop on the expectation alone… that’s your **entry point**.
You're not buying certainty. You're buying what the crowd *thinks* will happen.
---
### 🔊 **Step Two: Sell the News**
- Once the news breaks, it's already "old" to seasoned traders.
- That shocking headline? Already priced in.
- The market might reverse or surge unpredictably.
- This is when savvy traders exit, locking in profits from those who just arrived.
---
### 🧠 **Why It Works**
- Financial markets aren’t just driven by facts—they’re powered by **sentiment** and **anticipation**.
- By the time news goes public, smart money has already moved.
It’s like buying concert tickets before the band announces a tour—then selling them the moment fans go wild.
---
### 📉 **A Real Example**
- **Monday Rumor**: “The Fed will raise interest rates.”
- Gold begins to slide as traders prepare—this is your chance to act.
- **Thursday News**: The hike is confirmed.
- Instead of dropping further, gold might **rise** due to market overreaction or repositioning.
- You **sell** into that chaos—profit made.
---

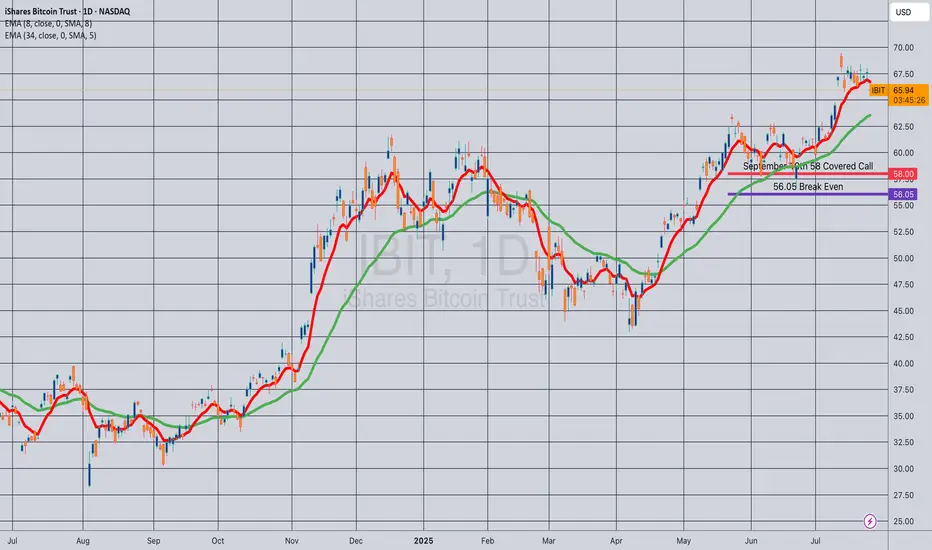
Opening (IRA): IBIT Sept 19th 58 Covered Call... for a 56.05 debit.
Comments: Selling the -75 delta call against shares to emulate the delta metrics of a +25 delta short put to take advantage of higher IV on the call side and the built-in defense of the short call.
Metrics:
Buying Power Effect/Break Even: 56.05
Max Profit: 1.95
ROC at Max: 3.48%
50% Max: .98
ROC at 50% Max: 1.74%
Will generally look to take profit at 50% max, add at intervals assuming I can get in at break evens better than what I have on.
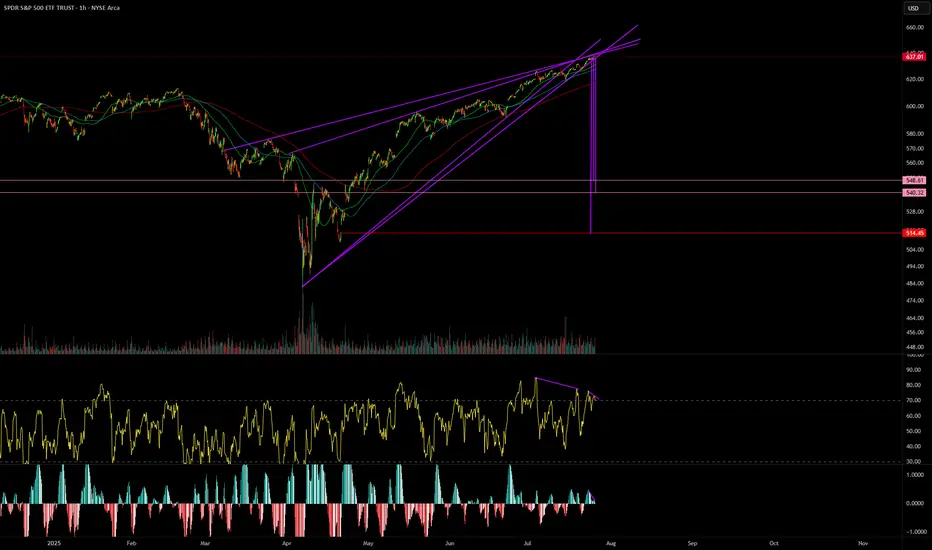
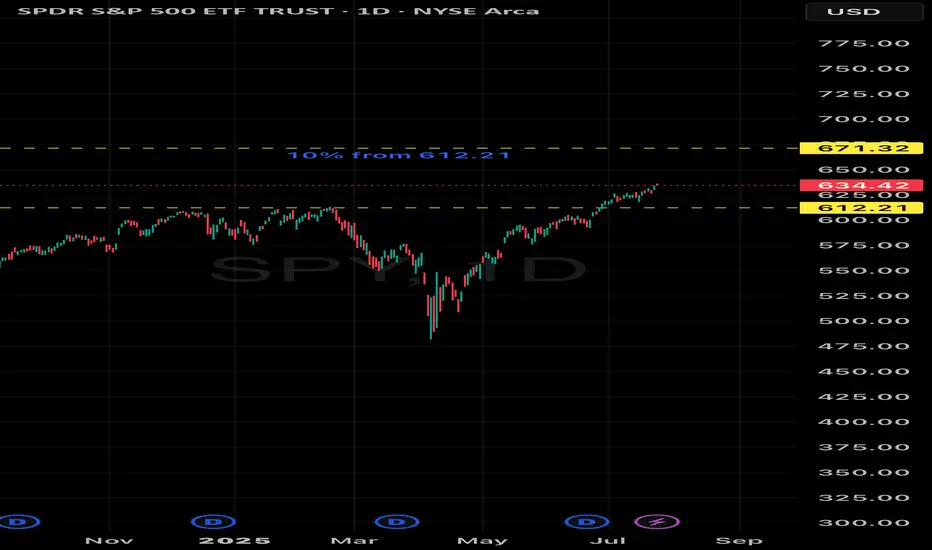
A tale of two wedgesIn early 2025 we’ve seen two classic wedge patterns on two of the market’s most watched charts: a falling wedge on the U.S. Dollar Index ( TVC:DXY ) and a rising wedge on the S&P 500 ETF ( AMEX:SPY ). Alone each tells its own tale—but together they sketch a tug‑of‑war between a fading dollar and resilient equities.
The Falling Wedge on DXY
A falling wedge in a downtrend signals waning bearish momentum and often precedes a bullish reversal once price breaks the upper trendline.
The Rising Wedge on SPY
A rising wedge in an uptrend is classically a bearish reversal pattern —a breakdown below the lower trendline confirms sellers are gaining control.
A Converging Reversal
Given the well‑known inverse correlation between the dollar and most assets, it’s noteworthy that both asset classes are flashing signs of a reversal. Taken together that makes a compelling argument.

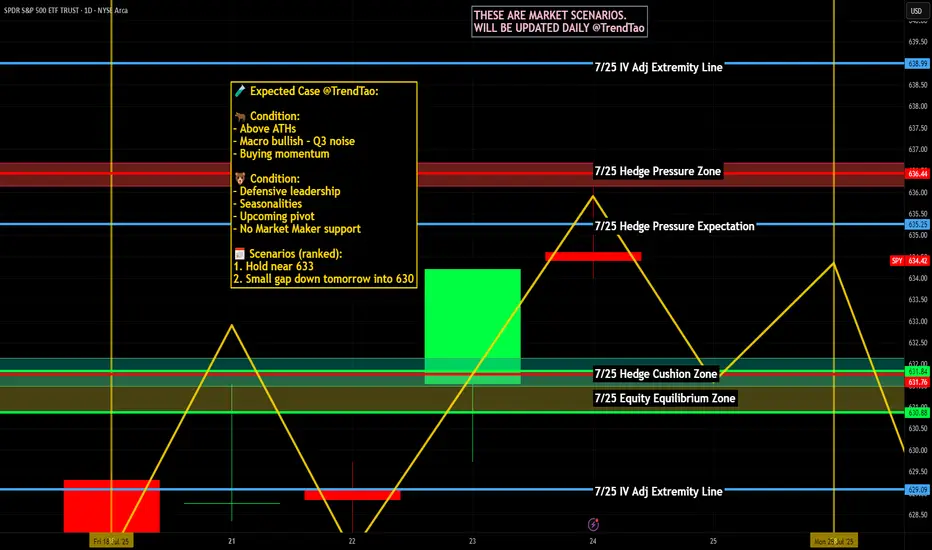
Nightly $SPY / $SPX Scenarios for July 25, 2025🔮 Nightly AMEX:SPY / CBOE:SPX Scenarios for July 25, 2025 🔮
🌍 Market‑Moving News 🌍
🏔️ Copper Market Flashpoint
Following President Trump’s announcement of steep copper tariffs (15–50% range), U.S. copper futures surged, then sharply reversed. Inventory arbitrage between CME and LME markets surged, distorting pricing dynamics and triggering concern over metal market stability.
🇪🇺 EU–China Summit Signals Trade Reset
EU leaders concluded their 25th summit with China, fostering deeper economic and strategic ties. Observers expect follow-up on mutual trade agreements, particularly regarding tech and sustainability sectors.
🌍 EM Equity Rally Consolidates Gains
Emerging markets continue to outperform global equities in 2025—with MSCI EM up ~18% vs. S&P 500. Analysts highlight strong opportunities in AI/fintech stocks in China and Latin America, suggesting further rotations out of U.S. markets.
📊 Key Data Releases & Events 📊
📅 Friday, July 25:
8:30 AM ET – Durable Goods Orders (June):
Forecast shows a sharp drop (~–10%), following a ~16% gain in May—signaling possible cooling in business-related equipment purchases.
10:00 AM ET – U.S. Imports of Steel Products (June):
Trade-data release monitoring steel flows amid evolving tariff frameworks.
All Day – Corporate Earnings Reports:
Companies such as First Financial Bancorp (FFBC), HCA, AON, Charter, and others report earnings. Outlooks may influence small- to mid-cap sentiment.
⚠️ Disclaimer:
This report is for educational and informational purposes only—not financial advice. Always consult a licensed financial advisor before making investment decisions.
📌 #trading #stockmarket #economy #data #earnings #commodities #EM #technicalanalysis