SPY Wave structureIf SPY sustains above 480 on monthly close, we can consider it as end of wave 4 and the beginning of wave 5. 640 will act as a resistance and once 640 is broken, SPY target would be 695-740 zone where SPY will complete its wave structure. The move from 640 to 700 is most likely retail fomo. Good zone for booking short term profits and for the stocks bought at end of wave 4
ETF market

$SPY - Recap of April 14 2025
Today, Monday April 14th we opened with a gap UP to the 30min 200MA and we also gapped right to the top of the bear gap (always considered resistance and strengthened by the downward momentum of the 30min 200.
We did see resistance with those combined bearish levels and we brought is back down to the middle, closed the gap from open and took it back to the 30min 200MA and got pushed back at close.
This chart setup was bearish today - even though we closed green - how? The 30in 200MA pointing down. The bear gap under that. And the 35EMA trading Under the 30min 200MA.
It was an easy trading day and just looking at the momentum you could feel that price was going to stay in the center of the implied move. At least I mentioned that in last night’s video.
Excellent day. How did you guys do??

Spy will 509ish hold if not watch out belowspy support. 509ish played out well for good profit will it hold this time

Nightly $SPY / $SPX Scenarios for April 15, 2025🔮 🔮
🌍 Market-Moving News 🌍:
🏦 Major Bank Earnings: Bank of America (BAC) and Citigroup (C) are set to report Q1 earnings before the market opens. BAC is expected to post an EPS of $0.81, while Citigroup anticipates $1.84. Investors will closely watch these reports for insights into the financial sector's health amid ongoing market volatility.
💊 Healthcare and Consumer Goods Reports: Johnson & Johnson (JNJ) is also scheduled to release its earnings, with forecasts indicating an EPS of $2.57. These results will provide a glimpse into the performance of the healthcare and consumer goods sectors.
📊 Key Data Releases 📊
📅 Tuesday, April 15:
📈 Import Price Index (8:30 AM ET):
Forecast: +0.1%
Previous: +0.4%
Measures the change in the price of imported goods, indicating inflationary pressures.
🏭 Empire State Manufacturing Survey (8:30 AM ET):
Forecast: -10.0
Previous: -20.0
Assesses manufacturing activity in New York State, providing early insights into industrial performance.
🗣️ Fed Governor Lisa Cook Speaks (7:10 PM ET):
Remarks may offer perspectives on economic developments and policy considerations.
⚠️ Disclaimer: This information is for educational and informational purposes only and should not be construed as financial advice. Always consult a licensed financial advisor before making investment decisions.
📌 #trading #stockmarket #economy #news #trendtao #charting #technicalanalysis

Bulls agree, Bears argueIf you look historically at price volatility, what you see is that bear markets make big candles, while bull markets churn out a lot of small ones. Even though a rebound seems imminent, don't overlook the fact that the candles, relatively speaking, are still big.

SOXL: A so risky scenerio!SOXL: risky scenerio
-Important key level at zone 7.7, forming Head and Shouder pattern with high supply volume.
-The uptrend structure has not yet been broken out, but if this key level been through, a risky scenerio for a deep sink.
.
Wait and see!
US STOCKS- WALL STREET DREAM- LET'S THE MARKET SPEAK!

SPY Short From Resistance! Sell!
Hello,Traders!
SPY went up again
To retest a wide horizontal
Resistance level of 551.00$
And as the political situation
Remains unstable we are
Bearish biased and we will
Be expecting a local move down
Sell!
Comment and subscribe to help us grow!
Check out other forecasts below too!
Disclosure: I am part of Trade Nation's Influencer program and receive a monthly fee for using their TradingView charts in my analysis.

Buying The Dip / Dollar Cost AveragingI recently published my first script and felt now would be a good time to share something I feel could help some people out. I have been trading since 2021 and it has been an amazing journey. Anyhow, I would consider myself a value based investor and in it for the long term.
So as the market takes a dip - now is certainly the time to be buying the dip or dollar cost averaging. The way I see it, if you are going to DCA/Buy The Dip, it might be handy to have access to a tool that is slightly better than just regularly timed investments.
Take a look at my indicator and let me know your thoughts.
Comment, Like and Follow if you enjoy the strategy and companion indicator.

S&P 500 Technical Analysis: Z-Score HMA Indicator OutlookOutside of the obvious news on Tarriffs, let's just focus on technicals for a moment:
In case you’re in a hurry:
My HMA Z-Score Probability Indicator is currently signaling overbought conditions.
The Z-Score has moved into the upper green zone, a level where reversals have historically occurred.
Hull Moving Average (HMA) remains upward for now, but is approaching a potential flattening point.
Price continues to respect a descending trendline, indicating resistance remains intact.
Unless the trendline is broken with conviction, the probability favors a bearish reversion in SPY.
HMA Z-Score Indicator Forecast: SPY Nearing Reversion Risk
This week, my HMA Z-Score Probability Indicator is signaling a statistically significant overbought condition in SPY. In case you are unfamiliar, this tool blends the statistical power of the Z-Score with the responsiveness of the Hull Moving Average to give us high-probability momentum and mean reversion setups.
Let’s break down what it’s showing right now and why a pullback may be imminent.
Z-Score in the Green: What That Means
The Z-Score component of my indicator is now in the upper green zone, which I’ve defined as statistically overbought territory. This isn’t arbitrary, it's based on historical distribution thresholds that flag when price has moved too far, too fast from its average.
In past instances when the Z-Score has reached these levels, the market has often reverted back toward the mean. It's not guaranteed, of course but the odds shift. This is one of the key features of my indicator: identifying these moments where the risk/reward tilts away from chasing price and toward anticipating a reversion.
HMA as a Momentum Filter
The Hull Moving Average (HMA) provides the trend context in this setup. Right now, the HMA is still pointing upward, but it’s starting to show early signs of rounding off. If it begins to flatten or turn downward while the Z-Score remains elevated, that would act as a confirmation of a momentum shift and strengthen the case for a pullback.
The HMA has consistently helped filter out false Z-Score signals when the trend is strong. But when both tools start aligning, that's when I pay closer attention.
Descending Trendline Holding as Resistance
On the chart, I’ve drawn a descending trendline connecting recent swing highs. So far, price has failed to break through this line, continuing a pattern of lower highs.
As long as price respects that line, it suggests sellers are still in control of the short-term structure. If SPY gets rejected again here, particularly while the Z-Score is elevated, the probability of a downside move increases significantly.
Bearish Bias: What the Data Suggests
The core logic behind this setup is based on reversion to the mean. When price extends beyond typical volatility bands (as measured by the Z-Score) and momentum stalls (as reflected by the HMA), it often precedes a return to more normalized levels.
Right now, we have:
A Z-Score reading in overbought territory,
A potentially topping HMA,
Resistance still holding at the descending trendline.
That’s a confluence of signals that, in my indicator's design, suggests a bearish reversion is more likely than a continuation.
What I’m Watching This Week
To confirm the setup, I’ll be watching for:
HMA flattening or beginning to roll over,
Break of recent short-term support to trigger downside momentum.
If these conditions start stacking up, the short bias becomes actionable. If instead we see a breakout above the trendline with conviction and volume, I’ll re-evaluate because no indicator is bigger than price.
The HMA Z-Score Probability Indicator is designed to anticipate high-probability turning points, and right now, it's signaling elevated risk for a short-term reversal in SPY.
As always, these are probabilities, not certainties.

I Am Selling Some Shares Into The Dead Cat BounceSelling into the rally guys not all keeping some we can higher
Not sure how far until u get that weekly turning up thru
30% selling into rally. Have a hedge on.

SPY Resistance coming upVolume and trend analysis showing key levels to watch. But in this market single chart analysis is not enough. I look at Dollar Index, Gold, 10Y Treasury Bonds. All indicate low confidence in USA economy. Unless these improve I will remain bearish even if SPX,SPY breaks to the upside.
But most likely the markets will reverse at max resistance, as the hedge funds who are under liquidity pressure will start selling again

Credit Stress Panic? No, at least not yet!Credit Stress Panic? No, at least not yet!
A friend shared a viral X post claiming we just saw the biggest exodus in the leveraged loan space — and they’re right on the numbers:
• $6.5 billion pulled from US leveraged-loan funds in just a week
• $1.4 billion from AMEX:BKLN alone — the largest outflow in its 13-year history
• $9.6 billion also left high-yield bond funds — the most in nearly two decades
But here’s the thing... dollar flows can be misleading without context.
What is AMEX:BKLN ?
AMEX:BKLN is the Invesco Senior Loan ETF. It tracks floating-rate loans made to riskier corporations — offering higher yields tied to interest rates. These are popular in rising-rate environments… until credit stress kicks in.
So what’s the chart saying?
Despite the outflows, price just bounced off a key historical support level: $20.31 .
This zone has been tested before:
• 2018: Fed tightening – sharp but contained
• 2020: Covid crash – full panic
• 2022: Banking mini-crisis – 💥 and Bitcoin pumped from here 💰🟧…
Now in 2025, we’re seeing the biggest dollar outflow… but not the worst price action.
Perspective check:
The fund is much larger now. $1.4B today ≠ $1.4B in 2018. This move isn’t the apocalypse — not yet.
Final Takeaway:
If $20.31 holds, this may be just another macro shakeout.
Break that, and we enter “panic mode” — but we’re not there yet. (Thank God that Tradingview alerts exist. It's ON)
Watchlist:
• AMEX:BKLN – key support zone
• AMEX:HYG / AMEX:JNK – junk bonds under pressure
• NASDAQ:TLT – treasuries getting love
• CRYPTOCAP:BTC – does it act as safe haven again?
One Love,
The FXPROFESSOR 💙

Junk Bonds: Risk Appetite Bounces on Support!Junk Bonds: Risk Appetite on Support!
Credit markets have been buzzing — headlines warn of record outflows and panic rotation. But AMEX:HYG , the high-yield bond ETF, just told a different story.
What is AMEX:HYG ?
It tracks “junk bonds” — loans to companies with weaker credit. They offer high yields, but carry high risk. When investors are confident, they chase these. When fear hits, they dump them — fast.
The Chart Setup:
We've just seen a clean rebound off 75.72 — a long-standing “fear line” going back to:
• 2008 GFC lows
• Covid crash in 2020
• And now, 2025 macro tension
Zooming into the 1H chart (see inset), the rebound off 75.72 was sharp and orderly — not panic-driven.
Why it matters:
📉 Last week: $9.6B exited junk bond funds (20-year record)
💣 AMEX:BKLN saw its biggest outflow ever
But technically? This support is still holding .
The message:
The market might be pricing fear — but not full-blown stress .
Break below 75.72? That changes everything.
Watchlist:
• AMEX:BKLN – leveraged loans
• AMEX:LQD – safer credit rotation?
• NASDAQ:TLT – treasury flow = fear gauge
• CRYPTOCAP:BTC 🟧 – Bitcoin as macro hedge again?
For now, risk appetite is hanging on by a technical thread. Let’s see if it holds.
One Love,
The FXPROFESSOR 💙
ps. things can change fast so we will monitor..alerts are ON

[b]No Panic Here – Quality Credit Says Relax[/b]No Panic Here – Quality Credit Says Relax
After watching leveraged loans ( AMEX:BKLN ) and junk bonds ( AMEX:HYG ) take heavy hits, we shift to the quiet giant in the credit space: AMEX:LQD .
What is AMEX:LQD ?
It’s the ETF for investment-grade corporate bonds — meaning bonds issued by highly rated, stable companies.
We’re talking about names like Apple, Johnson & Johnson, Microsoft, JPMorgan, ExxonMobil — the blue-chip elite.
These aren’t the bonds you dump in a panic — they’re the ones you rotate into when credit stress builds.
What’s happening now?
📌 Price just bounced off 103.81 , a key support zone that also held:
• During the 2020 Covid crash
• In the 2022 banking mini-crisis
• Now in 2025 – mid macro uncertainty
From 2003 to 2021, this chart trended upward with pressure on resistance. Since 2022, the pressure flipped — testing support. But structure is still being respected perfectly .
🟢 The ascending channel remains intact
🧱 Support at 103.81 is holding
🔄 No breakdown, no fear — just rotation
Zoomed-in 30m chart shows a clean technical bounce .
If we revisit 100.33, that could be a final test of the base — but unless that breaks, this still looks bullish on a macro timeline.
What it means:
This is not a market panic .
It’s a rotation into quality.
• Junk bonds = sold but found support
• Leveraged loans = stress but not panic, on support
• Investment grade = stable
• ** CRYPTOCAP:BTC 🟧 = crypto wildcard in this macro unwind**
Bottom Line:
LQD is holding up, following the rules, and quietly saying:
"Relax, we've been here before."
One Love,
The FXPROFESSOR 💙

How Will Uncle Sam Strike Back? – U.S. Treasuries on the Edge📉 How Will Uncle Sam Strike Back? – U.S. Treasuries on the Edge
After covering leveraged loans ( BKLN ), junk bonds ( HYG ), and investment-grade corporates ( LQD ), we now focus on the most important piece of the U.S. credit puzzle: Treasuries.
Specifically, the long end of the curve — tracked by TLT .
📊 What the Chart Shows
Left Panel (3D Chart)
• All-time highs in Feb 2020 at $179.80
• Long-term trendline going back to 2004
• Critical support was broken in 2022 — a structural breakdown
Right Panel (8H Chart)
• Clear descending channel since 2020
• Price has rejected from the channel top multiple times
• Recent bounces off the lower channel suggest a potential final flush
🧠 What Happened in 2022? (can't blame Trump for that...)
This wasn’t politics — it was policy.
• The Fed's fastest hiking cycle in decades
• Liquidity evaporated
• Long-duration bonds were abandoned
• The key trendline that had held for years was finally lost
That line — once support — is now resistance.
📐 My Technical Expectation
I expect one final slide before a reversal.
• Channel base sits at ~$76.32
• My projection targets $71.30 or even $68
• That would mark new all-time lows for TLT
🟡 After that? I expect a macro reversal , targeting:
• 🔼 $101 – mid-channel reversion
• 🔼 $112–115 – former support zone (2019–2022), now resistance
🔍 Macro Context
This chart isn’t just about price.
It reflects how markets are pricing confidence in U.S. debt .
And right now?
That confidence is shaky . With Trump turning 'orange' and taking it out against almost everyone else: China but also his allies(EU, Canada, Japan, etc )
🔄 Recap of the Series So Far:
• BKLN – record leveraged loan outflows
• HYG – junk bonds bounced at historical support
• LQD – investment grade bonds holding steady
• TLT – U.S. Treasuries under pressure, and possibly breaking down
📌 Next up?
🟧 CRYPTOCAP:BTC
Because when the world begins to question Treasuries , the search for alternative stores of value begins.
One Love,
The FXPROFESSOR 💙
ps. wait for the next posts...they might be epic!

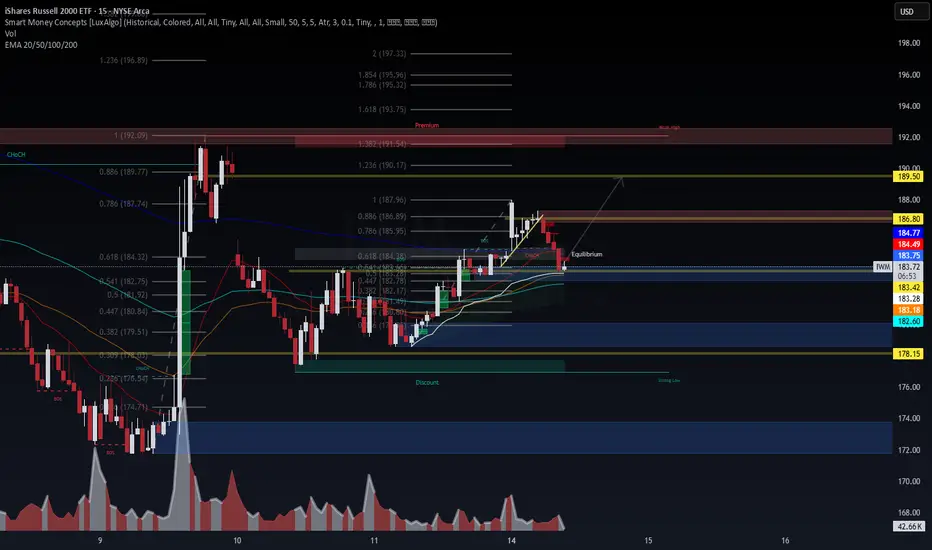
IWM: Potential Trade Setup📊 IWM – Smart Money Playbook in Action
🔹 15-min chart | April 14, 2025
This IWM chart shows a clear sequence of liquidity grabs and structural shifts aligned with Smart Money Concepts (SMC). Here's a breakdown of the key moves and what I'm watching next:
🔍 Key Observations:
Break of Structure (BOS) and Change of Character (ChoCH) confirm bullish intent early on.
Price retraced to a discount zone (below 0.5 Fib) and formed a strong base near $176.54–$178.15.
The rally respected the 0.618 Fib retracement ($184.32), aligning with the equilibrium zone, where price is currently consolidating.
📈 Bullish Bias:
We’ve seen a clean mitigation of the OB before the digging candle pushed into premium pricing.
Price is now in the mid-range (EQ) between discount and premium. If bulls hold above $182.75, we could see a continuation toward the next liquidity levels.
Next targets:
🔸 $186.80 (minor supply zone)
🔸 $189.50 (weekly inefficiency + liquidity)
🔸 Extended projection: $192–$193.75 (Premium + 1.618 extension)
📉 Downside Risk:
A breakdown below $182.60 would invalidate this structure and shift focus to the deeper OB zone around $178.15.
📌 Trade Setup Idea:
Entry: Above $183.00 retest with confirmation (PA or OB mitigation)
Stop: Below $182.00
Target 1: $186.80
Target 2: $189.50
Target 3: $192.09 (old high)
⚠️ Watch volume reaction around EQ and VWAP crossovers.
💡 SMC, Fibonacci, and EMA confluence at play – let price show its hand before committing.
📈 Volume confirms intent – we just follow structure and flow.
#IWM #SmartMoneyConcepts #VolumeAnalysis #LiquiditySweep #OptionsFlow #FibRetracement #TradingView #TechnicalAnalysis #Wavervanir