XAU / USD 30 Min. ChartHello traders. It was a great analysis, but I missed the scalp move up. $3400 is the area to watch for rejection or a continued push up. Let's see how things play out. Happy Friday. Big G gets a shout out. Be well and trade the trend.
Futures market


Is oil price heading back up? Watching a potential inverse head and shoulders forming on the 30-minute chart for Oil.
🔹 Risk/Reward: 2.7
🔹 Entry: 63.290
🔹 Stop Loss: 63.043
🔹 Take Profit 1 (50%): 63.93
🔹 Take Profit 2 (50%): 64.21
A couple of key factors still need to align before I pull the trigger:
• One will confirm around 14:45 SAST (GMT+2)
• Looking for lower volume on the right shoulder compared to the left
What do you think? Is oil ready to push higher?
Drop your thoughts or how you trade inverse head and shoulders below! 👇

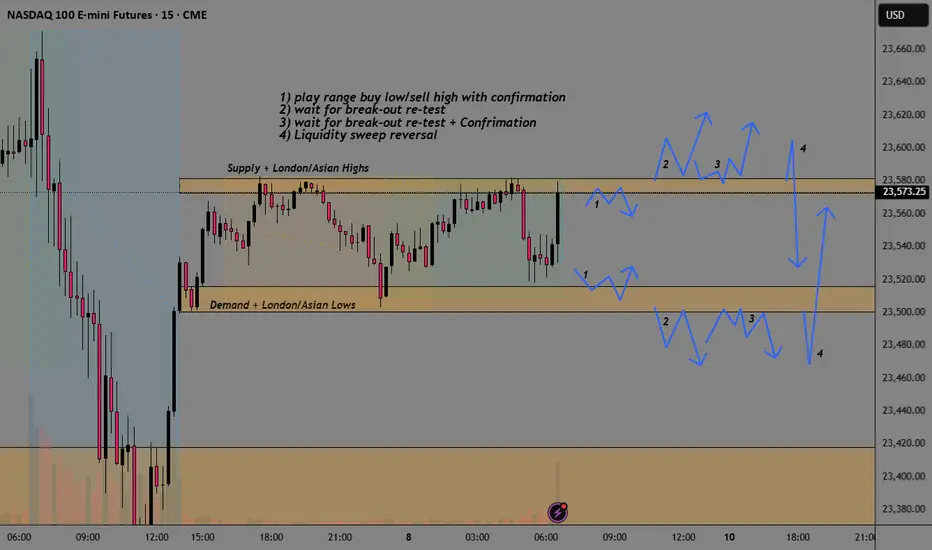
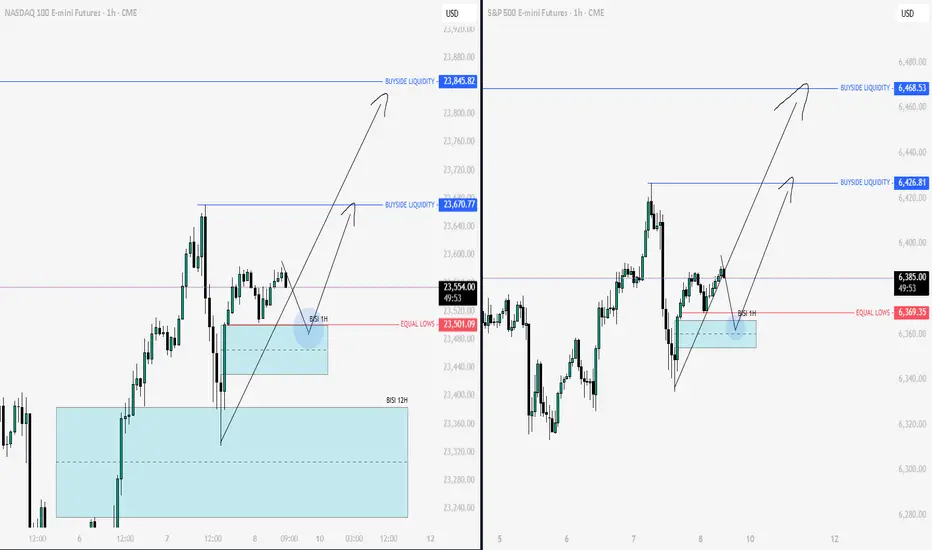
NQ Break-Out AnalysisSee chart from analysis of different options depending on the type of trader and what others are looking at.
1) play range buy low/sell high with confirmation
2) wait for break-out re-test
3) wait for break-out re-test + Confirmation
4) Liquidity sweep reversal
GOLD Technical Analysis! BUY!
My dear subscribers,
My technical analysis for GOLD is below:
The price is coiling around a solid key level - 3392.3
Bias - Bullish
Technical Indicators: Pivot Points Low anticipates a potential price reversal.
Super trend shows a clear buy, giving a perfect indicators' convergence.
Goal - 3397.7
Stop Loss - 3389.29
About Used Indicators:
By the very nature of the supertrend indicator, it offers firm support and resistance levels for traders to enter and exit trades. Additionally, it also provides signals for setting stop losses
Disclosure: I am part of Trade Nation's Influencer program and receive a monthly fee for using their TradingView charts in my analysis.
———————————
WISH YOU ALL LUCK

OTEUM EXPERT CALL: SP500 – Jackson Hole Fade OTEUM EXPERT CALL: SP500 – Jackson Hole Fade 🏔️🐻
We’re looking for a SHORT(s) in spot and options for a macro swing down into Jackson Hole and the immediate aftermath 📉. Plan is to sell rallies into value (red box), ride the drift lower, and bank along staged targets. After that, we’ll be hunting the first-cut squeeze back up 🏦✂️🚀.
Risk: a surprise dovish leak / policy jawbone that front-runs the cut and squeezes shorts. Size smart, trail tight, don’t overstay.
#SP500 #ES #Macro #JacksonHole #ShortSetup #OTEUM

Silver important support at 3753The Silver remains in a bullish trend, with recent price action showing signs of a continuation breakout within the broader uptrend.
Support Zone: 3753 – a key level from previous consolidation. Price is currently testing or approaching this level.
A bullish rebound from 3753 would confirm ongoing upside momentum, with potential targets at:
3875 – initial resistance
3913 – psychological and structural level
3954 – extended resistance on the longer-term chart
Bearish Scenario:
A confirmed break and daily close below 3753 would weaken the bullish outlook and suggest deeper downside risk toward:
3720 – minor support
3676 – stronger support and potential demand zone
Outlook:
Bullish bias remains intact while the silver holds above 3753. A sustained break below this level could shift momentum to the downside in the short term.
This communication is for informational purposes only and should not be viewed as any form of recommendation as to a particular course of action or as investment advice. It is not intended as an offer or solicitation for the purchase or sale of any financial instrument or as an official confirmation of any transaction. Opinions, estimates and assumptions expressed herein are made as of the date of this communication and are subject to change without notice. This communication has been prepared based upon information, including market prices, data and other information, believed to be reliable; however, Trade Nation does not warrant its completeness or accuracy. All market prices and market data contained in or attached to this communication are indicative and subject to change without notice.

Going Long On Gold (XAUUSD)Gold Long Bias – SDM Strategy
I'm looking to go long on gold (XAU/USD) today based on the Session Directional Momentum (SDM) strategy.
Before the New York session opened, the last 1 hour candle swept the New York session low, indicating a potential liquidity grab. This aligns with the SDM principle of price taking out a significant low to generate directional momentum.
We also had london sessions low sweep before 12 PM, adding more confluence for a bullish move.
With these sweeps complete and liquidity collected, I’m expecting bullish momentum to follow.

Silver Bulls Unstoppable – Price Discovery Next?Silver has been on a strong uptrend, consistently making higher lows (HL) and higher highs (HH) over the past few years.
The long-term trendline, which acted as strong support for multiple retests, was finally broken to the upside. The old resistance zone has now turned into a solid support area, showing clear bullish strength.
Currently, price is hovering just below its all-time high (ATH) around $39.59. If bulls manage to break and sustain above this level, we could see fresh highs and a strong continuation of the upward momentum.
DYOR, NFA

Gold Back To The Upside 3450Waiting for the US open at 15:30 for the explosion back to the upside to clear last two weeks high. Lets see what happens at this point. Happy Friday Everyone!
Current Entry: 3381
Target: 3450

Gold next move (Read Description). Hello, Traders.
As you see gold has changed its direction after the NFP News. It was in down trend after the NFP News its flying to the my moon.
Gold is just flying and making breakouts of resistance areas. In my view gold wants to fly and it wants to hit buy side liquidity and then we can see the waterfall.
Gold can continue the trend and if price pullbacks it can touch the area 3365 - 3353 and then can fly.
Don’t trade against the trend, analyse the market before opening the trades.

Gold in Tight Range – Breakout Above 3402 or Below 3383?GOLD – Market Overview
Gold is currently consolidating within the 3402 – 3384 range, awaiting a breakout for the next directional move.
Technical Outlook
Bullish Scenario:
A 1H close above 3402 would likely extend the bullish trend toward 3418 and 3436, with further potential toward 3447.
Bearish Scenario:
A 1H close below 3383 could trigger a move down to 3365, and possibly 3348.
🔹 Pivot Line: 3408
🔹 Resistance: 3418 – 3436 – 3447
🔹 Support: 3383 – 3365 – 3348

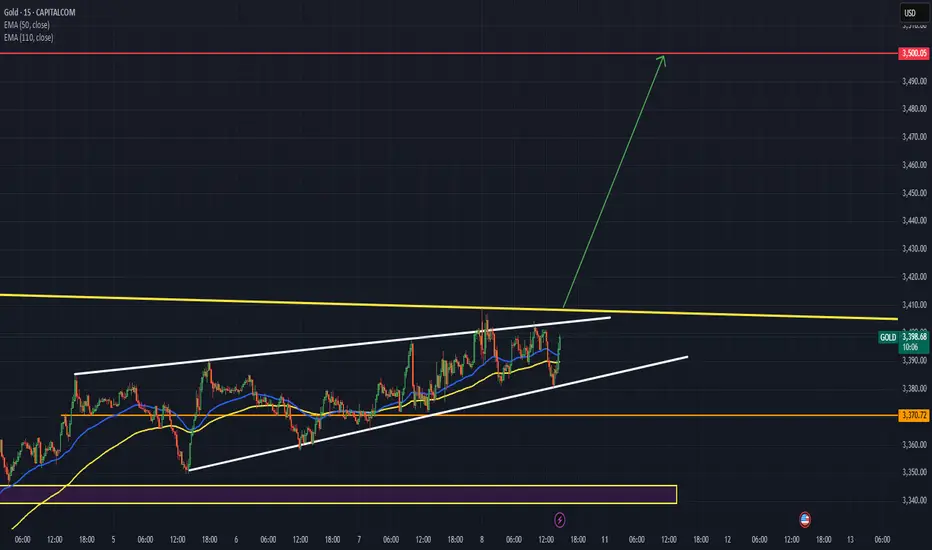
I see a Bullish momentum to reach the old time high!Gold confirming bullish momentum. The breakout signals strong buying pressure, with price action targeting the previous all-time high. Sustained volume and favorable macroeconomic conditions are supporting the upward move, indicating potential for further gains if momentum holds.
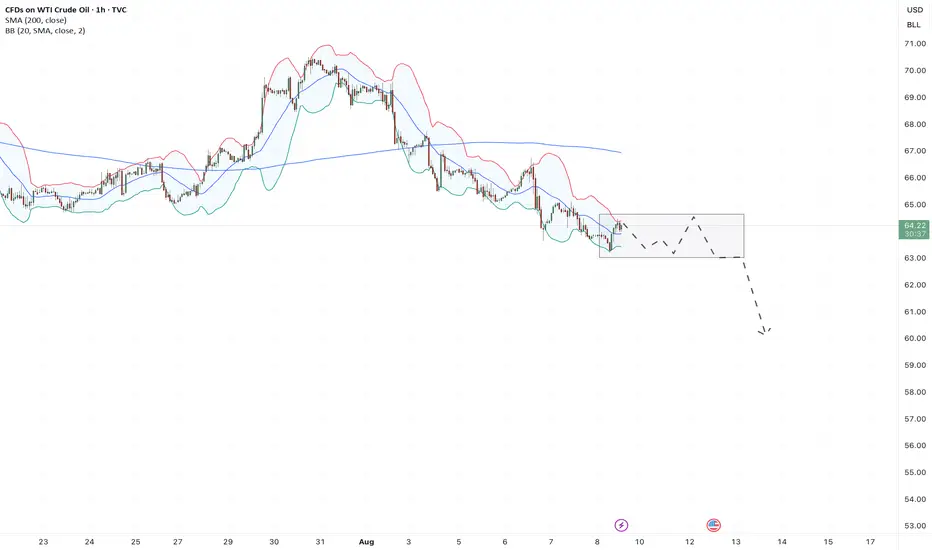
Crude oil under pressure as geopolitical talks developCrude oil confirms the bearish trend, having pressured from intermediate-term peak. The fair price, according to the STEO forecast, stays at around $60 and that level might be perceived as a target area for the current price swing.
Geopolitical agenda adds more pressure on oil, as Steve Witkoff, the special negotiator from Donald Trump’s team, has visited Moscow and had a positive effect from talks with Vladimir Putin. Next week, markets will look forward to potential three-sided talks between Ukraine, Russia and the US. This situation adds more pressure to the already bearish Crude oil market.
One may think of cautious short positions in the direction of a price swing, closing it before “the news”.
Don't forget - this is just the idea, always do your own research and never forget to manage your risk!
Gold moves in a stair-stepping mode amid US dollar weaknessGold keeps moving in the context of the rising trend in a “stair-stepping” mode, finding responsive buying activity above the 20-day moving average. All intraday sell-offs seem to be absorbed by immediate buying, which indicates a steady demand for the Gold market, especially amid the weak NFP print for July and overall pressure for the US dollar.
COT-reports show the slight decrease of net position of commercial traders, but it’s still far from the bottom, which doesn’t translate it to a bearish signal of any kind. By the way, this year Gold had successfully ignored all “bearish” signals from COT reports, which essentially means that speculative and investment demand outperforms commercial supply.
Don't forget - this is just the idea, always do your own research and never forget to manage your risk!

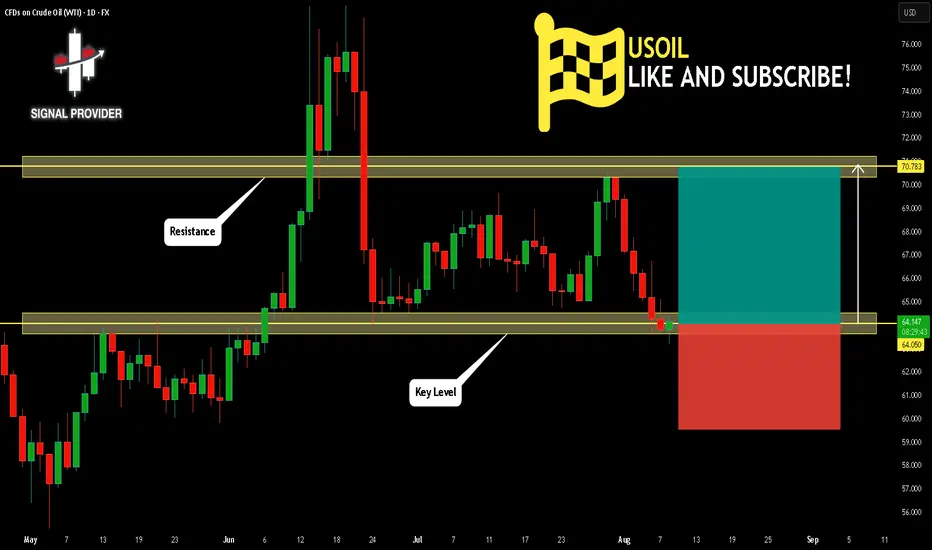
USOIL Is Going Up! Buy!
Take a look at our analysis for USOIL.
Time Frame: 1D
Current Trend: Bullish
Sentiment: Oversold (based on 7-period RSI)
Forecast: Bullish
The market is approaching a key horizontal level 64.050.
Considering the today's price action, probabilities will be high to see a movement to 70.783.
P.S
Please, note that an oversold/overbought condition can last for a long time, and therefore being oversold/overbought doesn't mean a price rally will come soon, or at all.
Disclosure: I am part of Trade Nation's Influencer program and receive a monthly fee for using their TradingView charts in my analysis.
Like and subscribe and comment my ideas if you enjoy them!
XAUUSD GOLD Buy Trade
Buy trade condiational buying on Restest and confirmation of bullish candle
Chart shows SL TP Entry point
Partial booking is suggested risk free trade as soon possible ap per risk reward

Nq & Es Key Levels & Daily Bias 08-08-2025Today’s bias is once again bullish, aiming for those all-time highs.
When the market opens at 09:30, I’d like to see price dip into discount zones or take out some lows first — that would set up a nice rally upward and a potential long opportunity.
If that doesn’t happen, I’ll stay on the sidelines. No chasing longs in premium territory.
Enjoy the day no matter what happens, and keep learning so you’re sharper tomorrow.
We’ll check back later to see how it played out.
GOLD Struggles Near 3400 ResistanceGOLD Struggles Near 3400 Resistance
Gold is facing strong resistance around 3400, and the price is hesitating to take clear direction.
Although it looks like gold wants to move higher, selling pressure is holding it back. The price action is forming a wedge pattern, which typically signals a potential drop.
If this pattern plays out, gold could fall.
In my view, this bearish setup will only be invalidated by major market manipulation, because from a broader perspective, there’s no fresh technical or fundamental reason for gold to push higher despite that the bigger trend is bullish.
The real risk isn’t just technical or macro—it’s that gold remains one of the most manipulated assets in the market.
If the price breaks below the resistance zone shown on the chart, the chances of a deeper drop will increase.
Targets: 3350, 3330, and 3294
I'm still more focused on a bearish movement.
You may find more details in the chart!
Thank you and Good Luck!
PS: Please support with a like or comment if you find this analysis useful for your trading day

Gold explosion will be short livedThe price explosion in gold is solely due to the tariffs.
I don’t even want to go into detail about what impact this will have on the USA. I’ll just say this much: I feel sorry for the American people, and it’s not their fault.
And here, once again, we see the universal law of physics inherent in Median Lines/Forks at work. Right at the center line, the price will pull back and may drift toward the lower median line parallel, should the close occur below the center line.
It seems as though the basic rules of arithmetic are a foreign concept to those in leadership. There is a belief that billions of dollars will now suddenly flow into the U.S. Treasury overnight — which is, of course, complete nonsense. If that were truly the case, the price of gold in London would have risen in step with the U.S. gold price.
Instead, this madness will unfold as yet another act of monumental miscalculation, spreading across the U.S. economy and cementing the debt ledger as if it were the stone tablet of the Ten Commandments.
Let us see what our Median Line/Fork framework will reveal over the coming days.
…and I keep the world in my prayers, that peace may find its way into our thoughts.

ES - August 8th - Daily Trading PlanThe session open of 6370 held this level overnight and we had a shallow failed breakdown around 1:45am at 6368 and rallied back up to the overnight highs. We are trading in a tight 20 pt range overnight and currently we are testing the 6391 level.
6391 is the 0.618 retracement of the 6426 high to 6333 low from yesterday session. We could stall and move back down the levels once reached or continue higher. IF, we continue higher, we should be able to continue up to test 6400, 6410, 6426. If we reject the 6391 level, we will need to come back down and need to hold the 6370 session open level or we will possibly continue to look for support at 6344, 6333, 6324. 6315. Below these levels and we will be looking to the 6297, 6280, 6252, 6240.
Personally, 6315 is probably the better next level down for a decent move. We could easily have a session like yesterday where no follow through happened until the 6333 level. Since it was tested yesterday, you would want to see a flush to 6324 or 6315 and reclaim of the levels above the bounce to long for a level-to-level move.
My plan is looking for a rejection of the 6391-95 range and see us pullback and retest the overnight low. This has been tested already and may not produce much support. You will need to see how price is acting as it nears.
You can see my post last night in the related publications section as to the levels I outlined and how that played out. "Price needs to hold 6365 with 6355 at lowest or we will most likely go back down and retest the 6344 & 6333 levels which have been a magnet this week." 6368 was the overnight low and we rallied from this level. We might get one more bounce but could fizzle out quickly.
I will post an update around 10am once the NYSE opens and we can see how price acts in the first 30 mins.

Gold Analysis (XAU/USD):Gold is currently trading around $3,386 after testing a key support area.
🔹 Bearish Scenario (1):
If the price breaks below $3,380 and holds, a decline toward the key support at $3,355 is expected.
🔹 Bullish Scenario (2):
If the price rebounds and breaks above $3,400, holding above this level could lead to further upside toward $3,410, with a potential extension to $3,430.
⚠️ Disclaimer:
This analysis is not financial advice. Please monitor price action and apply proper risk management before making any trading decisions.

Gold targets 3430 - Bulls in controlHello IGT FOLLOWERS
Here is my Gold overview, From last couple of days gold is respecting the trend line very well in the upwards, Gold is now working on a trend line's support area around 3382/3376. Indicating strong bullish momentum. A break of 3410 could confirm further upside till 3430..
Key points :
Entry point : 3381
Support Area : 3382/3376
Follow me for more latest updates and signals
