GOLD Breakout Done , Long Setup Valid To Get 150 Pips !Here is My 15 Mins Gold Chart , and here is my opinion , we finally above 3384.00 and we have a 30 Mins Candle closure above it And Perfect Breakout , so we have a good confirmation now to can buy it and we can targeting 100 to 150 pips .
Reasons To Enter :
1- New Support Created .
2- Bullish Price Action .
3- Bigger T.F Giving Good Bullish P.A .
4- Clean Breakout .
Futures market

XAUUSD XAU/USD SHORT BIAS (at $3396) – Expecting a Sharp Decline
Thesis:
Gold is currently overextended at $3396, showing signs of exhaustion after a strong rally. Technical indicators and macroeconomic conditions suggest an imminent correction.
Reasons for Bearish Outlook:
1. Overbought Conditions – RSI and momentum oscillators are at extreme highs; a retracement is statistically likely.
2. Strong Resistance – Price approaching a historical supply zone; failed breakouts are common at this level.
3. Dollar Strengthening – If DXY gains strength due to Fed policy, gold could see downward pressure.
4. Bond Yields Rising – Higher yields reduce gold’s appeal as a non-yielding asset.
Target Zones:
• Immediate target: $3310–$3290
• Deeper support: $3225–$3190
Risk:
If gold breaks and holds above $3420, the short thesis may be invalidated.

Gold - The diligent top formation!🏆Gold ( TVC:GOLD ) finished the bullrun:
🔎Analysis summary:
For the past 10 years, Gold has been trading in a very strong expected bullrun. Just like we witnessed it in 2011, a 10 year bullrun is followed by a shorter term bearmarket. Gold is starting to lose its strength, which is a clear sign of weakness and the beginning of a bearish reversal.
📝Levels to watch:
$2.800
SwingTraderPhil
SwingTrading.Simplified. | Investing.Simplified. | #LONGTERMVISION

Day 4 — Trading Only S&P Futures — +$207, Patience Pays OffWelcome to Day 4 of Trading Only S&P Futures!
After two tough losing days, I took a morning yoga session to clear my mind and approach the market calmly. I started trading late but found a strong A+ setup near 6355, aligned with a major gamma zone and RSI signals, which led to a $200+ profit.
📈 What you’ll learn
The importance of mindset and mental clarity in trading
How to identify strong setups using market structure and gamma zones
Reading RSI on multiple timeframes for confirmation
Managing risk and knowing when to call it a day
⏰ Timestamps
0:00 — Intro & Day 4 Overview
0:30 — Mindset Reset & Trade Recap
1:30 — VX Algo Signal Recap & Setup Breakdown
3:00 — Market News & Impact
3:30 — Key Levels for Tomorrow
4:00 — Closing Thoughts & Next Steps
🔔 VX Algo Signals (9:30am – 2pm EST)
9:39 AM Market Structure flipped bullish on VX Algo X3!
11:20 AM VXAlgo ES X1 Buy signal (triple buy)
11:52 AM VXAlgo ES X1 Buy signal
12:40 PM VXAlgo ES X1 Sell signal
📰 News Highlights
U.S. jobless claims rose to 226,000 vs. estimate 221,000, signaling increased layoffs.
🔑 Key Levels for Tomorrow
Above 6332 = Remain Bullish
Below 6315 = Bearish

IM EXPECTING GOLD TO COLLAPSEHere on the post, i shared my SAXO:XAUUSD sell analysis, for further details, see the content of the post. All the best.

Gold still looking bearish . Gold still looking bearish and respecting the upper trend line . My analysis is just as simple as previous ones hence easy to comprehend .
This is still a sell in as much price holds below the upper trend line . A break below the lower trend line will lead price to 3340s and a break below this again takes us to last weeks low at 3280s - 3270s . Still bearish biases until upper trendline is broken completely .

Gold is still stuck in range.Gold is still stuck in range before big move. The Yellow metal Is forming this wedge pattern for fourth days. I'm out of trade now. In any case I'm ready to sell it tomorrow with respect on its develope.

ES - August 7th Evening Open & August 8th - Daily Trading PlanAugust 7th - 4:10pm - Opening Session - Trade Plan
We had a nice move higher in last night's overnight session and then we sold off at the 6400 level by 10am this morning. While price has found a nice short-term bottom at a key level of support 6333, we also rallied in the last hour to clear the 6368 level that was also the overnight low before we broke below it during the daily session. (I had this detailed in my notes that you can review from my last post and is in the related publications section).
We have pretty clear support & resistance levels we are going to be watching overnight and into the morning session.
Price needs to hold 6365 with 6355 at lowest or we will most likely go back down and retest the 6344 & 6333 levels which have been a magnet this week. IF, price can hold these levels, we should back test the 6378, 6391 and potentially the 6400 level that we sold off from.
We are still in a bullish uptrend and can continue all the way to retest the 6426 level if bulls want to. We have nothing short term to be bearish about until 6315 is tested and failure of this level could produce a larger sell off targeting 6297, 6286, 6250, 6240. IF, price does lose 6315 I will be looking for a reaction at the 6286 & 6252 levels for some points to go back and retest the 6315 area.
I will provide an update before 7am EST tomorrow based on the overnight session price action. Make sure to follow so you get notified when I post my daily trade plan.

CRUDE OILPreferably suitable for scalping and accurate as long as you watch carefully the price action with the drawn areas.
With your likes and comments, you give me enough energy to provide the best analysis on an ongoing basis.
And if you needed any analysis that was not on the page, you can ask me with a comment or a personal message.
Enjoy Trading ;)

GOLDPreferably suitable for scalping and accurate as long as you watch carefully the price action with the drawn areas.
With your likes and comments, you give me enough energy to provide the best analysis on an ongoing basis.
And if you needed any analysis that was not on the page, you can ask me with a comment or a personal message.
Enjoy Trading ;)

Bullish Outlook Intact: Gold Targeting 3400-3410Gold encountered resistance and retreated several times on its way to 3400, but it remained above 3370 during the pullback, perfectly maintaining the integrity of its volatile upward trend. Therefore, even though gold's upward momentum has weakened, I still believe that due to structural support, gold still has the potential to reach the 3400-3410 area, and may even continue its bullish trend to the 3420-3430 area.
As gold prices rise, market sentiment tends to be more optimistic, and the price behavior reflected by the candlestick chart becomes clearer. The lows of gold continue to rise, and the highs always insist on setting new highs in the process of rising. The oscillating upward structure is particularly obvious. While greatly limiting the retracement space, it also greatly consolidates the support structure below and is conducive to further rises in gold. At present, gold has been confirmed to have stabilized above 3370, so gold may not give another chance to fall back to the 3360-3350 area.
Then in the next short-term trading, the gold pullback is a buying opportunity. We focus on the opportunity to participate in long gold after gold retreats to 3380-3370. The target will first look at the 3400-3410 area, and the higher target area is in the 3420-3430 area.

XAUUSD SignalFrom a technical perspective, the commodity has been struggling to capitalize on the recent strength beyond the $3,380-3,385 region. Moreover, mixed oscillators on the daily chart warrant caution for the XAU/USD bulls. That said, this week's bounce from the 200-period Simple Moving Average (SMA) on the 4-hour chart backs the case for a further appreciating move. Some follow-through buying beyond the $3,400 mark will reaffirm the constructive outlook and lift the Gold price to the $3,420-3,422 intermediate hurdle en route to the $3,434-3,435 supply zone. A strength move beyond the latter would set the stage for a move towards retesting the all-time peak, around the $3,500 psychological mark touched in April.
On the flip side, any corrective pullback might continue to find decent support near the $3,350 area. This is closely followed by the 200-period SMA on the 4-hour chart, which, if broken decisively, might prompt some technical selling and drag the Gold price to the $3,315 intermediate support en route to the $3,300 round figure. Acceptance below the latter would expose the $3,268 region, or a one-month low touched last week.

Today's gold price target: 3400+Today's gold price target: 3400+
Trading strategy remains the same. Continue buying low this week, with a target price of 3400+.
Buy range: 3350-3360-3370
Stop-loss range: 3340-3350
Target range: 3380-3400+
Technical Analysis:
As shown in Figure 2h:
When will gold enter the triangle range of 3385-3440?
I've been waiting all week.
For the past week, gold prices have been fluctuating and converging between 3360 and 3385.
Our strategy this week is to buy low.
Currently, we remain undefeated and have made significant profits.
I still believe today could be a major moment for gold prices to break out, stabilizing at 3380 and breaking through 3400, with a target of 3440+.
I still believe the macroeconomic trend is irreversible:
Expectations of a Fed rate cut and geopolitical risks will continue to support gold prices in the short term. Long-term long positions are recommended above $3,350.
Precious metals are inherently volatile. The recommended gold trading strategy is to buy on dips over the long term.
Of course, gold prices could continue to fluctuate between $3,360 and $3,385.
If you do prefer to short, my short-term recommendation is to short near the highs of $3,385-3,390, with a stop-loss at $3,395.
If it falls below $3,365, the target support level is $3,350.
Currently, gold prices should focus on breaking through the resistance level of $3,380-3,381 in the short term.
If the price holds this level, it could potentially reach $3,450.
If the price pulls back, the support levels of $3,345 and $3,274 should be watched.

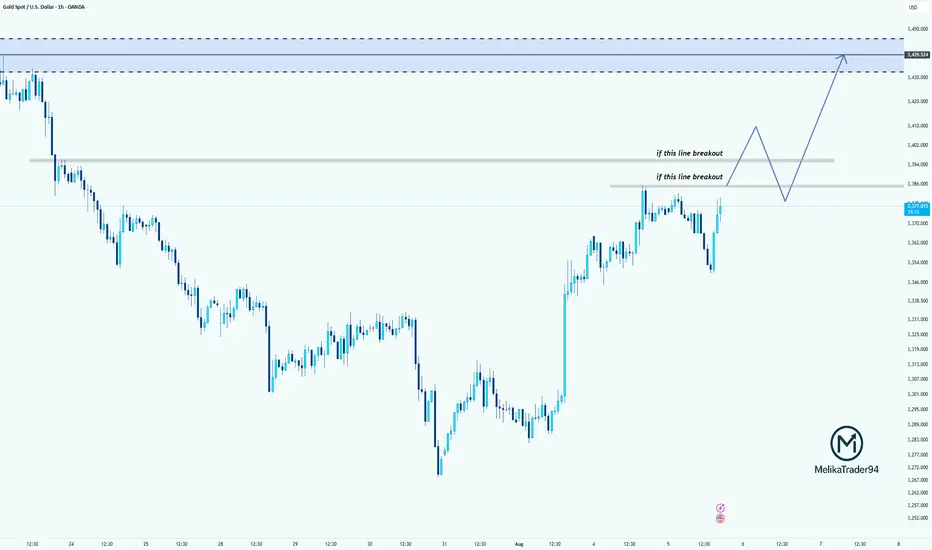
Breakout Levels in Focus for XAUUSDWhy did I say to cancel the last position? because gold is in the critical area!
Price is testing a key resistance area around 3374.
If it breaks above the first resistance level, we may see a bullish continuation toward the second breakout line.
If both levels are broken and retested successfully, the path toward the supply zone at 3430–3440 opens up.
Patience and confirmation are key here!
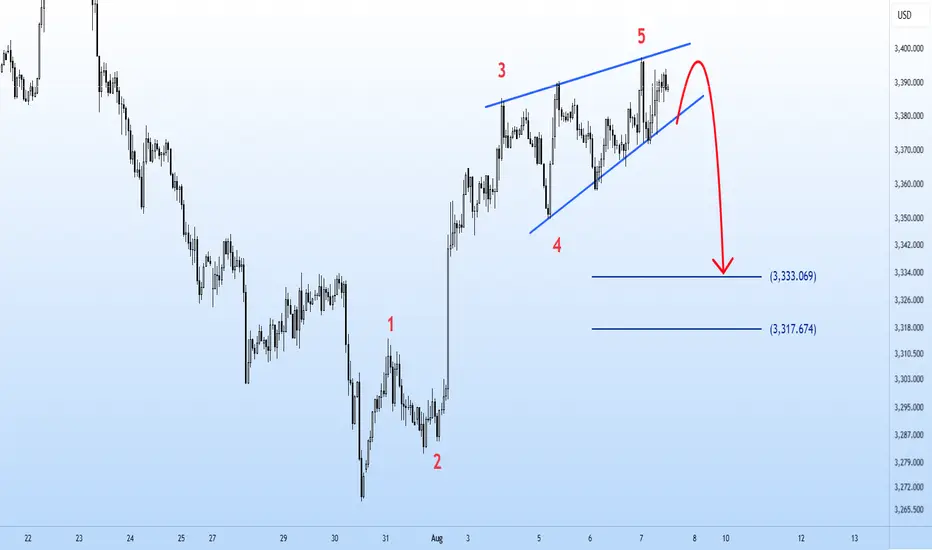
A great opportunity to sell gold!Gold Analysis Short and Medium Timeframe Elliott Wave Analysis Style The gold market has completed five upward waves and is currently at the end of the upward wave. Given the formation of the corner market pattern, it could enter a reversal and decline towards $3,333.
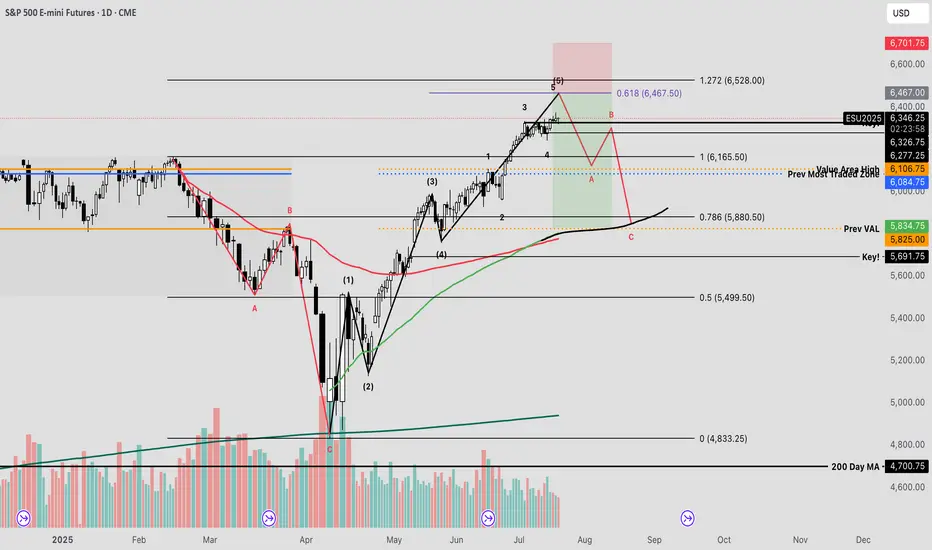
SPY The Final Countdown Since the April lows, equity markets have exhibited strong performance, with many stocks appreciating by nearly 100%—some even exceeding that threshold. Given the velocity of this rally, a corrective pullback may be imminent before the broader uptrend resumes.
The current reading on the Fear & Greed Index places market sentiment firmly within the "extreme greed" territory—historically a zone where investors often begin to lock in profits or initiate contrarian positions against the prevailing trend.
From a technical standpoint, I’ve conducted an Elliott Wave impulse analysis to evaluate the recent price structure. This method, which utilizes Fibonacci-based mathematical relationships, provides insight into the expansion and contraction phases of market cycles.
Using the trend-based Fibonacci extension tool, one can estimate potential termination zones for impulse waves. In the current scenario, the fifth wave appears to be approaching completion. By analyzing the proportional relationships between waves 1, 3, and 4, a key confluence level emerges at the 61.8% extension—commonly referred to as the “golden pocket”—just above the 6400 level on the futures chart.
I plan to set alerts at this price level to secure profits, hedge existing positions, and potentially initiate a short trade—should market structure confirm a reversal through a valid breakdown trigger.
False breakdown coming on CopperI think we take out the lows and then we see a nice bounce. I think everyone is expecting us to go lower but there's so much liquidity there which you'll see from my video I just don't see it.
Hope you guys can get in!

XAUUSD LONG PositionGold has been ranging for a while now, looking at Mr. America tariff race. We look gold to push Further up with no Compromising area of reversal.

Mastering One Good Trade for New York Session📍 Trade Overview
Asset: Nasdaq 100 E-Mini Futures
Direction: Short
Entry Price : 23607.0
Exit Price : 23512.85
Date of Trade : 08/07/2025
R:R Target : 5.26
Result: Win
Timeframe: 15min
🧠 Trade Thesis
Behavior of price was the key to this trade around the specific time of New York open along with sweeping the London high combined with an ADR pivot level and a rise in Asian and London for the reversal in New York.
📊 Technical Breakdown
Structure: (M formation, False Breakout, double top)
Key Levels: (HOD supply/demand, pushed above London high, directly at ADR Pivot Level)
Indicators (if any): (e.g., TDI, EMA confluence, RSI divergence)
Volume Behavior: (3 pushes into the high for NY open, stop hunt, bearish engulfing on the 15 and 5 minute)
⏱️ Timing
Session: NYC
Minute of Entry: Early in the session / 10:10amEST
Context in Session: Breakout window, equities hour
🧩 Execution Details
Entry Trigger: (Candle close confirmation with a bearish engulfing)
Stop Loss Location: (Above wick of 5 minute entry candle)
Target: (ADR / measured move)
🔍 Post-Trade Analysis
What went right?
Price instantly rejected the level it was at and reached target fairly quickly.
What could have been better?
Could have taken YM for a better setup instead.
Would I take this trade again? Yes. A+ setup but not A+++ due to it not being at a major level like the other indices were.

After the morning forecast 07-08-2025As we saw, it finally happened, the price dropped, giving us shorting opportunities and now we probably have to look for Longs... tomorrow we'll meet here at 09:00 Am NY Time.

8/8/25 Bulls Need Follow-through Buying
Thursday’s candlestick (Aug 6) was a bear bar closing in its lower half with prominent tails above and below.
In our last report, we stated that traders would determine whether the current pullback would remain sideways and overlap with Wednesday's range or if the bears would be able to create strong bear bars, closing below the 20-day EMA. The 20-day EMA could be a magnet.
The market formed a pullback testing the middle of the trading range and the 20-EMA. The candlestick was mostly overlapping with Wednesday's range.
The bulls want any pullback to lack follow-through selling, similar to the last few pullbacks (July 7, July 11, July 15, and July 22). August 4 was the same.
They want a retest of the July 24 high, followed by a strong breakout above to form the wedge pattern, with the first two legs being June 20 and July 24.
They see the last two days simply as a pullback testing the 20-day EMA. They want any pullback to be weak and sideways. So far, this is the case.
They need to create follow-through buying over the next few days to increase the odds of higher prices.
The bears were unable to create follow-through selling in the last four selloff attempts (July 7, July 11, July 15, and July 22). August 4 was the case again.
They want the market to form a lower high (vs Jul 24) and a double top bear flag (Jul 30 and Aug 5).
They need to create strong bear bars closing near their lows and trading below the 20-day EMA to show they are back in control.
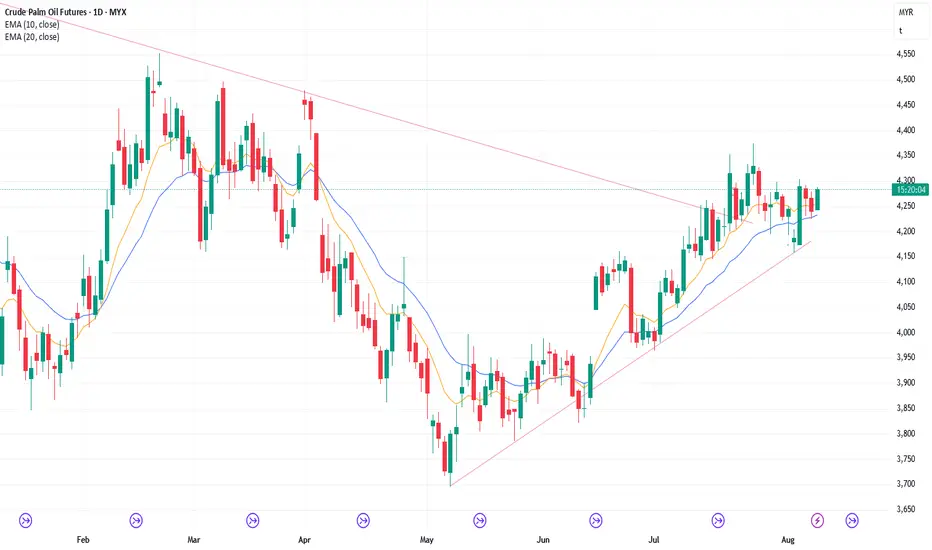
Production for August may be flat or down.
Refineries' appetite to buy looks decent recently.
Export: August demand remains to be seen.
The market formed a minor pullback testing the bull trend line (Aug 4), and formed a higher low. Traders are wondering if the pullback has alleviated the prior overbought condition.
Moving forward, traders are wondering if the market will form a retest of the July 24 high followed by a breakout above. Or will the market form a lower high (Aug 5) and a double top bear flag (Jul 30 and Aug 5), followed by another leg down instead?
The market has formed a trading range over the last 24 trading days. The 20-day EMA is trading around the middle of the trading range and could be a magnet.
The last two days (Aug 5 and Aug 7) formed another smaller pullback, which stalled at the 20-day EMA.
The market is trading higher during Thursday night's market session.
The bulls want Friday's candlestick to close near its high, which will create a bullish weekly candlestick. If so, the odds will slightly favor next week trading at least a little higher.
The bears want the Friday candlestick to close bearish, so that the weekly candlestick will have a long tail above and close below the middle of its range.
For tomorrow (Friday, Aug 8), traders will see if the bulls can create a strong bull bar breaking above the August 5 high.
Or will the market trade higher, but stall around or below the August 5 high and close with a long tail or a bear body instead?
Andrew
XAUUSD Bearish SMC Analysis – Institutional RejectionXAUUSD Bearish SMC Analysis – Institutional Rejection from Supply Zone
Gold (XAUUSD) is showing a clear bearish structure after rejecting a major supply zone at premium pricing. This setup is aligned with Smart Money Concepts (SMC) and reflects how institutions manipulate liquidity and order flow before major price moves.
🔍 Market Structure Context:
The market had been trending upward with higher highs and higher lows, until it approached a key premium supply zone near $3,420.
At this level, price stalled, creating internal Equal Highs (liquidity) — a common trap used by institutions to grab orders before reversing.
🔄 Change of Character (CHoCH):
A clear CHoCH was printed when price broke below the most recent higher low, signaling a shift from bullish to bearish structure.
This change marked the first early signal that institutional order flow has flipped bearish, and distribution is underway.
📉 Break of Structure (BOS):
Following the CHoCH, the market confirmed intent with a clean BOS to the downside.
This structural break confirms bearish control and validates short bias.
🧲 Liquidity Engineering:
Equal Highs were swept at the top, indicating a liquidity grab before institutions drove price downward.
This move traps breakout buyers and provides large players with sell-side execution at premium pricing.
🧱 Fair Value Gap (FVG) & Supply Zone Mitigation:
After BOS, price retraced into a Bearish Fair Value Gap (FVG) and the origin of the supply zone, offering a high-probability entry.
The rejection from this zone showed imbalance was respected and no bullish continuation existed — further validating the short setup.
🔍 Confluences for the Bearish Bias:
Confluence Confirmation
CHoCH Structure flipped bearish
BOS Bearish continuation confirmed
Liquidity Sweep Equal highs taken
FVG Retest Smart Money re-entry signal
Supply Zone Mitigation Institutional reaction confirmed
📘 Educational Summary:
This setup exemplifies a complete Smart Money bearish reversal model:
Premium pricing ✅
Liquidity taken ✅
Structure flipped (CHoCH + BOS) ✅
Supply & FVG respected ✅
It reflects how institutions build positions quietly, using engineered liquidity to trap retail traders, and then drive price with high-volume imbalance moves.

