Gold possible correction on 4H timeframeI am expecting a correction of wave iv green from this level to the possibly Fibonacci 23.6% at 4,403, before it can move higher with wave v green.
Futures market

Gold Trade Set Up Dec 24 2025Price came down and has respected demand and swept London lows so now if price can close above CISD i will take buys up to London highs and higher BSL/ATH

WTI Crude Oil: Breakout & Retest Confirmation at Macro SupportMarket Setup: WTI Crude Oil ( NYSE:CL ) has shifted from a multi-year bearish regime into a high-probability bullish reversal. After breaking the primary 2022–2025 descending trendline, price action is now providing a textbook confirmation entry.
Follow for more content and valuable insights.


Going Longer Than Ever On Gold(XAUUSD)Gold has been very bullish for the past two days, showing strong momentum to the upside. Based on the Accumulation–Manipulation–Distribution (AMD) model, I’m currently going long on gold, expecting price to continue pushing higher.
Price has already taken out a key northern high, and there’s a strong possibility it extends a bit further upward before any significant move to the downside. That final push higher could be the last expansion phase before a major fall sets in.
For now, I’m riding the bullish move and watching closely to see how price reacts at higher levels. Let’s see how it plays out.

ES - December 24th - Daily Trade PlanDecember 24th- Daily Trade Plan - 8:28am
**Note - ES Contracts have rolled over on Trading View from December (ESZ2025) to the March (ESH2026) Contract. I have adjusted the levels on my charts and trade plan to reflect changes.
*Before reading this trade plan, if you did not read yesterday's take the time to read it first! (You can view the posts in the related publication section) *
If my posts provide quality information that has helped you with your trading journey. Feel free to boost it for others to find and learn, also!
My daily trade plan and real-time notes that I post are intended for myself to easily be able to go back and review my plan and how I did from an execution perspective.
--------------------------------------------------------------------------------------------------------
We are now entering the end of the year light volume period as we gear up for 2026. We may only get level reclaims vs failed breakdowns between now and January 1st. I will continue to post over the holidays, but each post will most likely be short due to price action potentially being slower.
Overnight high is 6960 and Overnight low is 6952. Not much of a range, but if we can lose 6852 and reclaim it should take us higher and potentially fill the overhead gap that I have highlighted on the chart.
Key Levels Today -
1. 6952 - Flush and Reclaim
2. 6936 - Flush and Reclaim
3. 6915 - Flush and Reclaim
4. 6900 - Flush and Reclaim (Potentially close the gap at 6892)
I hope everyone has a Merry Christmas and Happy Holidays with their families. Good health and success in 2026. 🎄🎅
----------------------------------------------------------------------------------------------------------------
Purple = A Weekly Low (Current or Previous Week)
Blue = A previous day low (Day before or day in the past week)
Red - Overnight Session High/Low (Prior to my post)
White = Key Support/Resistance Levels

GOLD its breakout? what's next??#GOLD.. KEEP CLOSE
4484 85 that is breakout area.
below sustain means a dip on the table..
good luck
trade wisely

ES ShortsThe NY Session will bleed today! Markets are gonna fall like crazy. The only liquidity available is on the lower side. I'll trail the tp and sl once my target hits, and keep it running until I see a market structure shift.
This is not a financial advice. I don't give signals or tips for trading, it's for educational purposes.

HOHOHOHow much liquid are we gonna need to sweep?? Interesting Level, in Range of BIg Sell of Christmas night. Might retrace Sweep out all the short term Traders have massive manipulation as always before then ascendinc to ATHS!- Merry Christmas guys dont spend all your time on the charts today- enyoj your family while you have them. Begreateful for them even if u hate them. Much love and merry christmas- xx

MNQ (15m) POI Map — Why These Levels Matter and how to use themMNQ (15m) POI Map — Why These Levels Matter (and how I’m using them)
I don’t like “winging it” once the market starts moving fast. So before the session (or during quieter pre-market hours), I mark **Points of Interest (POIs)** that I expect price to **react from**—either as support/resistance, liquidity targets, or “decision zones” where bias can flip.
These POIs are not magic lines. They’re **locations where order flow has already proven itself**, and where I want to be *ready* instead of *surprised*.
---
## How I chose these POIs (my filter)
Each POI on this chart was mapped using 3 things:
1. **Structure (15m swings / pivots)**
Where price previously *broke structure* or *rejected hard*.
2. **Liquidity (obvious targets)**
Equal highs/lows, clean swing points, and “everyone sees it” areas where stops sit.
3. **Reaction history (clean reactions)**
Levels that have already caused a noticeable bounce, stall, or reversal = worth respecting again.
---
## The Levels (Bull POIs)
### **BULL POI #1 — 25,810.50**
This is my **first decision level** in the current zone. It’s the closest “line in the sand” where:
* Holding above it keeps bullish continuation alive
* Losing it opens the door for a rotation back into the lower POIs
**How I use it:**
If we tag this area and **hold/accept above** (strong bodies, wicks getting bought, reclaim after a sweep), I’m looking for longs targeting the next POI up.
---
### **BULL POI #2 — 25,874.25**
This one is a **higher pivot / reaction zone**—the type of level where price often:
* pauses to consolidate
* rejects for a pullback
* or breaks through and turns into support
**How I use it:**
If price is trending up, this is a logical **first major target** and a spot to either scale profit or look for a clean break-and-retest to continue.
---
### **BULL POI #3 — 25,927.00**
This is a **liquidity + swing area**. It’s the kind of level that’s attractive for:
* stop runs above prior highs
* profit-taking
* reversal setups if momentum stalls
**How I use it:**
I treat this as a “reaction expected” level. If we arrive with weak momentum, I’m cautious chasing longs into it.
---
### **BULL POI #4 — 25,949.25**
This is my **upper extreme POI**—usually a bigger “decision area” where:
* late longs get trapped if momentum dies
* reversals can form (especially after a sweep)
* or we get continuation if the tape is strong
**How I use it:**
I’m more likely to **take profit into this** than initiate fresh longs unless the market is clearly in expansion.
---
## The Levels (Bear POIs)
### **BEAR POI #1 — ~25,754 zone (25,754.25 on my map)**
This is my **bearish trigger / pivot**. If price loses Bull POI #1 and continues lower, this becomes the next major “prove it” level.
**How I use it:**
If we break down into this area and **reject** (heavy wicks, failed reclaim), I’ll look for continuation shorts toward the next bear POIs.
---
### **BEAR POI #2 — 25,649.75**
This is a deeper **demand/reaction pocket**—a level I expect price to *respect* or at least *pause* at.
**How I use it:**
This is a common “bounce zone.” If shorts are in profit, I’m scaling here. If we sweep it and reclaim, I’m watching for reversal setups.
---
### **BEAR POI #3 — 25,622.25**
This is the **lower extreme / liquidity pool** level—where panic moves can exhaust and snap back.
**How I use it:**
I’m not trying to short *into* this level late. This is where I expect **either**:
* a final flush and reversal attempt
**or**
* a strong breakdown continuation (if the day is truly risk-off)
---
## The whole point of mapping POIs
These levels give me a simple plan:
* **Hold above Bull POI #1 → bullish bias stays active**
* **Lose Bull POI #1 → expect rotation to Bear POI #1**
* **Each POI is either a target, a reaction zone, or a bias flip zone**
I’m not predicting. I’m preparing.
---
## Execution Rules (what I wait for at a POI)
At any POI, I want confirmation like:
* **Sweep + reclaim** (liquidity grab then strong close back through)
* **Break + retest** (clean structure change)
* **Rejection candles** (wicks + follow-through away from the level)
* **Acceptance** (multiple closes above/below = level flips)
Then I manage risk using a simple concept:
**Invalidation goes just beyond the POI. Targets are the next POI.**
---
### If you’re using my tool stack:
These POIs pair well with:
* **ORB direction/bias**
* **VWAP/EMA context**
* **Reversal confirmations** (only when the POI + context agree)
---
**Not financial advice. Futures are high risk—size accordingly and protect your downside.**
If you want, I can turn this into a cleaner “TradingView publish-ready” format with a tighter intro + bullet layout, and add your usual TRADESWITHB call-to-action at the end.

XAGUSD VIEW!!Gold broke above $4,500 an ounce for the first time on Wednesday while silver and platinum also marked new record highs, as safe-haven demand and expectations of further U.S. rate cuts next year fuelled speculative interest in precious metals.
Spot gold
GOLD
was up 0.2% at $4,494.49 per ounce at 1220 GMT, after marking a record high of $4,525.19 earlier in the session. U.S. gold futures
GOLD
for February delivery climbed 0.4% to $4,523.10.

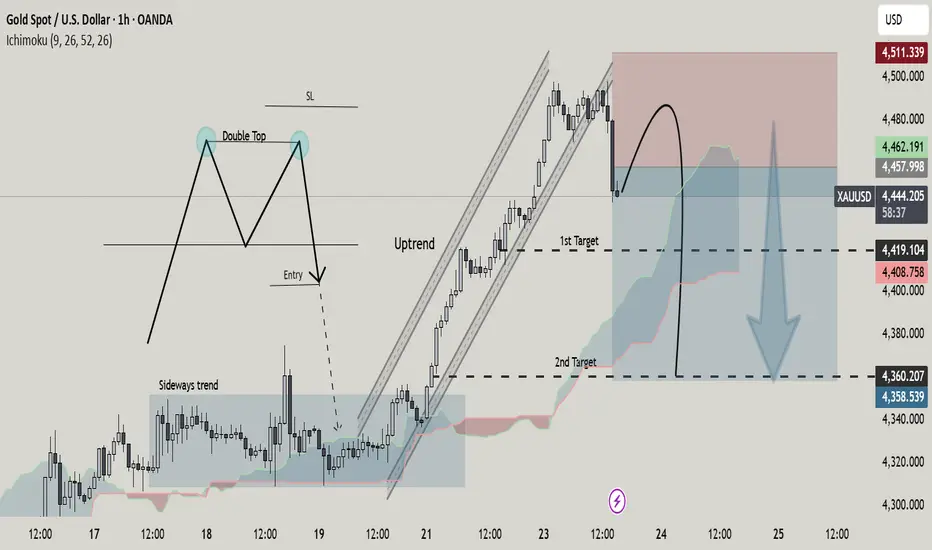
Double Top Reversal Signals End of Bullish MomentumPrice was in a strong bullish channel (uptrend), making higher highs and higher lows. A Double Top formed near the highs, signaling buyer exhaustion and a potential trend reversal.Price failed to hold above resistance and showed rejection near the top, aligning with the Ichimoku resistance / cloud reaction. After the double top, momentum weakens → bearish pullback / correction expected. 1st Target: Prior structure support (mid-range level)
2nd Target: Deeper support aligned with Ichimoku cloud base Invalidation is above the double-top highs (SL zone).
Below that, sellers remain in control.
Overall:
This chart illustrates a classic trend exhaustion → reversal setup, ideal for traders watching price action + Ichimoku confluence.
Gold (XAUUSD) – Bullish Continuation Toward 4,525 Resistance Market Structure
Overall bias: Bullish continuation
Price made a strong impulsive move up, followed by consolidation / pullback, not a breakdown.
Current structure shows higher highs and higher lows, suggesting buyers remain in control.
🟥 Demand / Support Zone (Red Area)
Zone: ~4,450 – 4,470
This is a strong demand zone:
Previous sharp bullish reaction from this area
Acts as a buy-on-dip zone
As long as price holds above 4,449–4,450, bullish structure remains valid.
🟩 Upside Target / Supply (Green Area)
Target zone: ~4,525 – 4,526
Marked clearly as TARGET POINT
This aligns with:
Prior swing high
Likely liquidity / resistance zone
Expect profit-taking or reaction there.
📈 Current Price Behavior
Price is consolidating around 4,490
This looks like:
Bullish flag / range before continuation
Healthy pause, not distribution
The arrow projection suggests a dip → rally scenario, which fits the structure.
🧠 Trade Scenarios
✅ Bullish Scenario (Preferred)
Entry idea: Pullback into 4,470 – 4,450
Invalidation: Clean break & close below 4,445
Targets:
TP1: 4,510
TP2: 4,525 – 4,526
⚠️ Bearish Scenario (Lower Probability)
Only valid if price:
Breaks below 4,449 with strong momentum
Then price could revisit lower liquidity, but this is not confirmed yet
📌 Summary
Trend: Bullish
Zone to watch: 4,450–4,470 (key demand)
Target: 4,525+
Best strategy: Buy pullbacks, not chase
If you want, I can:
Mark entry / SL / TP precisely
Analyze this on higher timeframe (H1 / H4)
Convert this into a scalping vs swing plan

A BUY AGAIN A buy at 4492-87, sl at 4478, we monitor price reaction and how the candles close by 4 p.m UTC because it can fail to close above the violet rectangle and close below by 4 p.m for it to sell rather

Buy SILVERI would like to see price retrace downside and take out those lows before I look for buys the shift has already happened although I expect some manipulation before the main move up.

Weekly Forecast: Gold Likely to Move Toward 4500The outlook for XAU/USD (Gold) is currently positive. The price could rise from around 4,295, with potential for movement down to 4,180 if there is a temporary pullback. The focus is on possible further increases towards 4,500, based on current momentum.
The market has been moving upward, showing signs of strength with consistent upward movements. Recently, the price moved out of a high-activity zone, indicating potential for continued growth. This suggests the price may keep pushing higher as the upward trend remains intact.
The gap in price suggests there is room for growth before the market hits the next major level. Price action and trendlines support the idea of the market moving further upward. With the current support level holding and a clear path ahead, there is an opportunity to capture the next phase of the move.
If the price dips, there is a lower level around 4,180 where it could find support and potentially reverse. However, with the trend in favor of higher prices, the market may continue upward towards 4,500.
This setup offers a favorable risk-reward ratio, with potential for significant movement over the next period. It’s important to stay patient and observe how the price moves to adjust your approach accordingly.

XAUUSD: Rejection from 4,420 Resistance - Pullback Toward 4,350Hello everyone, here is my breakdown of the current XAUUSD setup.
Market Analysis
XAUUSD continues to trade within a broader bullish structure, but the current price action signals a short-term corrective phase. After forming a strong upward impulse, gold established a well-defined upward channel, confirming buyer control. Price then broke above the previous consolidation range, which marked a continuation of bullish momentum.
Currently, XAUUSD pushed higher and reached the Resistance Zone around 4,410–4,420, a level that has historically acted as a strong supply area. At this zone, price showed clear rejection, with sellers stepping in aggressively and limiting further upside. This reaction suggests that supply is currently outweighing demand at these highs. As a result, price is now pulling back from resistance and moving toward the Support Zone around 4,350, which aligns with the previous breakout area and the lower boundary of the upward channel. This zone represents a key demand area where buyers have previously defended the trend. The recent breakout above this level followed by a retest further strengthens its importance.
My Scenario & Strategy
My scenario remains short-term bearish as long as XAUUSD stays below the 4,410–4,420 Resistance Zone and continues to show rejection from this area. I expect price to retrace toward the 4,350 Support Zone, where the next reaction will be crucial for determining continuation or deeper correction.
Therefore, A clean breakdown below the 4,350 Support Zone would confirm a deeper corrective move within the structure and could open the path toward lower demand levels along the channel support. However, if price reaches support and shows a strong bullish reaction, the broader bullish structure remains intact, and buyers may attempt another push toward the resistance highs. For now, the focus is on the corrective pullback, with 4,350 acting as the key level to watch.
That's the setup I'm tracking. Thank you for your attention, and always manage your risk.

WTI – West Texas Intermediate Crude Oil.👋 Hello TradingView Traders!
Hope you’re doing well and trading with clarity and discipline 📊🤝
Today, we’re taking a closer look at WTI – West Texas Intermediate Crude Oil.
🛢️ Symbol Overview
WTI Crude Oil is one of the most actively traded commodities in global markets and is heavily influenced by:
Global supply & demand dynamics 🌍
OPEC decisions 🏭
Macroeconomic and geopolitical factors ⚠️
Because of this, WTI often provides high-quality technical and price action opportunities for traders.
📈📉 Overall Market Structure (Daily)
On the daily timeframe, price is currently trading in a key decision zone:
The broader structure has been bearish
Price is now reacting at a major daily support
At the same time, we are seeing a break of the descending trendline (dynamic resistance)
As a result, bullish and bearish forces are currently balanced ⚖️
🧱 Key Levels & Technical Structure
🔹 Dynamic Resistance (Descending Trendline)
This trendline has capped price for an extended period.
The recent break above it may signal early weakness in selling pressure 📉➡️📈
🔹 Daily Support
The highlighted daily support zone is a critical demand area where price is currently reacting.
Holding above this level could lead to a corrective or reversal move 🟢
🔹 Daily Resistance
If price moves higher, the marked daily resistance zone will act as a key obstacle:
Rejection could resume bearish pressure
A clean breakout would strengthen the bullish case 🚀
🔄 Potential Scenarios (Balanced Outlook)
🟢 Bullish Scenario:
If price holds above daily support and confirms the trendline break with a valid pullback:
Price may advance toward the daily resistance zone
Market structure shifts into a bullish correction 📈
🔴 Bearish Scenario:
If price fails to hold daily support:
A breakdown could trigger continuation of the broader bearish trend
Lower targets become active 📉
➡️ This places WTI at a highly sensitive and decisive technical area.
🧠 Final Summary
✔️ Trendline break → early bullish signal
✔️ Daily support → critical reaction zone
✔️ Overhead resistance → major decision level
At this stage, neither buyers nor sellers have full control, and confirmation will come from how price reacts to these key levels ⚖️📊
⚠️ Disclaimer
This analysis is for educational purposes only and does not constitute financial advice.
Always apply proper risk management, use stop losses, and trade according to your own strategy and risk tolerance ❗🧠
📊 What’s Your View?
💬 Do you expect:
A bullish reaction from daily support? 🟢
Or continuation of the bearish trend? 🔴
Share your thoughts in the comments ✍️
Don’t forget to Like ❤️ and Follow 🌟
Trade safe and stay profitable 🤝📈
🏷️ Tags
#WTI #CrudeOil #OilTrading #TechnicalAnalysis #PriceAction
#SupportResistance #TrendlineBreak #DailyChart #TradingView

XAUUSD | Safe-Haven Demand Drives Further UpsideGOLD | Technical & Fundamental Overview
Gold prices continue their upward trend, extending gains after reaching a new record high in the previous session.
Investor demand remains strong as markets price in future Fed rate cuts and ongoing geopolitical uncertainty, reinforcing gold’s role as a safe-haven asset.
Notably, gold has recorded more than 50 all-time highs this year, highlighting the strength of the underlying bullish trend.
Technical Outlook
Gold has reached our previously mentioned resistance target at 4515.
The bullish structure remains active, and the price may continue higher toward 4521 and 4540, especially if a 1H candle closes above the 4500 pivot level.
However, if the price trades below the 4490–4500 zone, a short-term corrective move toward 4472 is likely before the next directional move.
Key Levels
Pivot Line: 4500
Resistance: 4521, 4540, 4572
Support: 4474, 4460, 4438
Bias: Bullish above 4500; corrective below 4490–4500.

USOIL (WTI) – High-Probability Bullish Setup USOIL (WTI) – High-Probability Bullish Setup from Strong Demand Zone
🔍 Market Structure & Price Action Insight
USOIL is currently trading inside a well-defined and repeatedly tested demand zone between 55.10 – 56.50.
This zone has proven its strength by rejecting price three times in the past, each time producing a meaningful bullish reaction.
The current revisit into this zone offers a high-quality risk-defined buying opportunity for swing and positional traders.
📌 Trade Execution Plan (Bullish Bias)
🟢 Entry Zone:
55.10 – 56.50
🔴 Stop Loss:
50.00
(Below the demand structure to avoid false breakdowns)
🎯 Target 1:
64.00
(Previous structure + supply reaction area)
📊 Technical Confluence
✔ Multiple demand-zone validations
✔ Price reacting at historical accumulation area
✔ Clear structure-based invalidation level
✔ Favorable Risk : Reward profile
🧠 Professional Trading Insight
Strong trades are not created by prediction, but by location and confirmation.
When price revisits a proven demand zone, patience and discipline offer an edge. Entries taken close to demand provide superior psychology and controlled risk.
📈 Trade Management Note
Partial booking can be considered near intermediate resistance levels.
Trail stop only after structure confirmation — let the market do the work.

To our amazing followers — thank you for being with us!Huge shoutout to all our followers for an incredible year!! Your support is everything; it’s what keeps us motivated every single day!
We’ve got some killer updates in the works for 2026🚀 to Boost Your Trading.
We’re gonna work our tails off to keep your trust and deliver the best value possible.
Stay tuned!🔥

Gold Enters PRZ After New ATH — Time to Watch for Shorts?Gold ( OANDA:XAUUSD ) started the new week by printing a New All-Time High(ATH).
At the moment, price is moving inside the Potential Reversal Zone(PRZ) and is also approaching the upper lines of the Small/Large ascending channel.
Technically, there is a strong probability that these upper channel lines act as dynamic resistance for gold.
From an Elliott Wave perspective, gold appears to be in the process of completing Main Wave 5.
The main wave 5 could reasonably terminate inside the Potential Reversal Zone(PRZ) .
Additionally, a clear Regular Bearish Divergence (RD−) is visible between the last two consecutive highs.
This Regular Bearish Divergence (RD−) is not limited to lower timeframes and can also be observed clearly on the Daily timeframe, which adds weight to the setup.
Based on this confluence, I expect gold to start a corrective move from the Potential Reversal Zone(PRZ) , with a minimum downside target toward the key support lines.
First Target: Support lines
Second Target: Support zone($4,357-$4,341)
Stop Loss(SL): $4,475
Points may shift as the market evolves
💡 Please respect each other's opinions and express agreement or disagreement politely.
📌 Gold Analyze (XAUUSD), 4-hour time frame.
🛑 Always set a Stop Loss(SL) for every position you open.
✅ This is just my idea; I’d love to see your thoughts too!
🔥 If you find it helpful, please BOOST this post and share it with your friends.

USOIL short trade setupIf price maintain below those Lower Highs, the dotted line, I can still see reasons to short USOIL.
-Price has been trending down creating LH's and LL's .
-I can see buyers presence only above that dotted line (!!!).
-I charted this on the 4H so this may take long to play out.
Patience.
