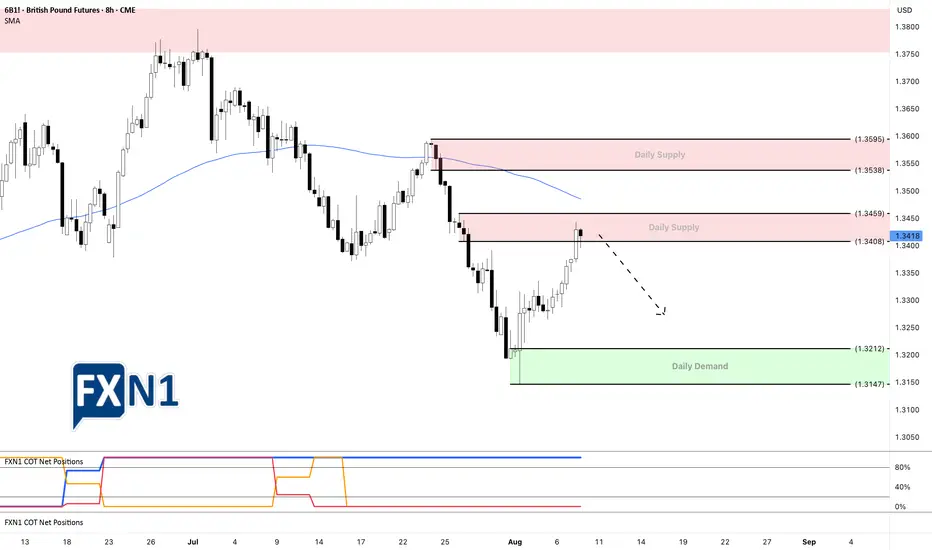
GBP/USD Faces Key 8-Hour Supply ZoneToday, the GBP/USD futures approached an 8-hour supply zone, presenting a potential shorting opportunity. The price action indicates the beginning of a possible downtrend within this timeframe. Additionally, the latest COT report reveals that non-commercial traders are increasing their short positions, reinforcing the bearish outlook.
It will be crucial to review the upcoming COT report over the weekend for a clearer market perspective. However, based on current signals, the market may be poised for decline. Should this 8-hour supply zone be breached or ignored, another supply area lies just above, which could serve as an alternative resistance level to monitor.
✅ Please share your thoughts about 6B1! in the comments section below and HIT LIKE if you appreciate my analysis. Don't forget to FOLLOW ME; you will help us a lot with this small contribution.
Futures market
Only look for BUY signal points in the current trend of Gold✏️The D1 candle closed with strong bullish force at the end of the day. The gold trend is still increasing wave 3 and there is no sign of correction. The reaction around 3385 in the Asian session this morning is being awaited to see if it is a recovery of Gold or not. The BUY strategy at important support zones is still maintained and pay attention to the price reaction of the candle.
📉 Key Levels
Support 3363-3346-3332
Resistance 3385 - 3407
Buy trigger: Confirmation of buying candle at support zones 3363-3346-3333
Target: 3400.00

Correction in Tokyo, London session. And return go up in NewYork✏️Gold prices saw some selling pressure in the Tokyo session. Yesterday's US session saw strong buying pressure, leading to a psychological profit-taking session early today. The possibility of a correction in the Asian and European sessions today and the buying pressure will return in the London session. The SELL signal is triggered at the moment and the Target is aimed at the reaction of buyers at the support areas for the BUY strategy.
📉 Key Levels
SELL now 3375 (Scalping)
BUY trigger: Price rejection at the support areas 3346-3333-3315
Target 3420
Leave your comments on the idea. I am happy to read your views.
Us oil bullish setupI’m bullish and I was waiting for the pullback…its happening and I’m buying at the buy zones shown on the chart, stop will be the yellow line.

TP REACHEDOur 2nd trade of the day closed with profits.
We choose to close our trade right before it reached the main TP due to one reason, a pullback on a Liquidity lvl we have at 64.178 (5min chart).
It was a great day!
See you tomorrow!
Follow for more!

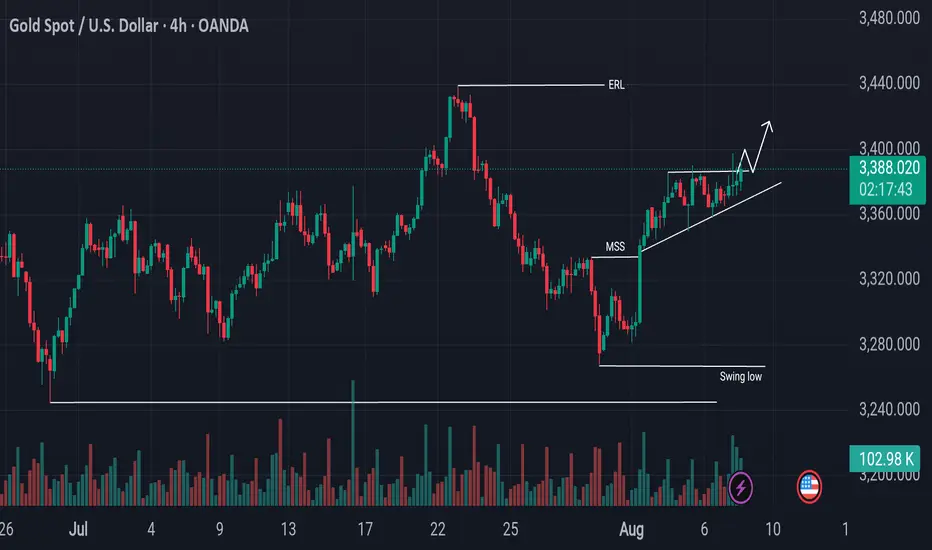
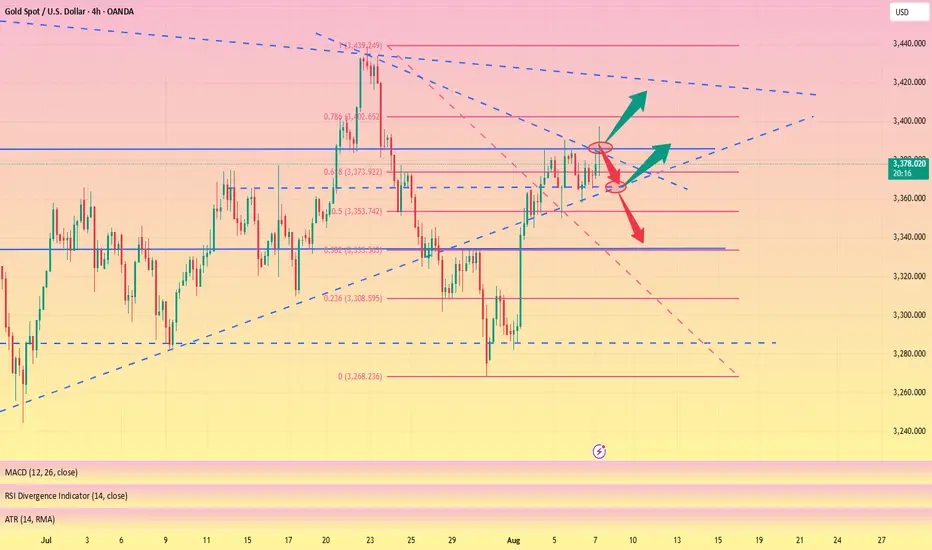
Bullish Shift in Gold Breakout in Sight?The gold market has recently confirmed a Market Structure Shift (MSS), signaling a bullish transition in the current trend. Price action is currently moving upward but has entered a key engulfing sell zone, where sellers have previously shown strong interest. The market is now testing a significant resistance level around 3385, which has temporarily capped further upside momentum.
If a decisive candlestick closes above the 3385 resistance zone, it could confirm bullish strength and open the door for a potential continuation to the upside. In such a scenario, a retest of the broken level may provide a high-probability entry point for further bullish targets, as the market aims to sweep higher liquidity levels.
As always, Do Your Own Research (DYOR) before making any trading decisions. Market conditions can shift rapidly, and risk management remains essential.
Gold price maintains upward trend to 3400⭐️GOLDEN INFORMATION:
Gold (XAU/USD) edged lower during the North American session, pressured by rising U.S. Treasury yields, profit-taking, and reports that President Donald Trump may announce a replacement for Fed Governor Adriana Kugler later this year. The precious metal is trading around $3,372, down 0.23%.
After a three-day rally, bullion struggled to gain further traction as investors locked in profits. This came despite Trump signing an executive order imposing a 25% tariff on India in response to its continued imports of Russian oil. The new duties—set to take effect 21 days after August 7—will raise tariffs on select Indian exports to as much as 50%.
⭐️Personal comments NOVA:
Gold prices continue to increase, heading towards 3400. The context of trade tensions heats up again, along with increasing expectations of interest rate cuts.
⭐️SET UP GOLD PRICE:
🔥SELL GOLD zone: 3429- 3431 SL 3436
TP1: $3418
TP2: $3408
TP3: $3392
🔥BUY GOLD zone: $3332-$3330 SL $3325
TP1: $3342
TP2: $3355
TP3: $3368
⭐️Technical analysis:
Based on technical indicators EMA 34, EMA89 and support resistance areas to set up a reasonable BUY order.
⭐️NOTE:
Note: Nova wishes traders to manage their capital well
- take the number of lots that match your capital
- Takeprofit equal to 4-6% of capital account
- Stoplose equal to 2-3% of capital account

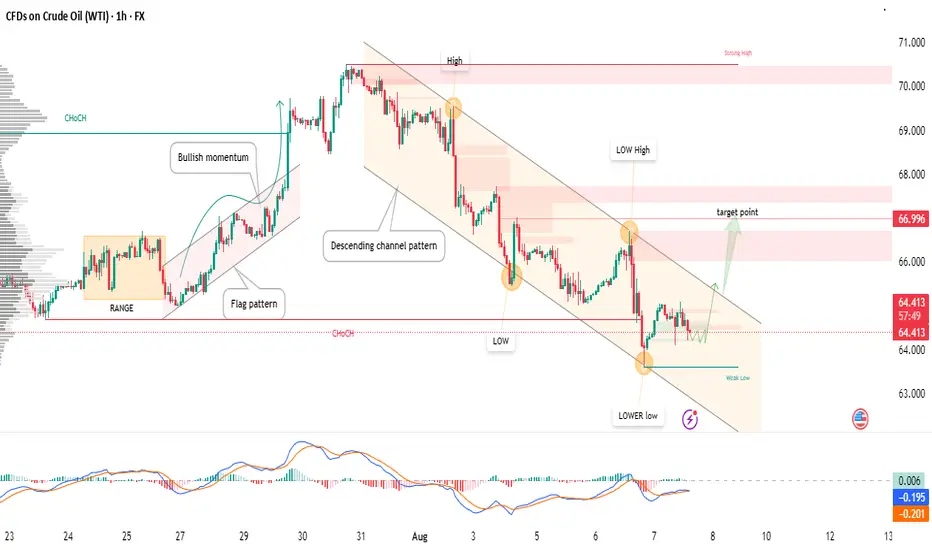
USOIL - Potential Bullish Reversal Inside Descending Channel!📉 After a significant bearish move from the recent high, USOIL is trading within a well-defined descending channel pattern.
🔍 Key observations:
Price has printed a lower low into a weak low area, showing signs of seller exhaustion.
A potential reversal pattern is forming at channel support.
MACD shows bullish momentum divergence, hinting at a short-term reversal.
Targeting the supply zone near 66.99, aligning with the previous low high and key structure zone.
🟢 Trade Idea:
Looking for bullish confirmation to trigger a long setup.
Target: 66.99 (near upper channel boundary and previous structure)
Manage risk carefully with a stop below the recent low.
⚠️ Disclaimer: This is a technical analysis-based idea, not financial advice. Always do your own research and manage risk accordingly.
NATGAS WILL FALL|SHORT|
✅NATGAS made a retest of the
Strong horizontal resistance level of 3.150$
And as you can see the price is already
Making a local pullback from
The level which sends a clear
Bearish signal to us therefore
We will be expecting a
Further bearish correction
SHORT🔥
✅Like and subscribe to never miss a new idea!✅

GOLD (XAUUSD): Technical Analysis Ahead of Trump
One of the important news for today is Trump speech during
the late New York session.
Here is my brief technical outlook for Gold ahead of that.
As we discussed on the yesterday's live stream, the price
is now coiling on a recently broken rising trend line that serves
as a vertical resistance now.
A bullish breakout of that and a daily candle close above
will provide a strong bullish confirmation and push the prices to 3430.
Alternatively, very bearish news today may trigger a retracement
to an underlined horizontal support.
Let's see how the market is going to react tonight.
❤️Please, support my work with like, thank you!❤️
I am part of Trade Nation's Influencer program and receive a monthly fee for using their TradingView charts in my analysis.

Jobless Claims Data Forecast Big XAUUSD Forecast, a pivotal momeIf you want to make good profits in gold then this is for you.
Jobless Claims Data Forecast Big Gold Forecast, a pivotal moment for every XAUUSD trader. In this video, we build a technical and fundamental outlook for Gold (XAUUSD), combining new US jobless claims data with a strong technical setup. This analysis will help you make informed decisions with real-time charts and smart strategies. Discover how the forecast numbers affect market sentiment and get a clear gold buy/sell setup based on data-driven insights. Don't miss this important market forecast - watch now and stay ahead of the crowd before the next price action hits! Perfect for scalpers, swing traders, and investors.
#XAUUSD
#GoldTrading
#JoblessClaims
#GoldForecast
#XAUUSDAnalysis
#ForexNews
#GoldBuySell
#TradingStrategy
#FundamentalAnalysis
#TechnicalAnalysis
#GoldBuySellSignals
#XAUUSDAnalysis
#ForexSignals
#GoldTechnicalAnalysis
#DayTradingXAUUSD
#LiveGoldAnalysis
#GoldPricePrediction
#XAUUSDScalping
#goldtrendinfo

XAUUSDXAU/USD Bullish Bias — Price is rebounding strongly from a key demand zone, with higher lows confirming sustained buying pressure. As long as the demand zone holds, the bias stays bullish, with momentum favoring a move toward the next resistance. Watch for confirmations during London and New York sessions, as gold typically reacts strongly in these hours.

GOLD AGAINGold hit our BE, and still believe for sell to buy...We re-entered shorts. We trust still setup

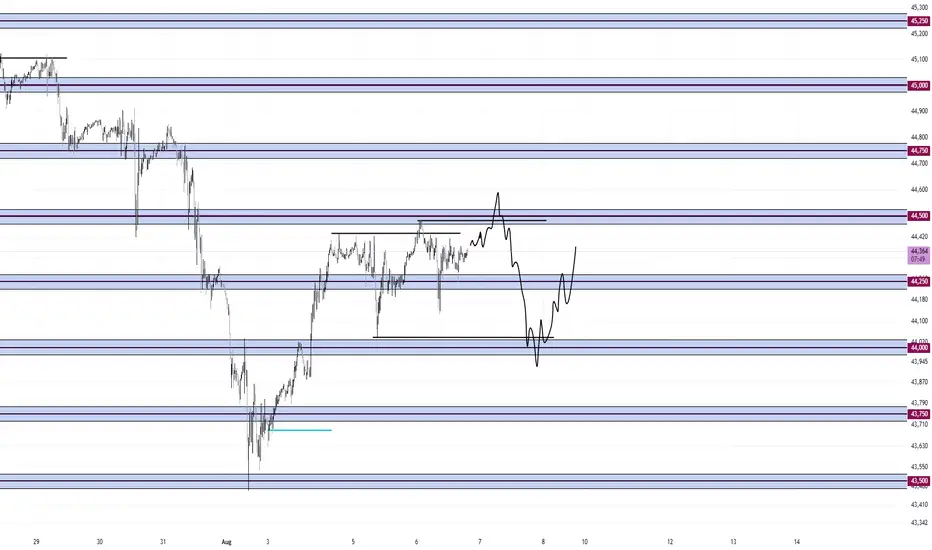
Mean Reversion Around 250. Buy at 00's and Sell 500I can see price mean reversion around 250. Therefore, buy the lows and sell the highs.
500 as resistance and 00's as support.
So far, the peak formation is at the low of August, therefore, the trend is bullish.
I am expecting a run of the high then a dump to 44,000 before the continuation of the bull trend
XAU/USD | Gold at a Turning Point – Breakout or Breakdown Ahead?By analyzing the gold chart on the 4-hour timeframe, we can see that after our last analysis, gold continued its correction and dropped to $3358. It’s currently trading around $3367, and for the bullish scenario to remain valid, we need to see price hold above $3358 and soon close above $3370. If this happens, another bullish move could follow.
Otherwise, if gold breaks and stabilizes below $3358, this scenario will be invalidated, and the alternative outlook suggests further downside toward $3349 and $3339. This analysis will be updated — and don’t forget to show your support, friends!
Please support me with your likes and comments to motivate me to share more analysis with you and share your opinion about the possible trend of this chart with me !
Best Regards , Arman Shaban


The triangle pattern is about to break through and hit 3400#XAUUSD
Although the price of gold was too high last night due to the rise in risk aversion, the upward momentum weakened significantly in the evening, and it fluctuated sideways at a high level. Gold is currently consolidating within a triangle pattern, with a short-term price increase reaching the triangle's boundary. A break above 3385 could lead to significant intraday gains. Meanwhile, the downside is defending short-term support at 3365. As long as this support level remains intact, the bullish trend remains intact. If the European session gives an opportunity to fall back to the 3375-3365 support area without breaking, you can consider going long and look at 3395-3405, and if it breaks, look at 3415.
Gold (XAUUSD) – 4H Price is currently consolidating near the 3373 level, showing strength above the dynamic support zone and mid-range trend bands. A bullish breakout continuation appears likely, especially if the asset holds the 3360 support zone, which aligns closely with the 38.2% Fibonacci retracement from the recent impulsive move.
Ideal Entry:
Zone: 3360–3365, aligning with a pullback to the Fibonacci 38.2% retracement level and mid-band support.
Invalidation: A clean break and close below 3335 may suggest a deeper retracement or reversal.
🎯 Fibonacci based Targets:
Target 1: 3389 – Immediate resistance and equilibrium level; ideal for partial profit booking.
Target 2: 3422 (38.2% Fib extension) – A stronger extension target in line with the recent highs.
Target 3: 3443 (61.8% Fib extension) – Key swing extension; potential exhaustion or reversal zone.
Stop Loss: Below 3335
As long as price maintains above 3360, the bullish momentum remains valid. Look for bullish candlestick confirmation at entry and increasing volume for confirmation of a move toward the Fibonacci targets.

XAUSD Rising Wedge This chart shows XAU/USD (Gold Spot against the U.S. Dollar) on the 1-hour timeframe and clearly displays a bearish rising wedge pattern forming after a strong uptrend, which is typically a reversal pattern suggesting potential downside.
⸻
🔍 Technical Analysis Breakdown:
Pattern:
• Rising Wedge: Formed by two upward-sloping trendlines — one connecting higher highs and the other connecting higher lows.
• Bearish Bias: Rising wedges are typically bearish, especially when they appear after an uptrend, as seen here.
Key Confluences:
• Multiple rejections at resistance: Price has failed to close above the upper wedge boundary multiple times.
• Price squeezing: The highs and lows are converging, indicating potential exhaustion of bullish momentum.
• Support zone: The blue horizontal line around 3,376–3,380 appears to be short-term support (likely a neckline or breakout retest zone).
• 66-period SMA: Currently acting as dynamic support, but a break below it would add bearish momentum.
⸻
📉 Trade Idea (Short Bias):
Entry:
• Wait for a confirmed break and close below the wedge’s lower trendline and below the 3,375–3,380 zone.
• Ideal entry: Around 3,375 (after confirmation of a bearish breakout).

GOLD BULLS STILL HAVE LAST PUSHBULLS 15M still have power still we have 3414 area need to be tested before we get good correction (BEAR IN MIND GOLD LONG TERM IS BULL)
We will only get this correction if 3414 area holds
Most likely will hold cos i can see 2985 area before we creating new highs for GOLD (2985 AREA WILL BE GOOD PLACE TO BUY AND HOLD)
Any way ONLY TIME WILL TELL
GOOD LUCK

XAU / USD 30 Minute ChartHello traders. We had news earlier, and I am currently looking for scalp positions. I marked my areas of interest on the chart. Looking to grab some pips while we have volume happening. I will update in a bit. Big G gets my thanks. Be well and trade the trend.

August 07 Team Call For Gold FluxThis is just a charting example for the team to use when the markets continue.
Kyle
Upneet
Rae
Ashley
We're looking for gold to reject 3390 and potential head back down to 3375 and if we dont see 3375 hit we'll see the market continue into the 3400.00+ Area looking for Gold to reject 3420 or go towards an ATH.

WTI watch $70.34-70.43: Resistance zone that may STOP the surgeUSOIL spiked on Trump/Russia/Iran tariff threats.
Just hit a significant resistance at $70.34-70.43
Look for a Dip-to-Fib or Break-n-Retest for longs.
