Gold Continues to Rise, Breaking ResistanceWeak US jobs data has increased expectations that the Fed will cut interest rates, weakening the USD and bond yields, making gold an attractive safe-haven asset. Gold has reached 3,371 USD, with US gold futures at 3,425 USD. Gold is currently facing resistance at 3,450 USD, and if broken, it could continue towards 3,500 USD.
The XAUUSD chart is moving within a clear uptrend channel with higher highs and higher lows. Gold has surpassed key support levels, including the Fair Value Gap (FVG), indicating strong buying momentum. The market is now testing the 3,450 USD resistance. If broken, the next target will be 3,500 USD.
Strategy:
Buy: If price breaks above 3,450 USD, aim for 3,500 USD.
Stop Loss: Place below 3,320 USD to manage risk.
Futures market

Prediction Xxauusd keeps rejecting of this box on the 3 hour if we see a close above we will see the 90s

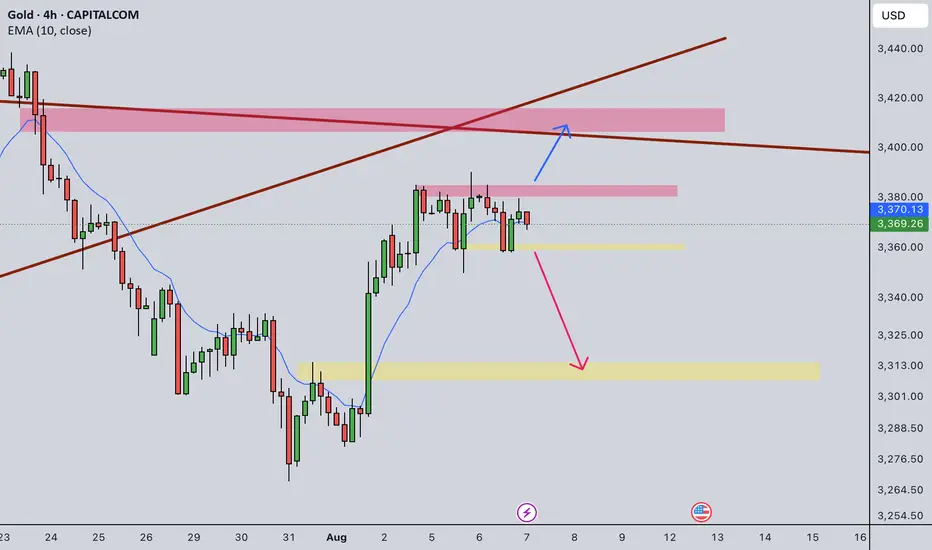
Daily Analysis- XAUUSD (Thursday, 6th August 2025)Bias: Bearish
Notes:
- Daily consolidating after Friday spike up
- Looking for price to retrace back down to daily structure
- Potential SELL if there's
confirmation on lower timeframe
- Pivot point: 3390
Disclaimer:
This analysis is from a personal point of view, always conduct on your own research before making any trading decisions as the analysis do not guarantee complete accuracy.

Thoughts On Gold Ill be waiting for gold to break structure this is my thoughts on both direction the market could potentially go

SILVER WILL GO UP|LONG|
✅SILVER is going up
Now and the pair made a bullish
Breakout of the key horizontal
Level of 37.73$ and the breakout
Is confirmed so we are bullish
Biased and we will be expecting
A further bullish move up
LONG🚀
✅Like and subscribe to never miss a new idea!✅

HHarami about to close in 30 minutes with macd and rsi divergence 1-4 hr 😅 tough luck if you're shorting after a 10% fall 😅

Gold Fails to Break Tuesday’s High – H4 FVG Still in SightGold continues to coil beneath Tuesday’s high, showing signs of failed bullish follow-through. Price attempted to press higher but couldn’t break out — a sign that sellers may still be in control. We’re still under key resistance at the Daily High, and that unfilled H4 Fair Value Gap below remains a prime draw.
🧠 My outlook:
Expecting price to run back down toward the H4 FVG.
Watching for a potential stop run above Tuesday’s high to clean up the lack of excess shown on the DOM.
Anticipating the cleanest LONG setup might appear during NY session, but a solid entry could develop during Asian or London for a short if we see early signs of rejection.
Key levels and reactions around D-H and the previous day’s high will be crucial. If the market tips its hand early, I’ll be looking to position short with that FVG as my magnet.
Let me know if you're seeing something different. This feels like a setup that rewards patience and precision.

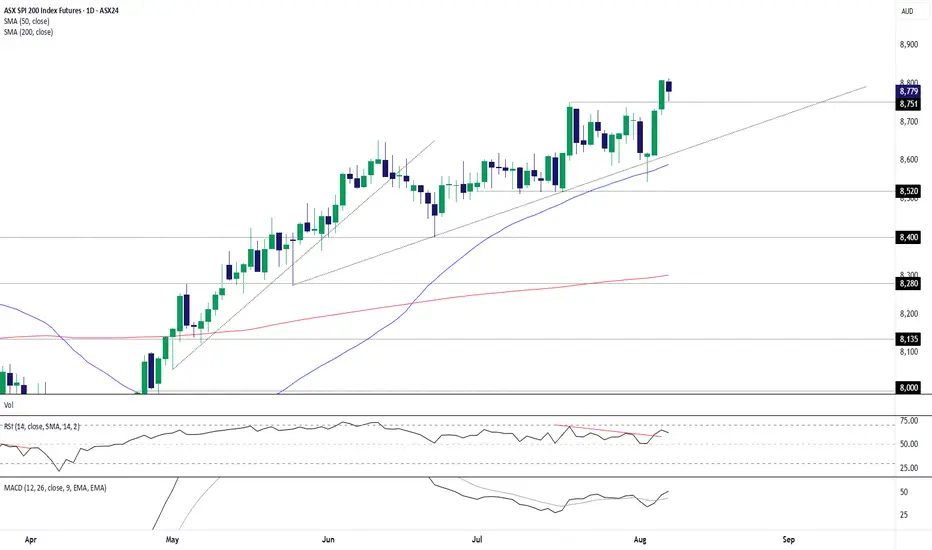
ASX 200 Futures: Back-Test Bounce Keeps Bulls in ControlASX 200 futures remain a buy-on-dips prospect, putting the contract on track to test the 9000 level soon.
Already sitting in an established uptrend, the latest leg higher coincided with a three-candle morning star pattern being completed on Tuesday, providing a bullish signal that goes some way to explaining the price taking out the former record high of 8751 a day later. The back-test and bounce from this level overnight suggest the path of least resistance remains higher. It also provides a level to build bullish setups around should we see a retracement to the level.
If we see a pullback towards 8751, longs could be established above with a stop below for protection. Wednesday’s high and 8900 are levels of note for those contemplating the trade, although 9000 comes across as a more appealing target.
Momentum indicators are also signalling growing topside pressure, with RSI (14) breaking its downtrend above 50 while MACD has crossed the signal line from below in positive territory. Combined, it provides a backdrop that favours a bullish bias.
Good luck!
DS
GOLD FORMING BULLISH PENNANT....Gold is making a bullish pennant lets wait to bounce it back from the previous support level. We will take a long entry to the nearest high FOREXCOM:XAUUSD

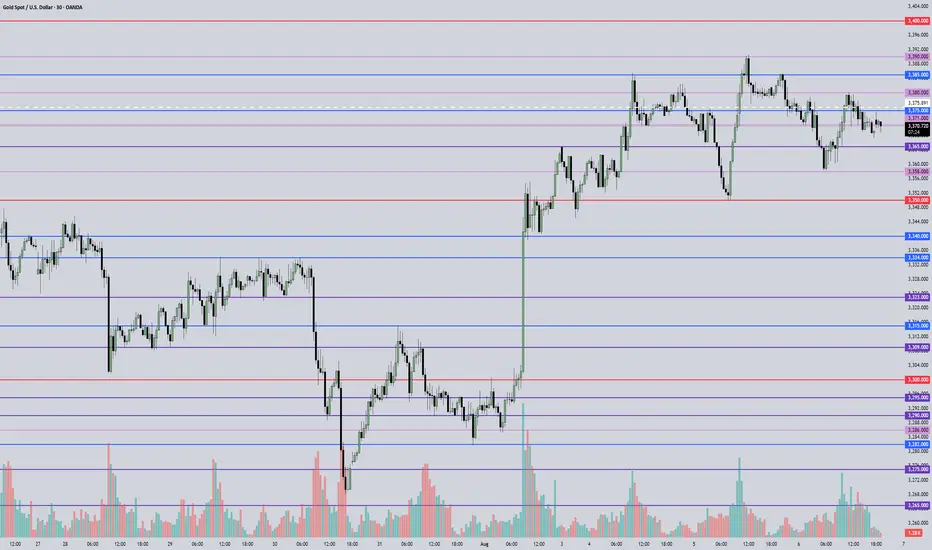
August 7, 2025 - XAUUSD GOLD Analysis and Potential OpportunitySummary:
Price action today is likely to stay within the 3358–3385 consolidation zone. Inside this range, the strategy is to sell near the top and buy near the bottom. Watch 3365 — if it breaks, look for short opportunities on pullbacks; if 3375 holds, look for long setups on dips. Overall, the support and resistance levels are cluttered, suggesting potential choppy moves. I’ll only act on very clean setups near key levels. If they don’t form, I’ll stay on the sidelines. Protect your capital and trade smart — good luck!
📍 Key Levels to Watch:
• 3405 – Resistance
• 3400 – Psychological resistance
• 3390 – Key intraday resistance
• 3375 – Resistance
• 3365 – Support
• 3350 – Psychological support
• 3345 – Support
• 3334 – Support
📈 Intraday Strategy
SELL below 3365, targeting 3358, then 3350, 3345, 3340
BUY above 3375, targeting 3380, then 3385, 3390, 3394
👉 If you find this helpful or traded using this plan, a like would mean a lot and keep me motivated. Thanks for the support!
Disclaimer: This is my personal view, not financial advice. Always use proper risk control.
Day 3 — Trading Only S&P 500 FuturesDay 3 — Trading Only S&P Futures
Daily P/L: -142.87
Sleep: 7 hours
Emotions: Headache & stress from the morning
:thought_balloon: Today’s Trade thoughts:
I made a typo when i was putting some orders in from last night that triggered and started the day -300 so I spent most of today just grinding it back again.
I think going forward, I am going to make a rule to limit myself of only doing 2 MES MAX during night time if i plan to put orders in because it really sadden the mood when you start the day negative.
Overall, today's trading day wasn't that bad, we had bullish structure and AAPL event that carried the market up. I took some shorts at 6355 that didn't work out but eventually made money at the end of the day as i shorted 6375 zones. I have noticed that** max Gamma levels don't truly settle until 11am. **
:bell:News Highlights:
*TRUMP TO IMPOSE ADDITIONAL 25% TARIFF ON GOODS FROM INDIA
:bar_chart: VX Algo Signals (9:30am – 2pm EST):
9:30 AM Market Structure flipped bullish on VX Algo X3! @everyone*
10:20 AM VXAlgo NQ X1 Sell Signal
11:00 AM Market Structure flipped bullish on VX Algo X3!
11:40 AM VXAlgo ES X1 Sell Signal
12:20 PM VXAlgo ES X1 Sell Signal (double sell)
1:40 PM VXAlgo NQ X1DD Buy Signal (double buy)
:chart_with_upwards_trend: Key Levels for Tomorrow:
Above 6332 = Remain Bullish
Below 6315 = Bearish

Buyers have shown upBuyers have shown up in the S&P 500 daily chart. The challenge will be followed through. The next objective to the upside is 6393.

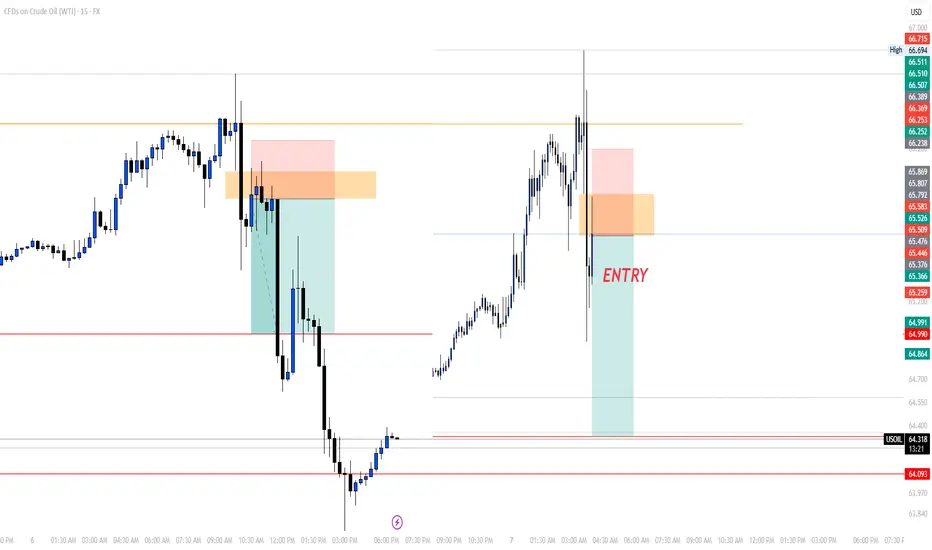
OUR TRADE FOR THE DAYEarly today, I posted that we'll be waiting for the market to give us an entry after grabbing the liquidity, we did have it and caught it.
I didn't share it since it was given to my students.
As you can see on the chart, the market gave us a FVG after that it did grab the liquidity which we entered based on to target again the LQ level to close with a good margin.
Follow for more!
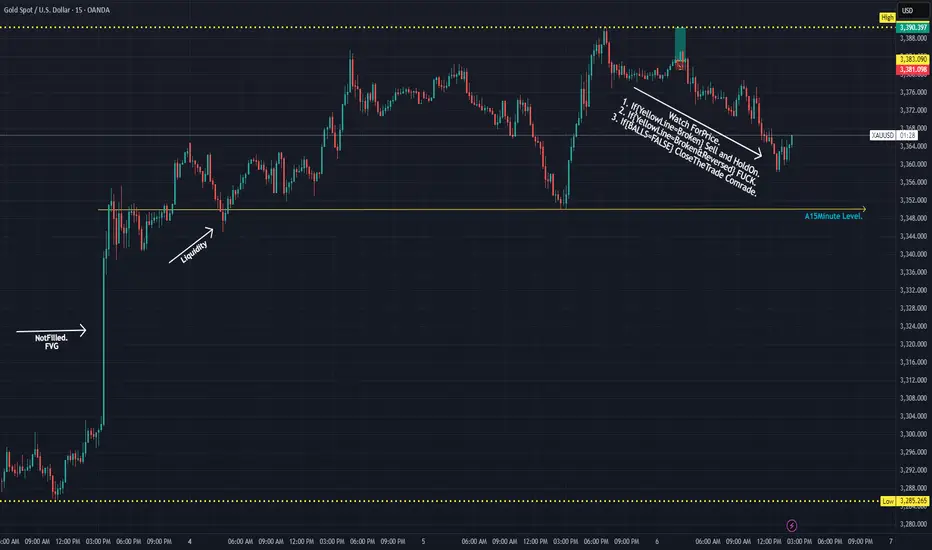
GOLD 15MInute PLan. Enjoy..So the Image is Simple as it is.
Currently @15$ gonna keep trading it.
Started @10$ Last Night.
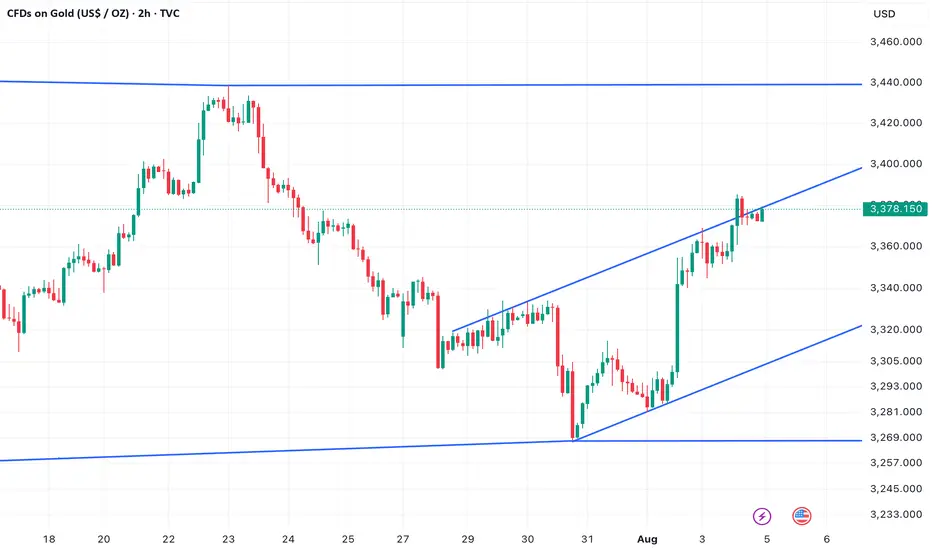
Gold in ascending channelAfter last week's steep and violent drop from $3,439 USD post Fed, Gold has found new momentum thanks to weaker than expected non-farm payroll numbers. But the price has been capped inside an ascending channel. This doesn't look particularly convincing to me for a strong reversel and bull case in the short term unless we manage to break out of the channel soon. If we fail to break the $3,439 USD high pre- Fed meeting I expect a test of the lower bound of the channel and a potential break below that.
A break below the channel opens up the way to the low at $3,267 USD.
GOLD 8/7/25Head and shoulders pattern forming. Waiting for price to create LLs and LHs before taking an entry. Once we get a bearish indication, we will wait for a correction to take an A+ entry.

Gold Intraday Trading Plan 8/7/2025Gold is trapped in a range from 3357 to 3385 right now. I will look for trading opportunity upon breaking of the resistance or support.
If 3385 resistance is broken, I will buy toward 3417.
If 3357 support is broken, I will sell toward 3315.
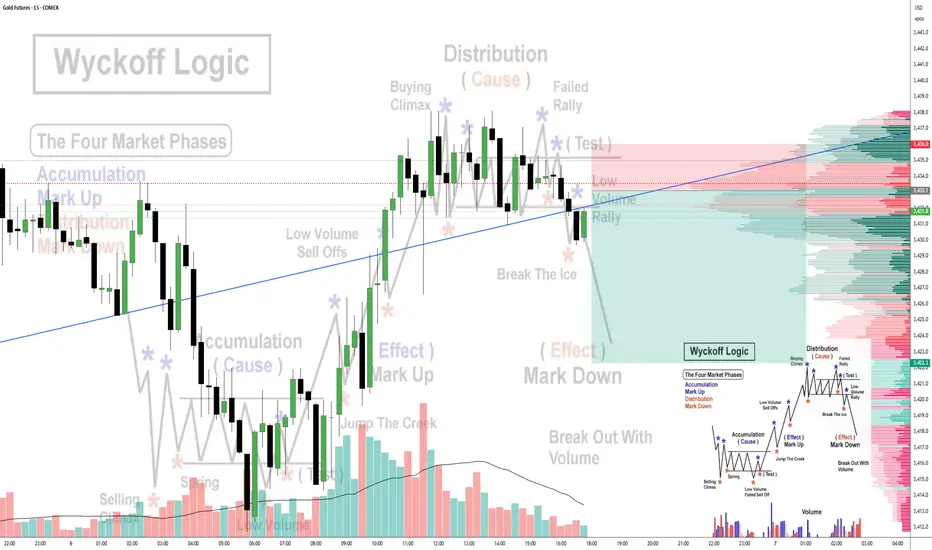
06-08-25 GC Wyckoff 5 minLet just see where this is going, same pattern on Daily and 5 min
Any of them could go up and this still would be Wyckoff theory, except Distribution would be called Reaccumulation
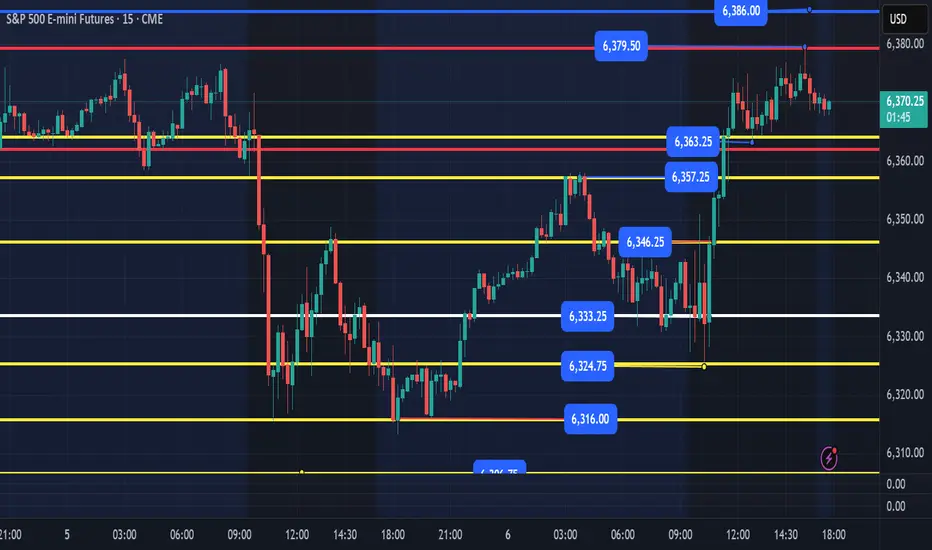
ES - August 6th Evening Open / August 7th Daily Trading PlanWe held the 6324 level today and institutional buyers stepped in at this level and we rallied to our targets for the day. We currently have our first support down at 6363 level and an ultra-bull case for tomorrow is to build a flag and break out above 6380 with targets of 6386, 6402+
Ideally, we would pull back overnight and flush 6344, 6323 or the 6315 level and reclaim for a nice move up the levels. Either way, trend is still up, and short-term bulls need to hold 6315 level, or we will probably retest the levels below at 6297, 6280, 6252 and then the Friday's low of 6240.
I will update my August 7th trading plan tomorrow am as we need to see what price does in the evening session. My lean is we don't lose 6344, but any flush and recovery of levels outlined we should continue up higher.
Natural Gas Bullish Recovery?Nat gas has recovered key technical levels with a strong rally today.
Looking at the daily chart we got a close above the 7 MA staging a potential 3 bar surge setup.
Nat gas looks to be targeting 3.18 in the near term...
Inventory report tomorrow: 10B forecast for inventories.
A potential arbitrage opportunity setting up for EQT, upside calls for next week.

Be in Lon Position for GOLDDears
After breakout red zone we can fill buy order with small stop lose for big target.


NQ heading back to weekly AVL🕵️ Chart Overview
• Instrument: MNQ1! (Micro Nasdaq Futures, continuous contract)
• Timeframe: 4H
• Method: Volume Profile + Price Action + Supply/Demand
⸻
🔷 Technical Commentary
Entry Zone
• Price Range: 23,463.25 – 23,608.25
• Context: Clearly marked supply zone formed after a strong rejection wick and drop, likely a mitigated order block or an area with resting sell orders.
• Price recently tapped into the bottom edge of this zone and is showing signs of reaction.
• You’re targeting this as an ideal short re-entry point on a retracement move.
Confluence Factors
• Volume Profile: High volume node (HVN) just below the entry zone, suggesting this area previously acted as fair value before price got rejected.
• Structure: Bearish internal structure shift after that strong swing high. Price created a lower high and lower low, supporting the short idea.
• Clean break & retest: You’ve waited for the pullback to a previous area of interest—textbook risk-efficient trading.
TP Area
• Target Range: ~22,800s zone
• Likely drawn from:
• Previous demand area
• Volume gap / low-volume node
• Strong bounce from this zone last time suggests it’s a key support.
• Gives a nice 2–2.5R setup, depending on your SL.
⸻
🧠 Trade Logic Summary
• Bias: Bearish
• Entry: Short within the 23,463.25 – 23,608.25 zone (watch for rejection wicks / internal breakdown on LTF).
• Confirmation: Price reaction or reversal pattern in the zone (e.g., bearish engulfing, LTF BOS).
• TP: 22,800 region (just above the previous demand zone)
• SL: Just above 23,608.25 to invalidate the idea.
⸻
✅ Strengths
• Clear market structure shift
• Volume Profile confirmation
• Defined RR with institutional-style entry
• Good use of supply zone logic (not chasing entries)
⸻
⚠️ Things to Monitor
• If price closes above 23,608, setup invalidates and you may be looking at a liquidity grab and continuation to 23,800+
• Watch for bullish absorption in your entry zone. That would be a red flag.
• NFP / FOMC or any other scheduled macro events? Check the calendar before execution.
