Will Gold Make a New High Amid Prospect of Sep Fed Rate Cut?Fundamental approach:
- Gold gained this week, supported by renewed trade tensions following new US tariffs on major partners and rising expectations of a Fed rate cut in Sep.
- Safe-haven demand strengthened after weak US NFP data heightened concerns about economic growth and reinforced market bets on monetary easing, while US President Trump's tariff announcements drove risk aversion.
- Comments from Fed officials signaled openness to policy adjustments, keeping investors focused on future rate moves even as the US dollar softened and global equities stabilized.
- XAUUSD could remain resilient if upcoming US labor and inflation data continue to disappoint.
Technical approach:
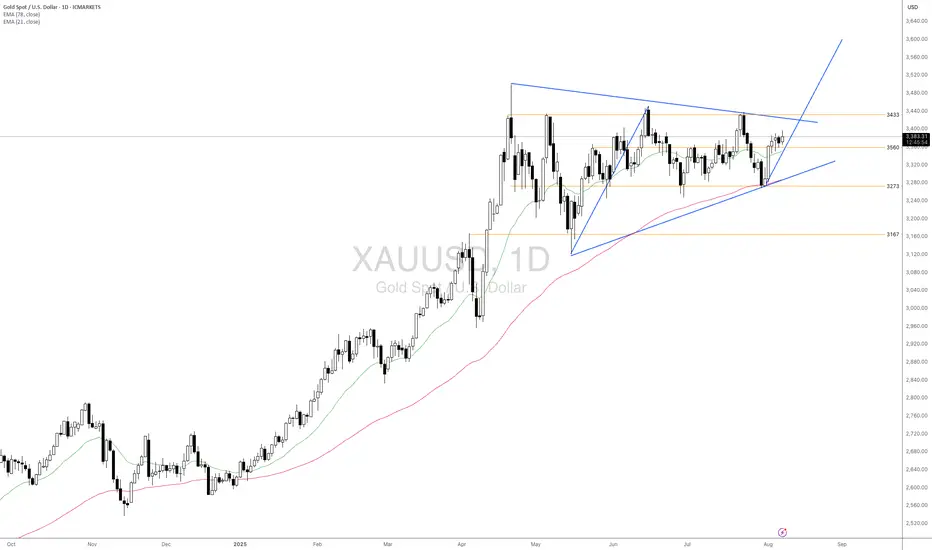
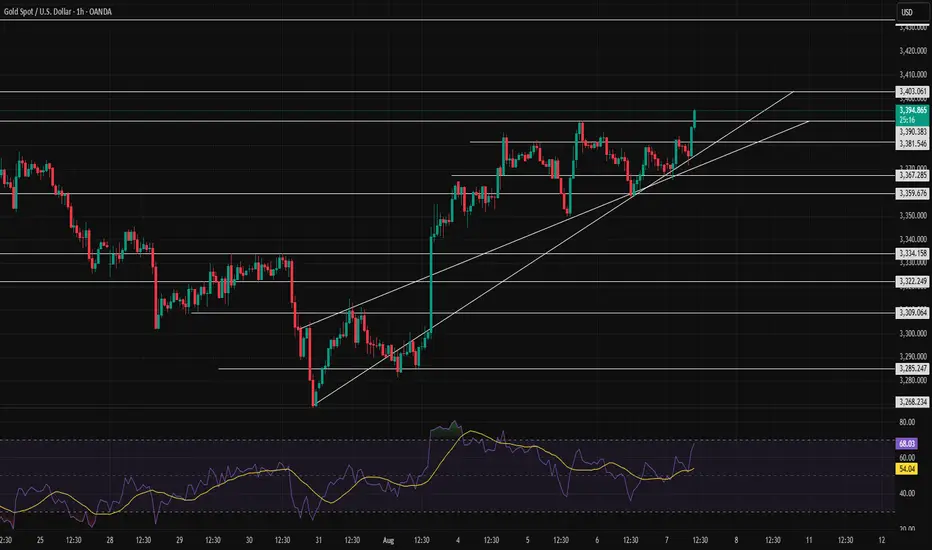
- XAUUSD fluctuates within a broad range. The price is forming a big Triangle Formation, awaiting an apparent breakout to determine the next movement.
- If XAUUSD breaches above the Triangle Pattern and the resistance at 3433, the price may continue to advance with the measured target at 3600.
- On the contrary, closing below support at 3560 may prompt XAUUSD to continue range-bound movement by retesting support at 3273.
Analysis by: Dat Tong, Senior Financial Markets Strategist at Exness
Futures market
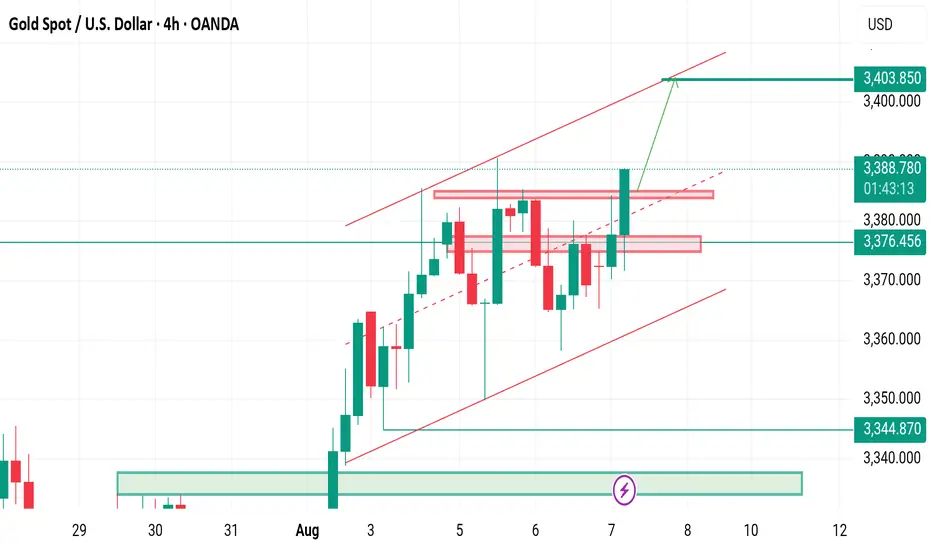
The bullish trend remains unchanged, seize the opportunityAfter today's opening, gold continued the bullish trend of yesterday. Judging from the daily line, gold has continued to rise, and it may only be a matter of time before it reaches a higher level. Judging from the 4H chart, the technical indicators are dead cross and shrinking, and the flexible indicators are repairing upward. The short-term middle track support is around 3372, and the upper side pays attention to the short-term pressure of 3395-3405. If the European session fails to effectively break through the short-term resistance, it will give the opportunity to test the 3380-3370 support again. If it is not broken, you can consider continuing to go long.
OANDA:XAUUSD

possible Alternative roadmap for goldrecent highs breached. look to hold gains and for entry on pullbacks. seems higher wave 5 unfolding - is the corrective structure over? keep options open.

XAUUSD - 4/8/25Theres alot happening that is influencing Gold. But just following the market structure, we see a HTF BoS towards more bearish action. However friday's news did bring a big push up with huge imbalance in the Dollar as well as Gold.
I identified the zone that broke structure above and looking for price to touch this zone before going back down to take out any imbalance. t
The current TP is quite way down at the moment targeting the HTF equal low liquidity, but I will trail my SL.
if this Zone that broke structure is taken out then my bias will shift to bullish trades to retest the ATH.

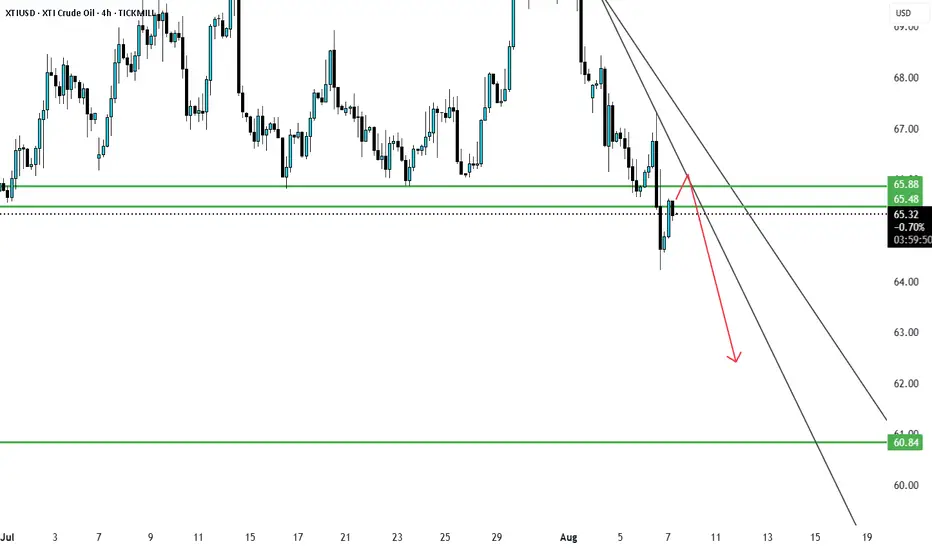
XTIUSD Broken Major support and retesting currentlyXTI/USD has broken a major support level and is currently retesting it. The price is expected to resume its downward movement toward the next support zone. Upcoming news tomorrow may influence the market, so please trade with caution.
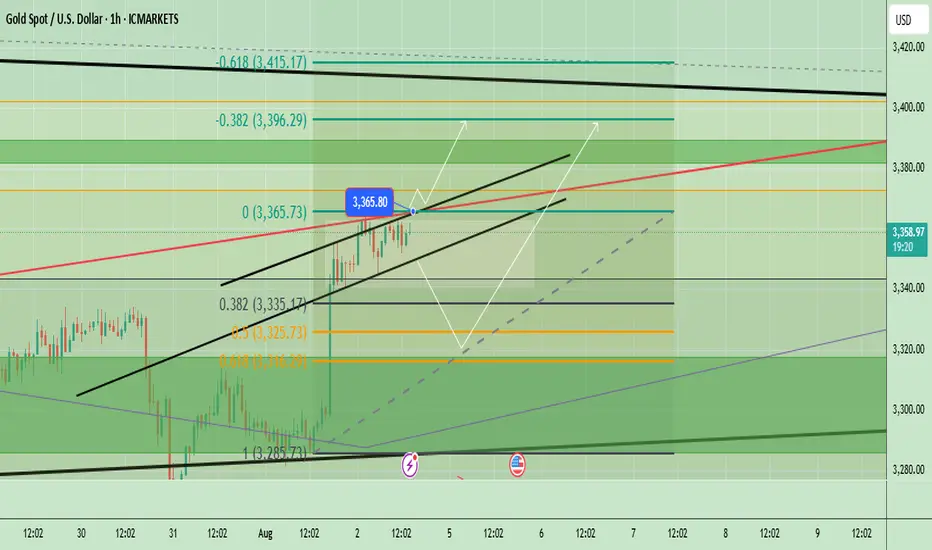
Gold Technical Analysis - Testing Key ResistanceGold has been showing a short-term bullish momentum after bouncing from the 3285 support zone, forming an ascending channel visible on the chart. The price is currently trading near 3361, close to the upper boundary of the channel and a key horizontal resistance level at 3365–3370. If the bullish momentum continues and price breaks above 3365–3370, we could see further upside toward 3396 and potentially 3400+. However, a failure to hold above this level could trigger a short-term retracement toward 3335–3325 support.
📈 Potential Scenarios:
- Bullish: If price sustains above $3,365, we could see an upside push toward $3,396 and possibly higher to $3,410 resistance.
- Bearish: A rejection near the channel top or $3,365 may lead to a pullback toward $3,325 (Fib 0.5) and then $3,285 support.
🔑 Key levels to watch:
- Upside: $3,365 → $3,396 → $3,410
- Downside: $3,335 → $3,325 → $3,285
- Trend Bias: Short-term bullish as long as price stays above 3325
Note
Please risk management in trading is a Key so use your money accordingly. If you like the idea then please like and boost. Thank you and Good Luck!
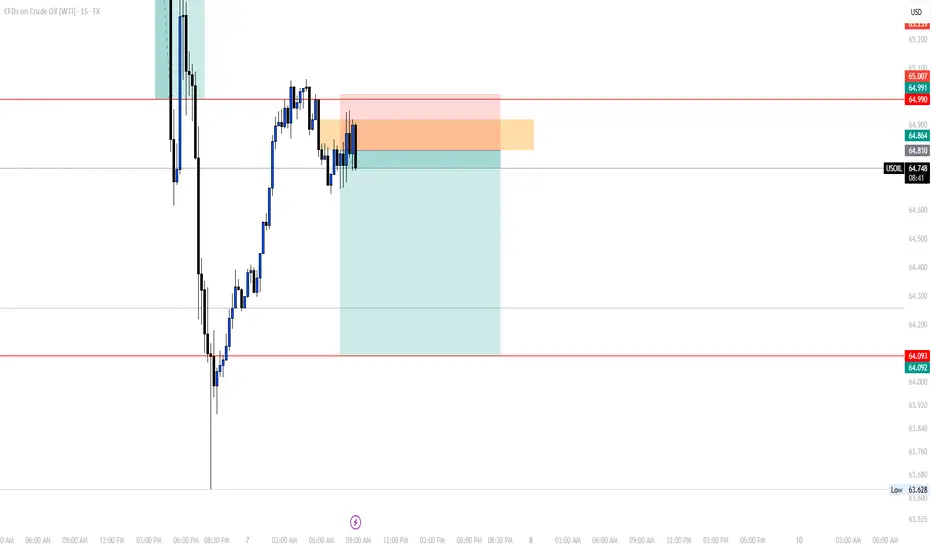
SELL USOILThis morning we're going short again on OIL, since as you can see the price grabbed the LQ and gave us a proper rntry point we entered based on 1h ago.
Follow for more!
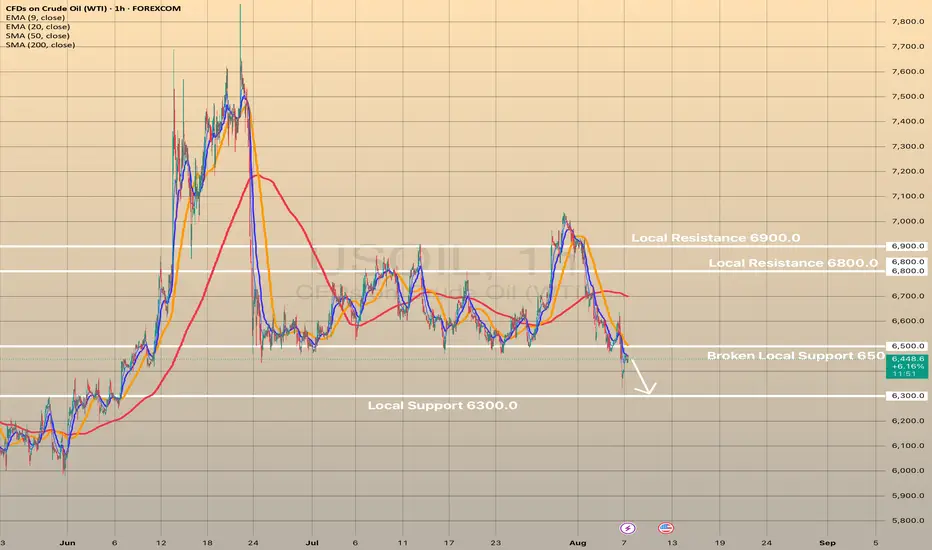
USOIL declines on possibility of geopolitical stabilityUSOIL declines on possibility of geopolitical stability
Crude oil and gasoline prices fell August 6 after an early rally, as Trump announced "great progress" in U.S.-Russia talks to end the Ukraine war, reducing fears of new sanctions on Russian energy exports. Additionally, OPEC+’s planned 547,000 bpd production increase for September further pressured prices amid concerns of a global oil supply glut.
Technically, USOIL broke crucial local support at 6,500.00. Currently, the price is retesting this level. The decline towards 6,300.00 is expected in short-term.
We are about to go bearish on xauusd few minutes for gold to sell...🤏
We are still going for (Fvg) before we go down 👇

Bullish Momentum Builds: Gold Set to Challenge 3400 and BeyondAlthough gold encountered resistance again near 3385 in the short term, the retracement has not been effectively continued so far, and the downward momentum is not particularly strong. Gold has always remained above the 3375-3365 area, with strong buying support below and the market bearish sentiment is not serious. In comparison, the bulls still have a considerable advantage!
The current gold price structure clearly maintains a strong bullish trend. With gold reclaiming the 3375-3365 area yesterday, bullish sentiment has further strengthened. As gold's center of gravity shifts upward, multiple strong support areas have formed below, limiting any potential pullbacks and further supporting its upward trajectory. Therefore, as long as gold can maintain above the 3375-3365 area, I believe that gold will definitely refresh the short-term high of 3390 again, and is expected to launch a strong impact on the 3400 mark, and may even continue to the 3420-3430 area.
So for short-term trading, I don’t have much desire to short gold for the time being. I am happy to watch for opportunities to enter long positions after gold retreats to the 3375-3365 area!
Gold you now totaly buy trend for next 3 to 5 days Gold you now totaly buy trend for next 3 to 5 days
If you want learn more fell free contrect me .

GOLD TRADE ANALYSIS – MISSED ENTRY & NEW OUTLOOK📈 GOLD TRADE ANALYSIS – MISSED ENTRY & NEW OUTLOOK 💡
07 August 2025 | XAUUSD | 15m TF
In the recent price action on Gold, I spotted a clean mSS (market structure shift) confirming bearish intent after liquidity sweep. Unfortunately, my first ideal entry near the supply zone was missed as price barely tapped the POI before delivering a significant drop.
However, the market offered a second chance — forming another bearish order block before diving into the discounted zone (demand area). This ultimately led to a strong bullish reaction, confirming accumulation and paving way for the rally we've just seen.
🔍 Current Expectation:
Price has now cleared internal liquidity and is pushing toward $3,396 — an important external liquidity level. I'm watching for:
A possible reaction/rejection from this high
Or a clean break and retest for continuation to $3,410+
🧠 Lesson:
Always remember, missed entries are part of the game. The key is not chasing — but re-aligning with the structure and waiting for fresh confirmations. Gold continues to respect key imbalances and reacts well around session opens.
📊 Let’s see how price reacts around this high. Any signs of weakness could offer a new intraday short opportunity.
#XAUUSD #GoldAnalysis #SmartMoneyConcepts #OrderBlocks #MarketStructure #ForexTrading #LiquiditySweep #TradingPsychology #RiskManagement #PriceAction #ForexNigeria #GoldTraders #FXSetup

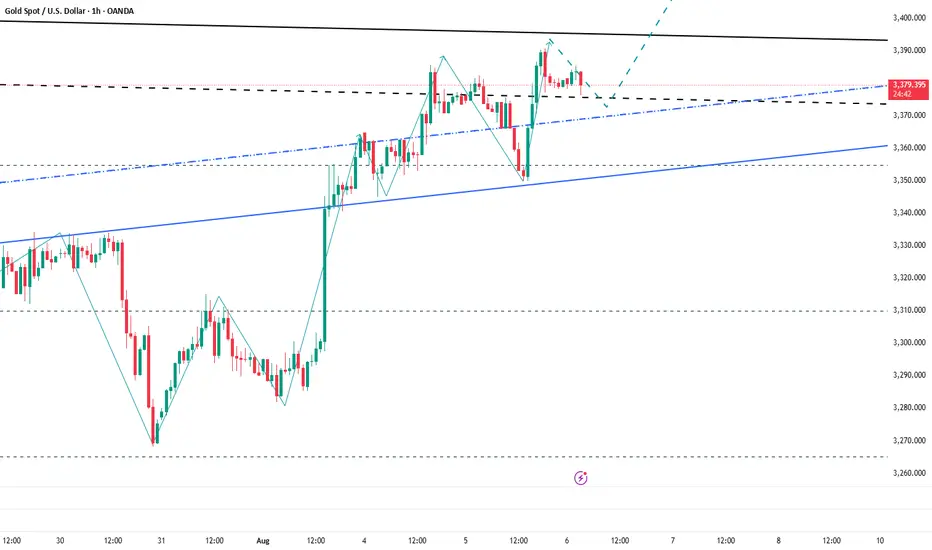
XAUUSD rises due to tariff wars and weak economic dataXAUUSD rises due to tariff wars and weak economic data
Gold climbed to 3,380.00 level on August 7, hitting a two-week high, as renewed U.S. tariff threats and expectations of Federal Reserve rate cuts in September and December boosted its appeal. President Trump announced 100% tariffs on imported semiconductors (excluding U.S.-made), 25% on Indian imports, and 50% on select Brazilian goods. Additionally, Weak U.S. economic data and a cooling labor market further support gold’s rise.
Technically, price has formed the Pennant chart pattern right below the local resistance of 3,380.00. Further breakout of the level and ascending towards 3,440.00 level is expected in short-term.

Gold 15-Min Breakout: Eyes on M30 Supply Zone & FVG RetestPrice is currently approaching a key M30 Supply Zone after a strong bullish impulse from the ascending trendline support.
🔹 Key Observations:
The price broke above a previous short-term resistance zone and is now retesting the Fair Value Gap (FVG) area marked in pink.
The 200 EMA acted as dynamic support, further fueling bullish momentum.
Structure shows a series of higher lows, confirming buyers in control on intraday timeframes.
🔹 Potential Scenarios:
✅ Bullish Continuation:
If the price respects the FVG as demand and forms bullish confirmation, continuation toward the M30 Supply Zone and the 3,399–3,400 region is likely.
⚠️ Pullback Risk:
A deeper retracement below FVG could retest the trendline or the 3,371 support near the 200 EMA before any further upside.
🔹 Trade Plan:
Watching for price action reaction inside the FVG. A clean rejection could offer entries targeting the upper supply zone.

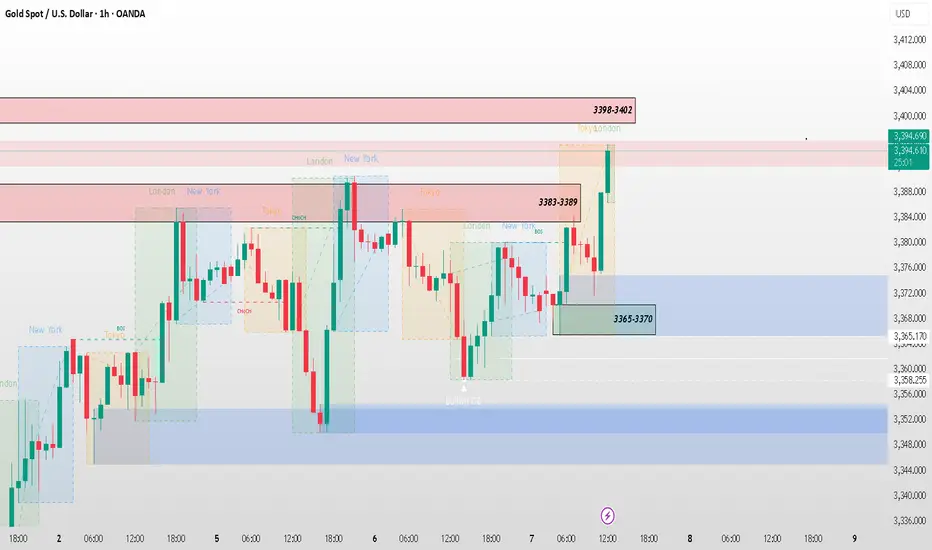
XAU/USD – Smart Money Update (1H)📉 XAU/USD – Smart Money Update (1H)
🔍 Current Structure: Price tapped into 3365–3370 demand and broke above the 3383–3389 supply zone.
🟩 Key Zones:
✅ Intraday Demand: 3365–3370 (recent reaction zone)
🟩 Major Demand: 3344–3354 – deeper support if price retraces
🔼 Next Resistance: 3398–3402
🧠 Smart Money Insight:
Price respected the 3365–3370 demand after taking liquidity and swept above the minor supply (3383–3389). If price holds above 3383, bullish momentum likely toward 3398–3402.
⚠️ Watch for:
Bullish continuation above 3398 for extended upside
Bearish rejection at 3398–3402 if supply kicks in
#XAUUSD #SmartMoney #ForexStrategy #OrderFlow #FXFOREVER #GoldAnalysis #LiquidityZones
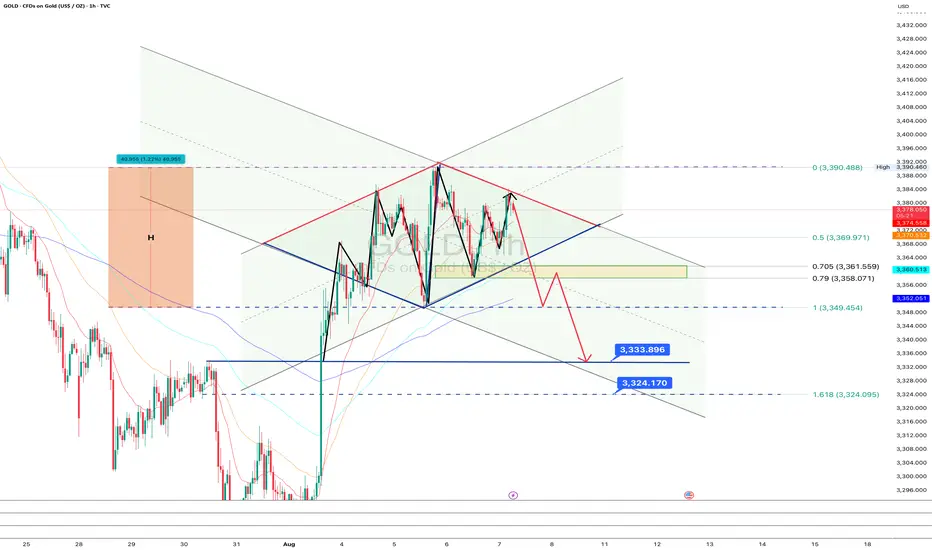
3403 is the decision pointAfter the reaction to the price we mentioned, it will become clear whether the price can reach 3432 or not.
GOLD: The diamond hasn’t sparkled yet - waiting for confirmationOn the 1-hour chart of gold, a diamond pattern is forming at the top of an ascending channel. The current price is 3378, and the asset remains within the structure, without confirming a reversal yet. The key area is the 0.705–0.79 Fibo zone (3361.5–3358), which aligns with the lower boundary of the diamond. At this stage, the pattern is not complete — there's no break of the base, so the move is still pending.
Technically , the market is showing signs of momentum fading and a possible transition into a correction, but it's too early to call it without a clear break and close below 3361, which represents the lower edge of the diamond. If the bearish scenario plays out, the next targets are 3333 and 3324, projected from the pattern itself.
Fundamentally , the picture remains mixed: the dollar has stabilized temporarily, and expectations around U.S. interest rates continue to create uncertainty. Gold is reacting to all of this, but without a clear macro trigger, the upside may remain limited.
Tactical plan: Watch how price behaves in the 3361.5–3358 zone. If a reversal pattern forms, followed by a break to the downside, a short opportunity may open after a retest.- with targets at 3333 and 3324. If that break doesn't happen, and price moves higher, the diamond structure breaks to the upside, and the bearish scenario is invalidated.
As they say until the base breaks, it’s just a shiny piece of the chart, not a diamond. Watch closely, act on confirmation, not assumptions.
Gold fluctuates repeatedly. How can we avoid detours?Gold currently lacks sustained bullish momentum. The monthly chart has formed four consecutive upper shadows, indicating significant market pressure at high levels. Bulls are hesitant to take risks and lack the appetite for aggressive action, leading to a typical volatile pattern of rapid rises and equally rapid declines in gold prices. Yesterday's price action further confirmed this pattern. Although gold prices briefly reached a new high after bottoming out and rebounding, they were unable to consolidate above that level and subsequently retreated rapidly. Currently, the 3380-3390 area has become a key short-term resistance level, but repeated attempts to retest it have led to heavy selling pressure. Meanwhile, the 3370 area, a trading-intensive zone, poses significant downside risks for gold if it breaks below it, potentially extending the range to 3355-3340. Technically, resistance is concentrated in the 3380-3390 area, while support lies at 3355-3340. Short-term volatility is largely locked within this range. We recommend maintaining a volatile strategy of buying high and selling low.
Regarding trading strategies, we recommend placing short positions in batches within the 3375-3390 area, targeting 3360-3345. Pay attention to position control and stop-loss settings during this process. If the price rebounds to the support area and stabilizes, consider short-term long positions to flexibly respond to the intraday rhythm.
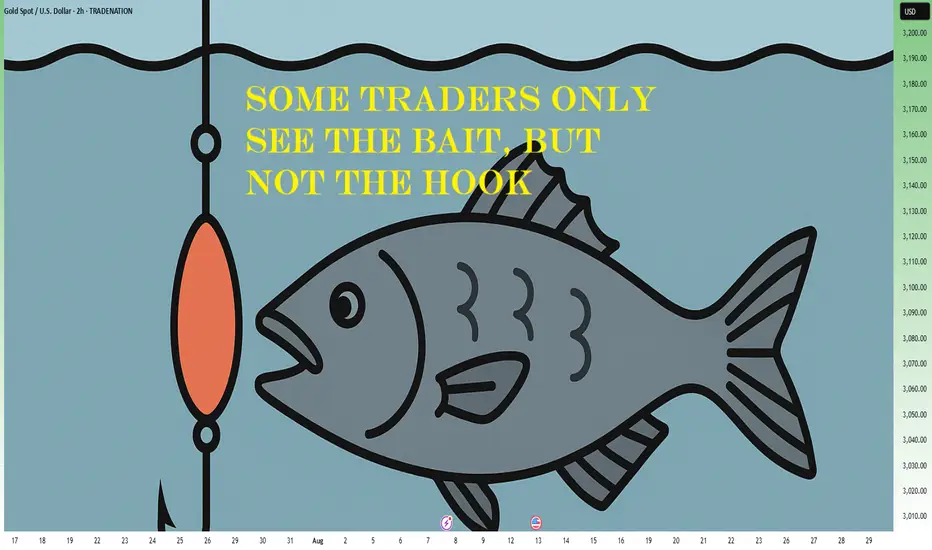
Some Traders Only See The Bait, But Not The HookLet’s get one thing straight: if you seriously think you’ve discovered a “secret” setup that you saw in a YouTube video with 1 million views, and it’s right there on the chart – clean, centered, elegant – congrats. You’re already on the hook.
Welcome. You’re liquidity.
🧼 “Clean breakout” = dig your own grave, enthusiastically
It’s honestly beautiful how thousands of traders see the same “clean breakout,” the same “double bottom,” the same “bullish engulfing,” and all believe they’re geniuses. They enter confidently, with a “perfect oversold” RSI, a “confirmed” MACD, and maybe even the moon in Capricorn.
Then, of course, the market spits their orders back in their face at 300 km/h.
Standard response? “It was manipulation.”
No, bro. It was bait. You were the fish. You bit. The market says thank you for your participation and moves on.
🧠 If you see what everyone else sees, it’s useless
What most don’t get is this: if a setup looks “too clean,” it will most probably not work. If you see it, everyone sees it. If everyone thinks something is “about to explode,” that means it’s being used – to attract orders. Your money. Your emotions. Exactly what bigger players need to exit, gracefully – on your dime.
The market is like an exclusive party: if you found out about it, it’s already lame.
💅 That warm feeling of “certainty”? Yeah, you’re screwed
The irony? The moments when a trader feels most certain are exactly the moments when they’re most exposed. The market wants you to feel relaxed. Wants you to think “this is the one.” It’s like a drug dealer giving you your first hit for free, with a smile. Not because he likes you, but because he knows you’re hooked.
So when you feel “sure” – check your mouth. You might already be on the hook.
🤡 “But it was an A+ setup!”
Of course it was. The A+ setup – seen, tested, recycled, and re-sold thousands of times. The one that works great in textbooks, backtests, webinars, and in the wet dreams of those who think they just need “a perfect strategy”.
But the market isn’t here to validate your setup. It’s here to take your money. From whom? From those who still think it’s a “fair game.”
Spoiler: it’s not.
🤔 If you’re gonna bite, at least ask: who’s holding the line?
Look at any “clear opportunity” and ask the magic question:
“Who benefits from what I’m seeing right now?”
If the answer is “me ” – you’re in trouble.
If you don’t know – you’re in even more trouble.
The market is full of traps dressed up as opportunities. Hooks that move slowly, with sexy candles, to lure in the kind of trader who only learned the “buy low, sell high” part – but skipped the chapter on “ don’t bite every shiny thing you see. ”
🎬 Bottom line:
The market doesn’t try to fool you. You’re already doing that yourself.
The market doesn’t need complex tricks. All it needs is people in a hurry, easy to excite, who never ask the right questions. Who see a green candle and think, “This is it.”
Who don’t bother looking for the hook because they’re too busy dreaming about the profits.
If you want to trade seriously, it’s simple:
Don’t ask “Where do I enter?”
Ask: “Where do they want me to enter?”
And if you’re already there… run.
🧭 Alright, now seriously
( I mean, I tried to be funny above – but let’s get real for a second )
Let’s look at a few concrete recent examples from the market:
📉 EUR/USD
On Monday, I mentioned that price was testing resistance and could offer a nice selling opportunity.
But… I changed my mind. (You know... dynamic probabilities )
The pattern was way too clean, too clear, too pretty.
And of course, price broke above.
Because if it looks too obvious – it’s probably already bait.
🟡 XAU/USD (Gold)
Since yesterday, I’ve been talking about the potential for an upside breakout.
Why?
Because 3380–3385 resistance zone is way too clean.
Everyone sees it. Everyone talks about it. Everyone sells there.
Which makes me ask: if everyone’s expecting a drop… isn’t that, once again, just bait?
Here is my Gold analysis from today:
BTC/USD
We all see the confluence of support. The perfect alignment. The setup that screams “Buy me.”
But what if it’s too perfect to be true?
What if it’s just another classic trap – the kind that gets everyone excited before the drop comes.
💡 Now don’t get me wrong – this isn’t about abandoning technical analysis.
Far from it. For me, it’s essential.
But we’ve got to use it differently.
✅ Not as a treasure map
❌ But as a battlefield map showing us where the traps are laid
So maybe… don’t bite like a lizard the second something shiny pops up on your chart.
Instead, ask yourself:
“Does this make sense… or does it make too much sense? ”
Because in trading, when something looks too clean – that’s exactly when it gets dirty.
Disclosure: I am part of TradeNation's Influencer program and receive a monthly fee for using their TradingView charts in my analyses and educational articles.
Gold Analysis: Chances of Bouncing BackNow Gold is at its critical Point, it requires very high volume to break this level, if it failed than there is a good opportunity to sell the Gold short

LNG Outlook: Supply-Demand Differential Dropped Below the MedianThis analysis was prepared by Dr. Igor Isaev in cooperation with Anastasia Volkova, LSE analyst.
Current prices vs. price spread 10 days before expiration by month since 2010
(The top left graph)
Contract U is trading at the same level as the average price 10 days before expiration for all expired contracts over the previous 15 years. The futures prices of the Fall 2025 contracts are trading even closer to the median values on the expiration date, while remaining within the interquartile range. Prices of the 2026 and 2027 Winter contracts are declining but have not yet broken through the upper quartile values.
Current forward curve vs. 2020-2024
(The top graph in the middle)
Although the 3-year delivery contract prices as of 2025 have approached the levels of similar 2023 and 2024 contracts, a pronounced forward curve skew remains in the near-term (1-2 years) and distant (5-6 years) delivery segments.
Current inventory and forecast for next week compared to 2019-2024
(The top right graph)
For week 31 (July 28 —August 03), we expect a +16 BCF gain in storage. The fill rate is confidently holding above the median for the preceding 5 years. Injection rates maintain positive dynamics. If the current supply and demand balance stabilizes, reaching levels similar to 2024 peak values is possible. The weather and seasonal phenomena of late summer — early fall remain a restraining factor.
Weekly HDD+CDD total from current NOAA data and forecast for the next two weeks comparing 1994-2024
(The lower left graph)
In the current, 32nd week, the weather is holding steady, reflecting the average values from observations over the past 30 years. Although the seasonal peak HDD+CDD has almost passed, next week (33) is forecast to have significantly above average HDD+CDD values.
Explanation of the chart: candles represent quantiles for 30 years from 1994 to 2024. Red dots 2024, green 2025, blue prediction 2025.
Weekly HDD+CDD total from current NOAA data and forecast for the next two weeks compared to 1994-2024 by region
(The lower graph in the middle)
Looking by region, we see elevated HDD+CDD at week 33 in almost all regions.
Weekly cumulative supply/demand differentials compared to 2014-2024
(The lower right graph)
In the current 32nd week, the supply-demand differential has fallen below the median, almost to the edge of the lower interquartile range. On the demand side, we see a strong decline in consumption by power generation and a recovery in LNG exports. On the supply side, production continues to grow, but imports from Canada have dropped.

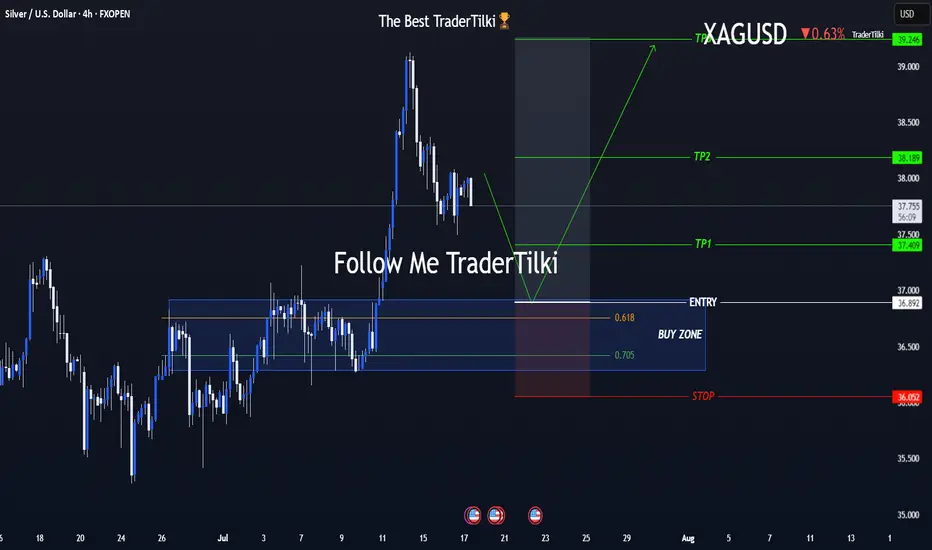
One Shot, Clear Strategy – Silver Buy Zone in SightHey everyone 👋
📌 BUY LIMIT ORDER / XAGUSD-SILVER Key Levels
🟢 Entry: 36,892
🎯 Target 1: 37,409
🎯 Target 2: 38,189
🎯 Target 3: 39,246
🔴 Stop: 36,052
📈 Risk/Reward Ratio: 2,79
I double-checked the levels and put together a clean, focused analysis just for you. Every single like seriously boosts my motivation to keep sharing 📈 Your support means the world to me! Huge thanks to everyone who likes and backs this work 💙 Our goals are crystal clear, our strategy is solid. Let’s keep moving forward with confidence and smart execution!
XAUUSD on swing high 3402-3410 mark M30-H1 TIMEFRAME SETUP
Currently we have range of 3370-3385 area although if H4 closed above 3385 gold will on bullish Bias till 3405-3410.
What possible scenarios we have ?
• Market has to gives closing of H4 above 3382-3385 ,also I'm on holding buy trade near 3382 and my Targets are 3402-3410.
• secondly If gold drops to my Buying area where I will buy XAUUSD in dips and my optimal target will be 3402-3410.
Additional Tip:
Market is on bullish Bias ,above 3385 no sell Trade .
Below 3375-3378 not buy till 3345.