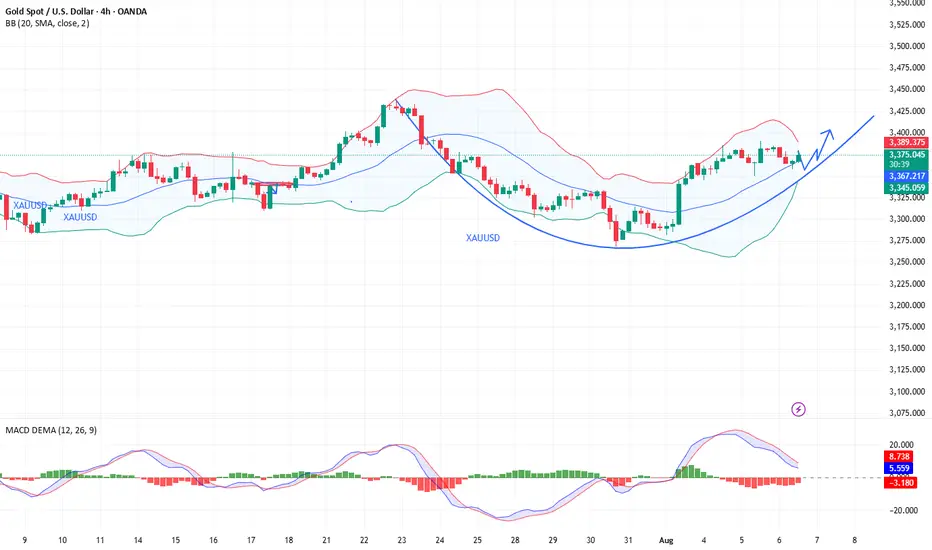
Gold Price Trend Analysis and Trading Guidance (Exclusive)📣📣📣A technical analysis of gold's recent performance reveals that it has formed a four-day winning streak, demonstrating the strength of the upward trend and indicating that short-term upside potential has not yet been exhausted. Of note, the upper Bollinger Band at 3430 on the daily chart is acting as a key resistance level, and this level is likely to be tested this week. However, when it comes to a sharp rise in the market, there is no clear signal at present. We need to wait for the opening pattern of the daily Bollinger band to be confirmed before we can open up a new round of upward space.🧐🧐🧐🤔🤔🤔
Switching to the H4 cycle for observation, the unilateral upward trend continues to consolidate, the moving average system shows a perfect upward divergent arrangement, the Bollinger Bands simultaneously maintain an open state, and a short-term high pressure is formed near the upper rail of 3415. Based on this, the bullish logic for gold remains unchanged on Wednesday, with the intraday high range likely to be between 3415 and 3430. There's no need to overestimate whether the price will break through previous highs at this point, and trading strategies should be adjusted dynamically based on real-time market performance. From a short-term perspective, intraday support should focus on two key levels: 3360 and 3350.
👊👊👊On the operational level, it is recommended to adopt a strategy of placing long orders in batches when the price falls back to the 3365-3360 range, relying on the support level to seize the opportunity of trend continuation.⭐️⭐️⭐️
⚠️⚠️⚠️The market is risky, so participate rationally. If you need real-time trading references and trading advice, please leave a message to Charlie.🛫🛫🛫 FOREXCOM:XAUUSD VELOCITY:GOLD PEPPERSTONE:XAUUSD CMCMARKETS:GOLD ICMARKETS:XAUUSD CMCMARKETS:GOLD FXOPEN:XAUUSD
Futures market
Gold May Correct Short-TermMarket Overview:
• Gold trading around $3,366–3,371 USD/oz, easing from two-week highs.
• Pressure from firmer US yields and USD recovery.
• Weak US jobs data boosted Fed rate cut expectations to ~90%.
• Still supported by global economic/political uncertainties and safe haven demand.
Technical Analysis:
• Resistance: ~$3,385–3,390, near psychological $3,400.
• Support: ~$3,345–3,350; break could target ~$3,310.
• Trading above EMA50, EMA9 direction still bullish short-term.
• RSI and MACD momentum fading; July monthly candle formed bearish “shooting star” near $3,431—invalidated only if price closes above that level.
Outlook
Gold may dip if USD and yields recover; but may rally if macro data deteriorate further. The $3,385–3,390 zone is pivotal.
Trading Strategy:
• Sell 3,392–3,395
TP ~40/80/200 pips
SL ~3,397
• Buy 3,345–3,348
TP ~40/80/200 pips
SL ~3,342

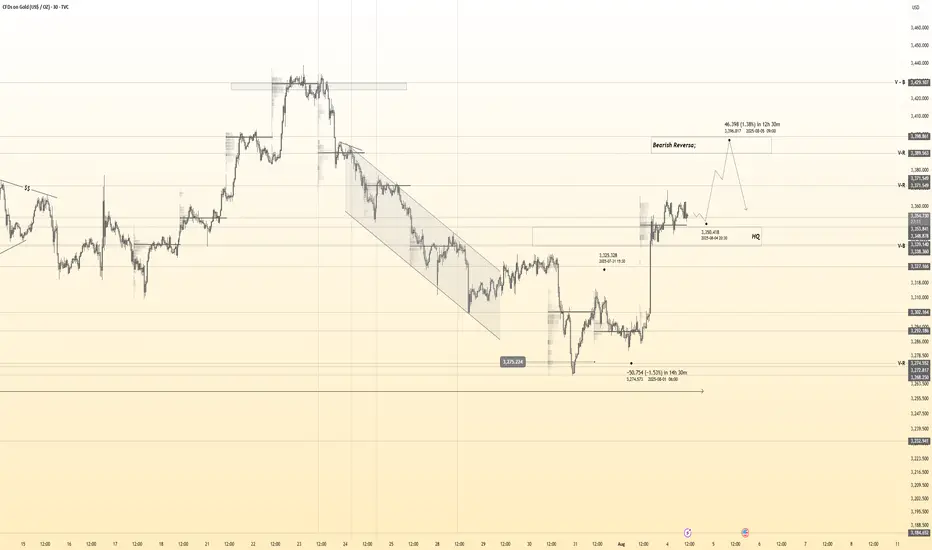
A look at multiple markets Eight six 25 that I looked at about 4 or 5 markets today including gold and a few other markets. I focused on 1.272 extensions which are very effective and getting you out of the market before you lose your profits. I talked a little bit about a stop in reverse approach to the market which can be very profitable. I also talked about taking profits when you're long on the market because you know there's going to be a correction..... And then getting back into the market to trade it higher..... This is a little bit different than stop in reverse. Years ago I tried to trade stop and reverse Trading but I did not do well at all with it and I didn't understand why this was until years later.

XAU / USD 2 Hour ChartHello traders. Taking a look at the spot gold 2 hour chart, we are coming up to an area of interest for me, which is marked on the chart. For now I am just watching the 2 hour, the 4 hour and the 30 minutes candles. We have the unemployment claims tomorrow here in the US, so today I am mostly observing, although I can see the potential quick scalp trade set ups for either direction. Let's see how things play out over the next hour or so. Big G gets my thanks. Be well and trade the trend. Just an FYI, I don't do a lot of technical analysis charts, using the Fib, or wave theory, etc. I day trade, so for me, the charts I put up are based on price action, what is happening at the time of the chart being posted. Things can change in a minute in the market, so analysis put on Tradingview are valid for only so long. Thanks so much. Be well and trade the trend.

Gold Price Analysis August 6In the Tokyo session this morning, gold recorded some selling pressure after strong buying pressure in the US session yesterday promoted profit-taking sentiment. It is expected that prices may continue to correct during the Asia-Europe session today before potential buying pressure returns in the London session.
Trading plan:
Scalping SELL: 3375
Support zone to watch for BUY: 3346 – 3333 – 3315 (priority when there is a clear price rejection signal)
Upside target: 3420

Gold Bullish intradayOverall bias is bullish on gold for today . im looking at price to break out of this wedge and either retest the zone where there was volume or it may just shoot up . im already in the trade but this could ne another entry up with stop loss a few pips as buffer beneath the zone .

Prices are suppressed. Will they rise amidst volatility?Information Summary:
Trump's upcoming appointment of Federal Reserve officials has the market on the sidelines, leading to a pullback in gold prices, but bullish sentiment remains.
Quaid believes that most investors are closely watching the White House's upcoming Federal Reserve appointments and any trade-related news, which could have a significant impact on market sentiment.
Furthermore, market expectations for a September rate cut are high. After last week's weak jobs report, investors are pricing in an 87% chance of a September rate cut, according to the CME FedWatch tool. Following the release of the report, Trump fired the director of the Bureau of Labor Statistics, further exacerbating policy uncertainty.
As a traditional safe-haven asset, gold generally performs better in environments with increased political and economic uncertainty and low interest rates.
Market Analysis:
Gold prices retreated slightly on Wednesday, but Quaid believes there is still room for further gains, with a short-term target of 3,400. Supporting factors include: continued tariff friction; slowing economic growth and inflation concerns; and a weak US dollar.
Looking at the hourly chart, the Fibonacci 0.382 position is right around 3380. Moreover, the top of the trend line of gold's bottoming rebound is also at this position, so if the pressure of 3380 cannot be broken through, we need to be alert to the possibility of a pullback.
Next, keep an eye on 3360. If gold can't break through 3380, it may consolidate between 3360 and 3380.
If bears continue to push down the price below 3360, a test of 3340 is possible.
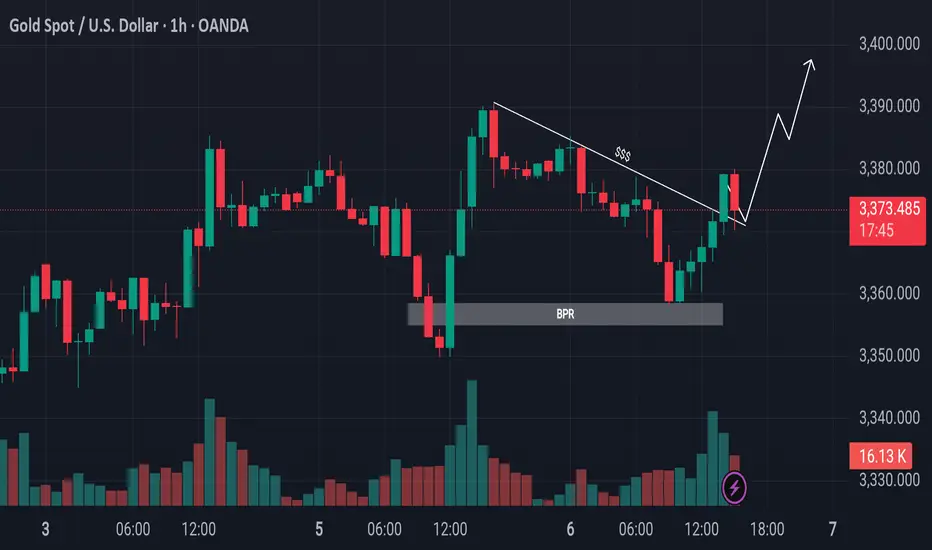
Gold Retraces to OTE and Breaks ResistanceEyes on Swing Highs!Gold Market Update
The gold market declined from its previous bullish leg and retraced below the 50% level, reaching into the Optimal Trade Entry (OTE) zone. It also tapped into a Bullish Price Rejection (BPR) area. Following that, price broke above the trendline resistance. Currently, it is advisable to wait for a potential retest of the breakout level. If confirmed, the market could continue its upward movement toward the previous swing highs.
Do Your Own Research (DYOR)
Will Gold Break Out on Tariff and Fed UncertaintyGold’s price action is currently fluctuating above the trendline connecting higher lows from May 2025, potentially aiming for the trendline from December 2024, which aligns with the 2025 peak at 3,500.
A firm hold above the 3,400 and 3,450 levels could accelerate a move back toward the 3,500-record, with potential for further gains toward new highs at 3,780 and 4,000, respectively.
On the downside, a close below 3,340 may lead to a pullback to 3,280 for a possible rebound, or even a deeper retracement toward 3,230 and 3,130.

Technical Analysis | Gold (XAU/USD) | 4-Hour Timeframe Technical Analysis | Gold (XAU/USD) | 4-Hour Timeframe
Currently, the price is trading below a significant resistance zone that has previously triggered strong reactions. In the current scenario, if the mid-support zone (the red midline) is broken, we could expect a further correction toward the lower boundary of the same range.
However, if a strong bullish candle forms and a valid entry trigger appears near this support zone, there's potential for a price rebound, possibly leading to a move back toward the resistance levels and even the top of the channel.
📍 Key Levels:
Major Resistance: Red zone around 3390
Mid-Support: Around 3370
Lower Support: Around 3350
📈 Scenarios:
Resistance Breakout: Potential move toward previous high near 3410
Mid-Support Break: Correction toward the green zone, with a possible bullish reversal if a trigger is confirmed

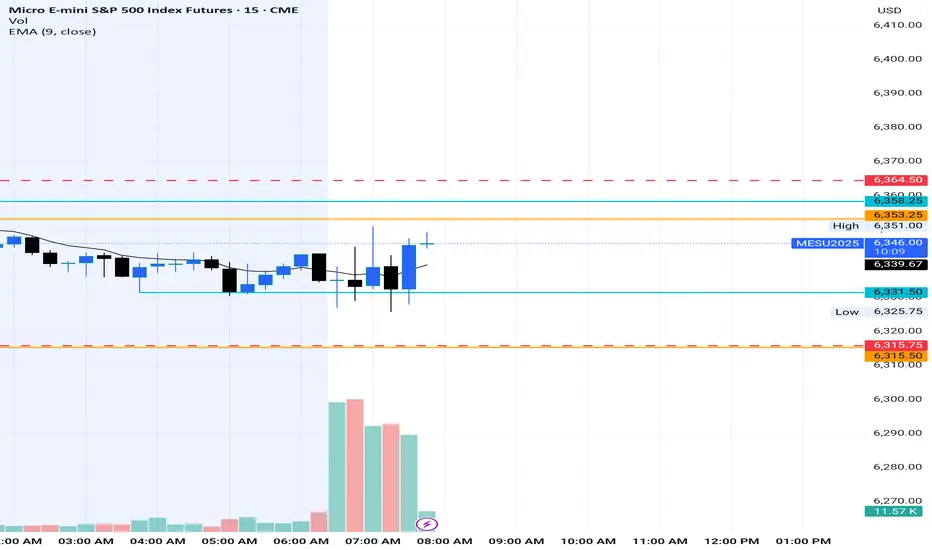
XAUUSD 4H Overview 8/6/25Price is ranging currently so I'm looking for buys in the latest buy area but a break above $3,385 could signal continuation to $3,400+

Gold 30Min Engaged ( Bullish & Bearish Entry Detected )Time Frame: 30-Minute Warfare
Entry Protocol: Only after volume-verified breakout
🩸Bullish From now Price - 3354
🩸Bearish Reversal : 3400
➗ Hanzo Protocol: Volume-Tiered Entry Authority
➕ Zone Activated: Dynamic market pressure detected.
The level isn’t just price — it’s a memory of where they moved size.
Volume is rising beneath the surface — not noise, but preparation.
🔥 Tactical Note:
We wait for the energy signature — when volume betrays intention.
The trap gets set. The weak follow. We execute.
GOLD ROUTE MAP UPDATEHey Everyone,
Another great day in the markets with our chart idea playing out exactly as planned, allowing us to buy the dips.
We’re seeing a repeat of yesterday's setup, the 3392 gap remains open after the EMA5 lock above 3370. We're getting drops into the lower Goldturn zones, giving us great opportunities to buy back in.
As long as we don’t get a confirmed lock below 3348, we continue to chase the open gap above at 3392.
We will keep the above in mind when taking buys from dips. Our updated levels and weighted levels will allow us to track the movement down and then catch bounces up.
We will continue to buy dips using our support levels taking 20 to 40 pips. As stated before each of our level structures give 20 to 40 pip bounces, which is enough for a nice entry and exit. If you back test the levels we shared every week for the past 24 months, you can see how effectively they were used to trade with or against short/mid term swings and trends.
The swing range give bigger bounces then our weighted levels that's the difference between weighted levels and swing ranges.
BULLISH TARGET
3370 - DONE
EMA5 CROSS AND LOCK ABOVE 3370 WILL OPEN THE FOLLOWING BULLISH TARGETS
3392
EMA5 CROSS AND LOCK ABOVE 3392 WILL OPEN THE FOLLOWING BULLISH TARGET
3416
EMA5 CROSS AND LOCK ABOVE 3416 WILL OPEN THE FOLLOWING BULLISH TARGET
3429
EMA5 CROSS AND LOCK ABOVE 3429 WILL OPEN THE FOLLOWING BULLISH TARGET
3439
BEARISH TARGETS
3348
EMA5 CROSS AND LOCK BELOW 3348 WILL OPEN THE FOLLOWING BEARISH TARGET
3328
EMA5 CROSS AND LOCK BELOW 3328 WILL OPEN THE FOLLOWING BEARISH TARGET
3313
EMA5 CROSS AND LOCK BELOW 3313 WILL OPEN THE SWING RANGE
3296
3281
As always, we will keep you all updated with regular updates throughout the week and how we manage the active ideas and setups. Thank you all for your likes, comments and follows, we really appreciate it!
Mr Gold
GoldViewFX

XAUUSD – Bears Gave It a Shot, But Bulls Still in Control1. Quick recap of yesterday
In yesterday’s analysis, I highlighted the possibility of a short-term correction on Gold and noted that, although risky, a short trade could be justified. Acting on that conviction, I took a short with a sniper entry, capturing over 250 pips in floating profit. However, Gold found strong support around 3350 and reversed aggressively. I closed the trade with a more modest +140 pips gain.
2. Key development: NY session reversal
Despite early signs of weakness, the New York session flipped the script, sending Gold back toward the top of the daily range. The daily close near highs tells us one thing:
➡️ The bulls aren’t done just yet.
3. Technical outlook
• Resistance remains firm at 3375–3380+ zone
• A clear breakout above this zone opens the door for 3400+, with a likely magnet at 3430
• As long as the market holds above this week’s low, dips are buyable opportunities
4. Trading plan
For now, the bias shifts back to the long side. I’m watching for intraday dips to build longs, with invalidation below this week’s low. The structure favors continuation — but only if 3380 gives way we have confirmation.
5. Final thoughts
Gold may have teased the bears, but the real power still lies with the bulls. If momentum kicks in above 3380, we could be on our way to test 3430 soon. 🏹
Disclosure: I am part of TradeNation's Influencer program and receive a monthly fee for using their TradingView charts in my analyses and educational articles.

Sideways actionLots of cool between zones more apparent in the 5 minute time frame. No significant news. What are yalls thoughts? I was originally short but my ideal entry keeps teasing me and I took a dumb long. Should have been more patient on my end.
XAUUSD - ROAD OF THE MONEYHere are some guidelines of what could happen. This is purely technical analysis, which may be affected by any news, but it is currently aligning with the ongoing movement.
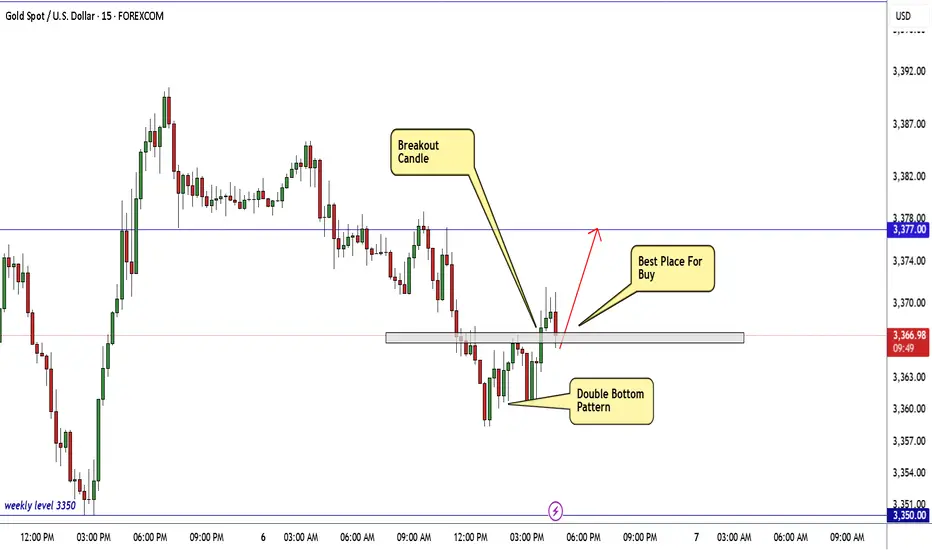
GOLD Ready To Go Up From Current Price , 150 Pips WaitingHere is My 15 Mins Gold Chart , and here is my opinion , we finally above 3365.00 and we have a 30 Mins Candle closure above it And Perfect Breakout , so we have a good confirmation now to can buy it and we can targeting 100 to 150 pips .
Reasons To Enter :
1- New Support Created .
2- Bullish Price Action .
3- Bigger T.F Giving Good Bullish P.A .
4- Clean Breakout .
5- Reversal Pattern .
XAUUSD H1 – Elliott Wave & S/R AnalysisStructure & Current Outlook
Impulsive Wave Up:
-Price is moving in a clear 5-wave structure (i–ii–iii–iv–v), now heading towards completion of wave (v) / ⑤.
Critical Resistance Ahead:
-The main resistance/red supply zone sits around 3,393 – 3,421. This is your likely target for the final push.
After Completion:
Expect a reversal or sharp pullback once the 5-wave impulse completes inside the red zone.
Possible move down to the blue demand zones (starting 3,350–3,325).
Trade Plan Idea
Intraday Long:
Can ride the move up towards 3,393–3,421, but reduce risk and watch for exhaustion.
Watch for Reversal:
Look for bearish setups/confirmation inside the red zone to enter shorts, targeting the next blue demand below.
Confirmation:
Wait for candlestick reversal or momentum divergence before going short.

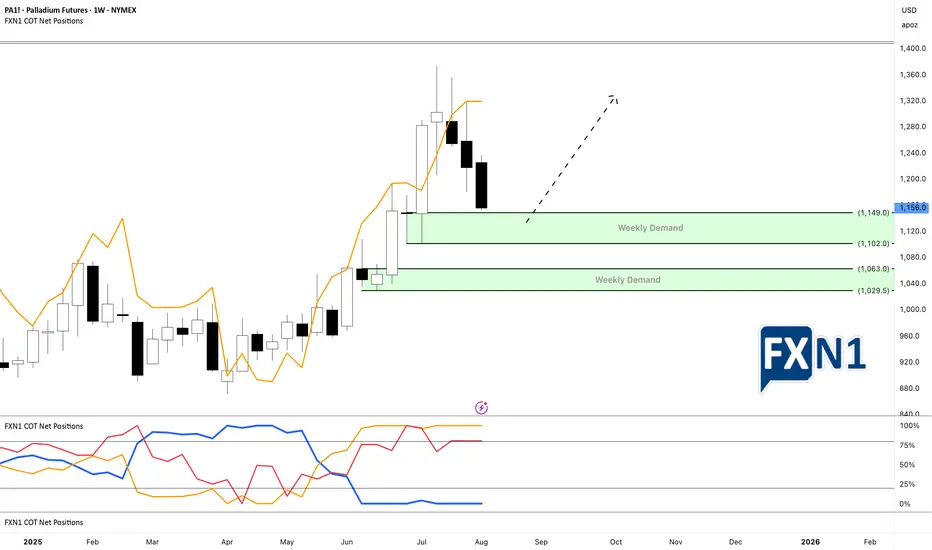
Palladium’s Bullish Outlook Amidst a Market FakeoutPalladium has emerged as the second strongest precious metal this year, demonstrating notable resilience. Over the past three weeks, however, its price has experienced a retracement, revealing two potential weekly demand zones on the chart. An analysis of the Commitment of Traders (COT) report indicates that this pullback is not driven by non-commercial traders, who are actually increasing their positions. This discrepancy suggests that the recent decline may be a false move by the market. Consequently, I am considering placing limit orders within the two identified demand areas to capitalize on a potential rebound.
✅ Please share your thoughts about PA1! in the comments section below and HIT LIKE if you appreciate my analysis. Don't forget to FOLLOW ME; you will help us a lot with this small contribution.
Buy and sell level goldNow already showing upside momentum
3384-3398 level gonna week as it already responded yesterday
Now again reached to this level
We expecting that it will break now this level and straight towards 3430

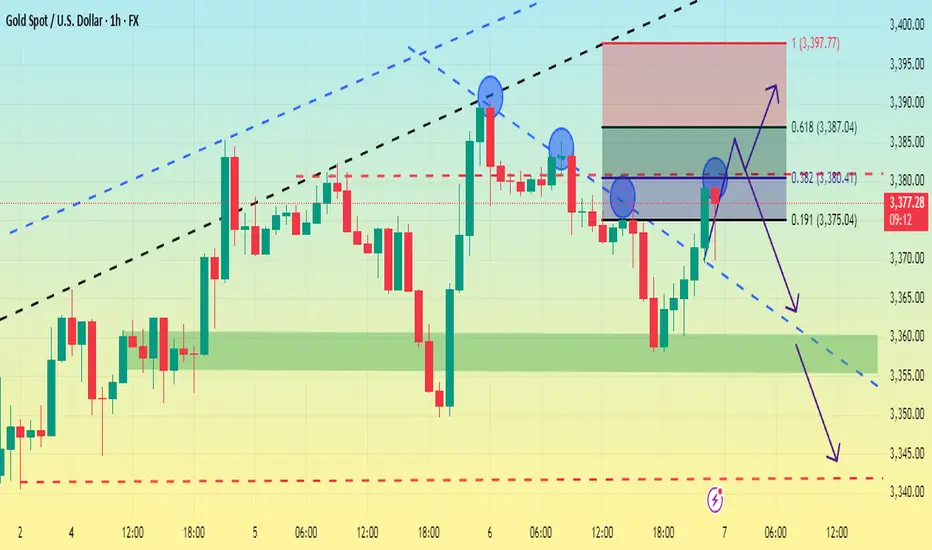
XAU/USD Technical Analysis (1H Chart)Based on the 1-hour chart, XAU/USD is currently at a critical juncture, presenting a potential short-selling opportunity. The analysis is based on a confluence of technical factors.
Key Observations:
Minor Bearish Trend: The price is trading within a well-defined descending channel, indicating a short-term bearish trend. The market has been forming a series of lower highs and lower lows since the peak around the 06:00 mark on August 6th.
Fibonacci and Trendline Confluence: The current price is testing a significant resistance zone. This area is a cluster of multiple technical indicators:
Descending Trendline: The price is directly touching the upper boundary of the bearish channel, which is acting as dynamic resistance.
Fibonacci Retracement: The price has retraced up to the 0.618 Fibonacci level, a key area where sellers often step in to push the price back down.
Moving Averages: The price is trading below the faster-moving averages (red, green, blue lines), which are also beginning to slope downwards, adding to the bearish sentiment.
Trade Scenario:
The chart highlights a potential short (sell) trade setup:
Entry: Around the current price level (~3,372.130), capitalizing on the resistance from the trendline and Fibonacci cluster.
Stop Loss: Placed above the recent swing high and the resistance zone, around 3,378.000. This protects the position against a breakout above the channel.
Take Profit: Targeted at a lower support level, around 3,338.000.
Conclusion:
The outlook for XAU/USD in the short term is bearish. The price is facing strong resistance at the confluence of the descending trendline and the 0.618 Fibonacci level. As long as the price remains below this resistance cluster, a continuation of the downward move towards the target of 3,338.000 is likely. A break and close above the 3,378.000 level would invalidate this bearish scenario.

GOLDEN XAU Setup Activated If you know how to read this chart then nothing needed to be said. If not, you need to learn more about technical analysis and order blocks + several indicators and the correlation with price reaction to news. Nothing hard, just basic stuff.
