The shot at the critical moment is the real trading opportunityGold bottomed out and rebounded yesterday, breaking the high slightly to touch 3390 before falling back. The daily line closed with a small bullish cross overnight, and the upward momentum has slowed down. Today it tends to fluctuate at a high level. In the 4H cycle, the Bollinger band is closing, and the overall bulls continue to run upward. The big positive line directly pulls up, which is relatively strong. The overall market is resistant to declines. Therefore, the big cycle does not expect a big drop for the time being, but the short-term trend fails to continue further. It is safe to maintain a pullback and go long. Pay attention to the support below 3365-3350. Go long after it stabilizes. First look at yesterday's high of 3390. If it breaks, there is a probability of going to 3400 or even around 3415, but be careful of a high rush and fall.
Futures market

Gold: Yesterday’s Surge & Today’s Session StrategyDuring yesterday’s U.S. trading session, gold surged to around 3390 🚀, driven by a series of tariff-related remarks from Trump, Fed personnel changes, and market expectations that the probability of a September rate cut has risen to 91% ⚡️. We successfully took profit near 3355 yesterday, locking in close to maximum gains 💰.
Today’s trading strategy:
Go short at highs during the Asian session 📉
Go long at lows during the European session 📈
Go short at highs again during the U.S. session 📉
⚡️⚡️⚡️ XAUUSD ⚡️⚡️⚡️
🚀 Sell@ 3390 - 3380
🚀 TP 3375 - 3366 - 3356
Daily updates bring you precise trading signals 📊 When you hit a snag in trading, these signals stand as your trustworthy compass 🧭 Don’t hesitate to take a look—sincerely hoping they’ll be a huge help to you 🌟 👇
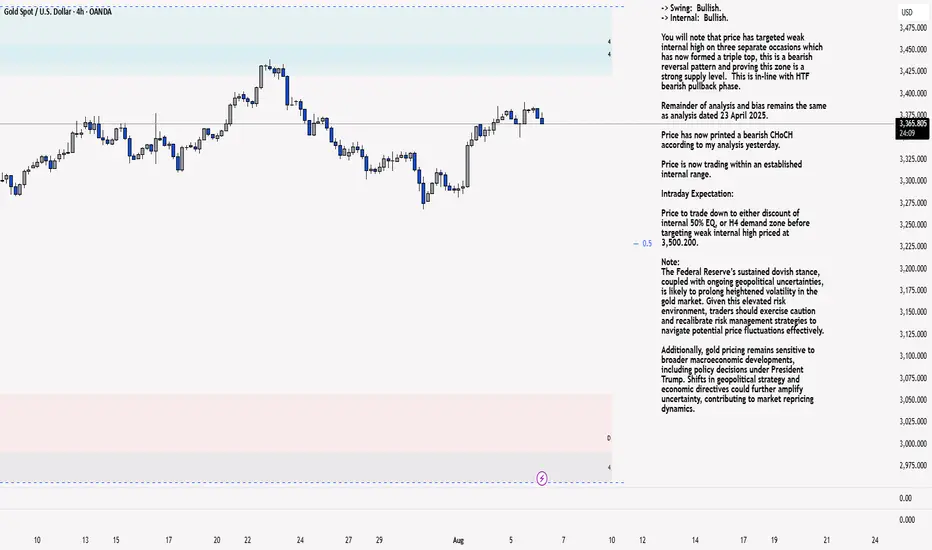
XAU/USD 06 August 2025 Intraday AnalysisH4 Analysis:
-> Swing: Bullish.
-> Internal: Bullish.
You will note that price has targeted weak internal high on three separate occasions which has now formed a triple top, this is a bearish reversal pattern and proving this zone is a strong supply level. This is in-line with HTF bearish pullback phase.
Remainder of analysis and bias remains the same as analysis dated 23 April 2025.
Price has now printed a bearish CHoCH according to my analysis yesterday.
Price is now trading within an established internal range.
Intraday Expectation:
Price to trade down to either discount of internal 50% EQ, or H4 demand zone before targeting weak internal high priced at 3,500.200.
Note:
The Federal Reserve’s sustained dovish stance, coupled with ongoing geopolitical uncertainties, is likely to prolong heightened volatility in the gold market. Given this elevated risk environment, traders should exercise caution and recalibrate risk management strategies to navigate potential price fluctuations effectively.
Additionally, gold pricing remains sensitive to broader macroeconomic developments, including policy decisions under President Trump. Shifts in geopolitical strategy and economic directives could further amplify uncertainty, contributing to market repricing dynamics.
H4 Chart:
M15 Analysis:
-> Swing: Bullish.
-> Internal: Bullish.
H4 Timeframe - Price has failed to target weak internal high, therefore, it would not be unrealistic if price printed a bearish iBOS.
The remainder of my analysis shall remain the same as analysis dated 13 June 2025, apart from target price.
As per my analysis dated 22 May 2025 whereby I mentioned price can be seen to be reacting at discount of 50% EQ on H4 timeframe, therefore, it is a viable alternative that price could potentially print a bullish iBOS on M15 timeframe despite internal structure being bearish.
Price has printed a bullish iBOS followed by a bearish CHoCH, which indicates, but does not confirm, bearish pullback phase initiation. I will however continue to monitor, with respect to depth of pullback.
Intraday Expectation:
Price to continue bearish, react at either M15 supply zone, or discount of 50% internal EQ before targeting weak internal high priced at 3,451.375.
Note:
Gold remains highly volatile amid the Federal Reserve's continued dovish stance, persistent and escalating geopolitical uncertainties. Traders should implement robust risk management strategies and remain vigilant, as price swings may become more pronounced in this elevated volatility environment.
Additionally, President Trump’s recent tariff announcements are expected to further amplify market turbulence, potentially triggering sharp price fluctuations and whipsaws.
M15 Chart:
BUY USOILI'm sharing with you our trade today on OIL.
The reason we're buying is because yesterday the market grabbed the LQ now it is reversing to climb higher to fill all of the FVG we got in the previous movement.
For a safe entry, wait for the price to come back to our entry poin at 65.800 since I myself am waiting for the price to come to our entry point.
Follow for more!

GOLD BUY INTACTFinal bullrun towards 34xx plus is remaining to complete ite wave before goes sideways to decide either going down or ATH

Short-time short on gold, planning to long soon🔍Gold (XAUUSD) Technical Analysis – Dual Bias Strategy
Current Trade: Short-term Sell
Overall Plan: Preparing for a Long (Buy) Entry
Thoughts
I’m currently taking advantage of the short-term bearish pressure on gold but staying prepared for a long re-entry once price hits key demand zones. This dual-bias strategy allows me to trade with the trend while managing risk and maximizing opportunities on both ends.

WTI Crude Oil – Range Support in FocusWe're waiting for price to reach the bottom of the range, and with a solid buy signal, we’ll consider going long.
However, since this level has been tested multiple times, it’s highly vulnerable to stop fishing — so caution is key.
As always, we’re ready for all scenarios:
If price breaks below, we’ll wait for a pullback to enter short.
But right now, we’re watching the range support for potential longs

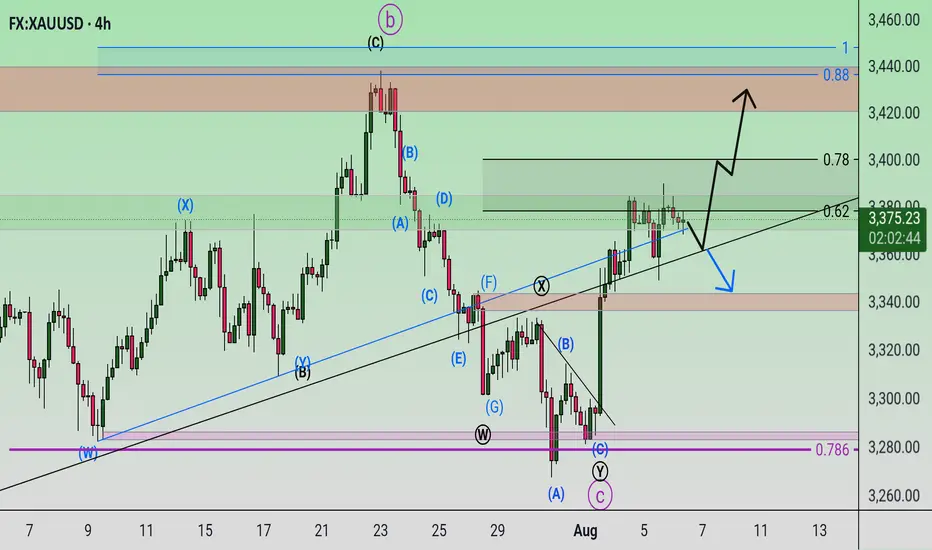
Lingrid | GOLD Potential Bullish Extension Following Pullback OANDA:XAUUSD is rebounding strongly from the support zone after a deep correction from the previous top near 3,437. The price has broken back above the range and formed a new impulse leg, now hovering just above the upward trendline. As long as the structure holds above 3,330, further continuation toward the 3,410–3,437 resistance zone remains likely. The projected wave path shows a bullish scenario targeting a retest of the top trendline.
📉 Key Levels
Buy trigger: Above 3,360
Buy zone: 3,330–3,340
Target: 3,410
Invalidation: Below 3,320
💡 Risks
Rejection from 3,360 trendline may lead to retracement
Failure to hold above 3,330 support could shift bias bearish
Upcoming macroeconomic data might increase volatility
If this idea resonates with you or you have your own opinion, traders, hit the comments. I’m excited to read your thoughts!

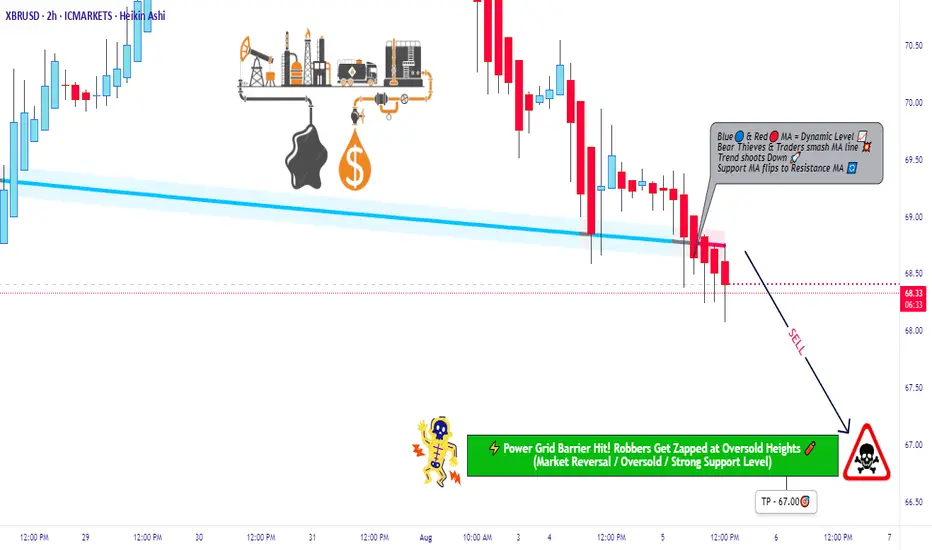
XBRUSD Robbery Setup: Thief's Bear Trap is Active! 🔥💰BRENT BEARISH HEIST PLAN💰🔥
🎯 Asset: XBRUSD / UK Oil Spot / BRENT
🧠 Strategy: Layered Limit Orders | Bearish Robbery in Progress
💼💣💼
Yo Money Movers & Market Jackers!
It’s time to load up the truck and roll out — the BRENT vault is cracked open and dripping with bearish loot! 🐻💵🔓
🎩 This isn’t just trading — this is Thief Trading Style™.
We don’t chase candles. We layer the loot, wait in the shadows, and strike on the pullback. No mercy. Just money. 💸🕶️
🚨 THIEF'S TRADE SETUP 🚨
🕵️ Entry Point:
Any Price Level – we’re everywhere.
Place layered Sell Limits like tripwires on the chart 🎯💣 — 15m or 30m candle nearest swing highs. The trap is set.
🛑 Stop Loss:
🔒 Locked @ 69.50 — right above resistance
This is a tactical retreat, not a failure. Every heist needs an escape route. 📉🔁
🎯 Target Zone:
💥 Aim for 67.00 — smash and grab style.
Get in, take profit, disappear into the shadows.
🧠 WHY THE HEIST?
The BRENT market looks ready for a rug pull —
🧊 Demand slowing
📉 Bearish structure unfolding
🎭 Bull traps getting exposed
🔥 Perfect time for thieves to cash out while the herd dreams green
Before pulling the trigger, check:
📰 Fundamentals 📦 Inventory Data 🧭 Intermarket Analysis 📊 COT Reports
Do your homework — then rob it like a professional. 🧠💼🔎
⚠️ MISSION WARNING ⚠️
Avoid new trades during news drops!
Use trailing SLs to protect loot. This market doesn’t play fair — but we don’t either. 🛑📰📉
💥 Hit BOOST if you're riding with the robbers!
Let’s show this market how Thief Traders steal gains like legends.
Every like = one more gold bar in the van 💰🚚💨
Stay sharp. Stay shadowed.
See you on the next job. 🐱👤💸📉
🔗 #Brent #XBRUSD #UKOil #ThiefTrader #BearishSetup #EnergyMarket #LayeringStrategy #MarketRobbery #SellThePump #RobTheChart
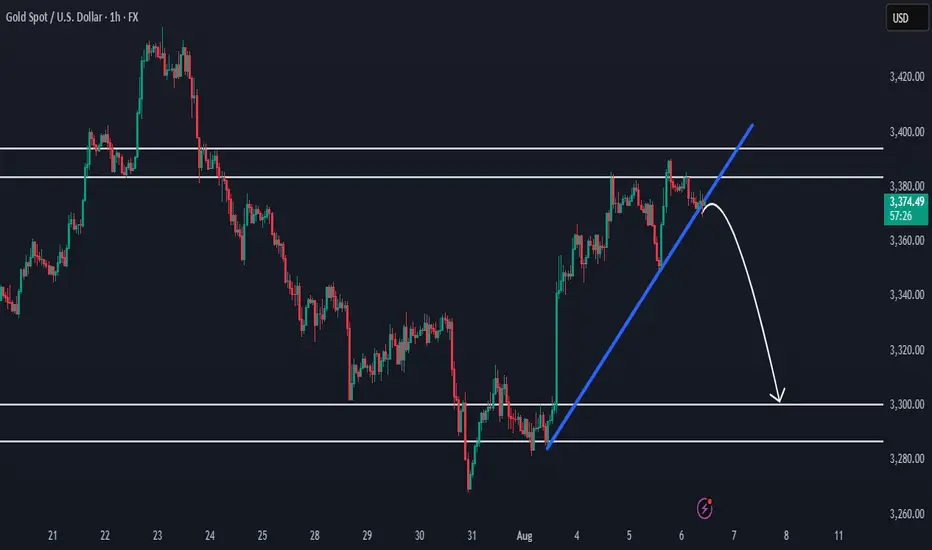
Gold Rejected from Supply - Clean Sell SetupHello traders!
This is a clean, textbook sell setup.
Gold has an overall bearish structure.
It has reached an important supply area and been rejected.
We are aiming for a sell position here upon breaking the upward trendline.
The target is around 3300.
Gold Price Setup – Potential Rejection & Long ScenariosPrice is currently consolidating below the H4 Supply Zone after rejecting the ascending trendline twice.
Two key scenarios are in focus:
✅ Scenario 1 – Deeper Pullback to Demand Zone
A retracement into the 1H + 30M Order Block (OB) and liquidity zone near 3,341–3,355 (marked with $$$) could attract buyers.
If bullish momentum confirms, look for a continuation toward 3,388 and possibly the upper trendline near 3,400+.
✅ Scenario 2 – Immediate Push Higher
If price holds above the moving average and fails to break below 3,355, bulls could step in earlier, driving price back to test the trendline resistance.
Breakout of the trendline could target the higher supply region.
🔍 Key Levels to Watch:
H4 Supply Zone (3,440 area) for potential reversal.
3,341 OB Zone for liquidity sweep and reaction.
Trendline Resistance capping the upside.

Check the trend If the price consolidates above the green resistance zone, the uptrend is likely to continue. Otherwise, a correction to the support zone is possible.
Gold Slightly Pulls Back – Awaiting Fed & Dollar Direction📊 Market Drivers:
Spot gold slipped ~0.1% to $3,376/oz, pressured by a firmer USD and caution ahead of Trump’s Fed chair and governor appointments
📉 Technical Analysis
• Key resistance levels:
o $3,390: previous session high – near-term ceiling
o $3,410: weekly high – stronger upside barrier
o $3,435: medium-term resistance – break above confirms strong bullish continuation
• Nearest support levels:
o $3,365: current Asian session low
o $3,345: strong support zone – EMA50 on H4 chart
o $3,305: last week's low – breakdown here may trigger deeper pullback
• EMA: Price remains above EMA09 and EMA50, suggesting a short-term bullish bias, though momentum is slowing.
• Candlestick / Volume / Momentum: Low volume in Asian session; H1 candles show indecision (doji with long wicks), signaling a tug-of-war between buyers and sellers.
📌 Outlook:
Gold may consolidate or dip slightly short-term unless it decisively breaks above $3,395 to confirm a new bullish leg.
________________________________________
💡 Suggested Trading Strategy:
SELL XAU/USD: ~3,392– 3,395
🎯 TP: 40/80/200 pips
❌ SL: ~3,398
BUY XAU/USD : ~3,366 - 3363
🎯 TP: 40/80/200 pips
❌ SL: ~3,360

GOLD IS OVERALL BULLISHGold is overall a bullish Structure, considering the fact its also a continuation type of zone we will be looking for entries to buy at discounted levels of demand to buy from .
follow me for more
@Codersolltrades IG

GOLD RISING AGAIN1. MA20 on weekly held the price again
2. Gold is making Higher Lows in a row
3. 100 days of sideway movement
Now its time for $4000 in my opinion

XAU/USD Buy Setup 1H Analysis Trendline breakout.Instrument: Gold Spot / USD
Timeframe: 1H (1 Hour)
Chart Tools Used:
Ichimoku Cloud
Trendline breakout
Target projection (highlighted in blue arrow and price levels)
Volume not shown directly but momentum is clear from breakout
---
💹 Buy Setup Analysis
✳ Current Price: $3,362.895
🔼 Entry (Buy): Around $3,363.590 (as marked on the chart)
🎯 Targets:
Target Number Price Level Approx Gain % Move
1st Target $3,393.481 ~$30 ~0.89%
2nd Target $3,433.864 ~$70 ~2.06%
🔻 Stop-Loss (Suggested): Below Ichimoku Cloud, ideally near $3,315.860 or $3,322.672
---
🧠 Strategy Logic
The chart shows a clean bullish breakout of the trendline and Ichimoku cloud.
Strong upward momentum candle confirms the breakout.
Targets are based on measured move and previous resistance zones.
Volume and sentiment look bullish, aligning with the breakout.
A pullback to the breakout zone (~$3,340–$3,350) would be healthy for re-entry.
---
📝 Summary of Buy Setup
Parameter Value
Entry $3,363.590
Target 1 $3,393.481
Target 2 $3,433.864
Stop-Loss $3,322.672–$3,315.860 (zone below cloud)
Risk-Reward ~2:1 to 3:1 based on SL/TP choice

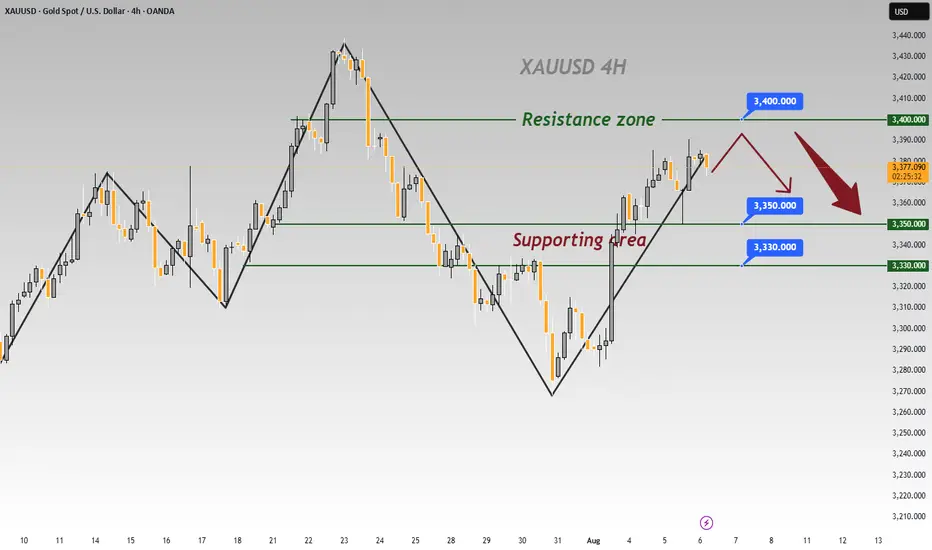
XAU/USD Intraday Plan | Support & Resistance to WatchGold is holding above the $3,369 level after rejecting from the $3,387 resistance zone. Price action remains bullish for now, with structure supported by the rising 50MA, which is acting as dynamic support.
To extend higher, bulls need a clean break and hold above $3,387, which would open the path toward $3,422 next.
If price fails to hold above $3,369, we could see a pullback into the $3,358–$3,344 zone, which remains the first key support. Below that, the next area of interest is the Pullback Zone at $3,329–$3,313 — a former resistance turned support, and a likely area for dip-buying interest.
A break below that would shift focus to the Secondary Support Zone at $3,295–$3,281, where price last launched its breakout.
📌 Key Levels to Watch
Resistance:
‣ $3,387 ‣ $3,422
Support:
‣ $3,369 ‣ $3,358‣ $3,344‣ $3,329–$3,313‣ $3,295–$3,281
🔎Fundamental Focus:
No high-impact data today, but markets may remain reactive.

Gold at major resistance and at fib 0.618 level breakout ? Gold after breaking the support, now again reached the support level which will be its resistance now, will it break it or get rejected form here. Enter the long only on breakout and retest till then its bearish trend.
XAUUSD BUY IDEA • Clear POI Identified:
Price is approaching a well-defined Point of Interest (POI) around 3,347–3,355. This zone aligns with prior demand and a potential entry point for institutions.
• Short-Term Weakness → Potential Reversal:
The market structure shows a retracement phase after a strong bullish impulse. The retrace is likely targeting discount levels within the POI.
• 50 EMA Confluence:
The 50 EMA (gray line) is rising and converging toward the POI, adding confluence for bullish continuation.
• Anticipated Reaction:
Expectation is for price to tap the POI, form an intraday reversal pattern, then continue upward toward higher liquidity zones.
⸻
🧠 Smart Money Perspective:
• Accumulation → Expansion:
Price may currently be accumulating orders before the next expansion leg.
• Low-Risk Entry Zone:
The POI offers a potential low-risk buy zone with stop-loss below the 3,347 region.

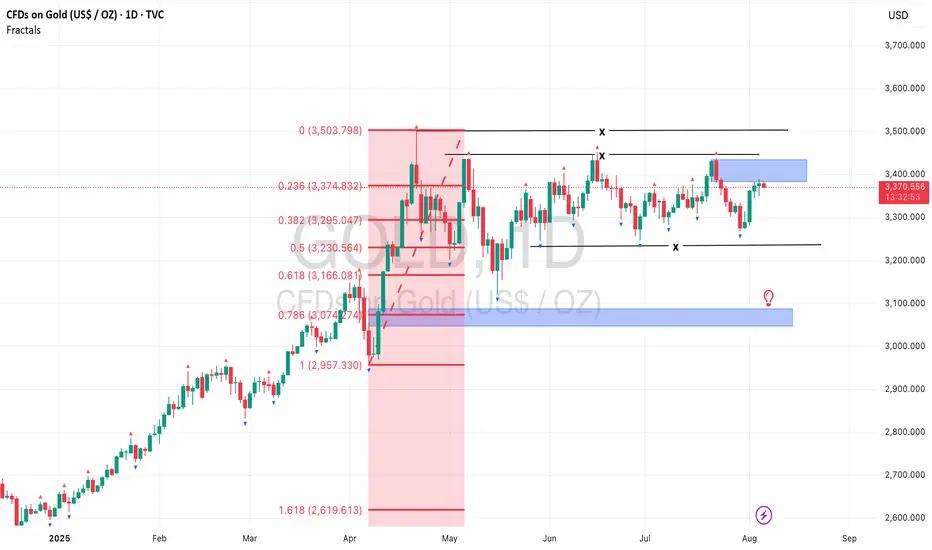
4-dollar sign pattern - Long term gold bull marketUnbeatable 4-dollar sign bull pattern. Gold breaks 50-month moving average. Last time was a 10-year bull market. This time, 10 years more.

XAUUSD 30M – Breakdown or Bounce From Here?Gold remains trapped within a narrow intraday range as price tests key support at $3,370.71. After failed attempts to reclaim the d1 open zone around $3,380, momentum has shifted lower with sellers pressing at support.
The next move remains critical:
→ $3,385.01 remains the key upside trigger; a confirmed 30m close above could attract buyers, targeting $3,389.09
→ A decisive close below $3,370.71 would break short term structure and expose $3,367.16 (first target) and potentially $3,363.88 on continuation
→ The current structure favors range trading but compression near the lows suggests possible downside expansion
Price action remains delicate. Traders should remain patient for a clear breakout or breakdown confirmation before positioning.
#XAUUSD #Gold #TechnicalLevels #PriceAction #BreakoutWatch #SupportResistance #MarketStructure

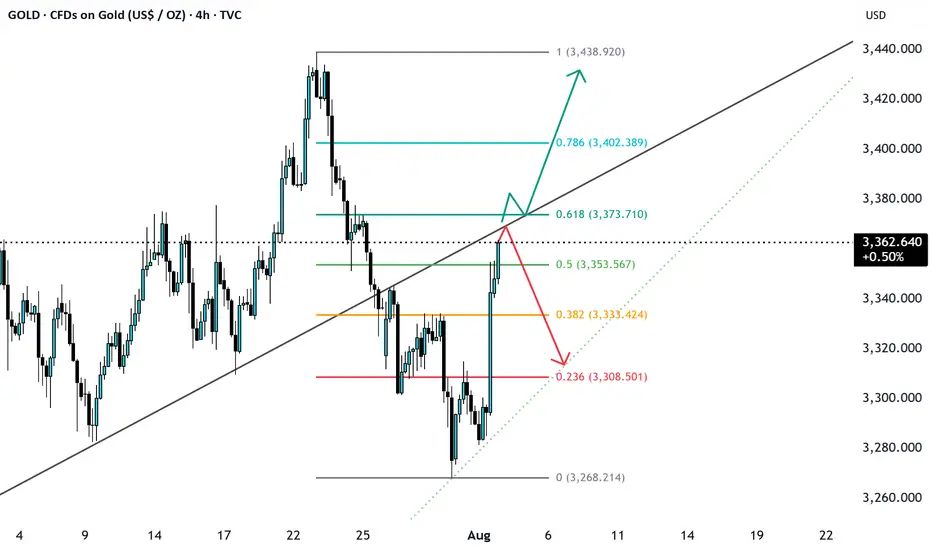
XAUUSD INTRADAY ANALYSIS – AUGUST 6, 2025Gold OANDA:XAUUSD is currently consolidating around the 3,371 zone after breaking above a descending trendline formed from late July highs. A strong bullish impulse on August 2nd with significant volume suggests renewed buying pressure. Price is now retesting the breakout area — a critical moment to determine if the bullish continuation is sustainable.
- Technical Breakdown:
1. Price Structure & Trendline:
The former resistance at Peak 1 (3,376) is now acting as new support.
A new ascending channel has formed following the breakout.
Price structure is showing higher highs and higher lows, indicating short-term bullish momentum.
2. Fibonacci & EMA:
The Fibonacci retracement of the recent bullish wave (Aug 1–5) aligns the 0.382 and 0.5 zones with strong support around 3,365 – 3,352.
Price is hovering near the EMA20, and a close above this level will further confirm upside potential.
3. RSI Indicator:
RSI is stabilizing around 50–55, reflecting neutral momentum with room for bullish continuation.
- Key Price Levels:
3,352 – 3,365: Major Support (Fib + EMA + previous lows)
3,376 – 3,380: Immediate Support (breakout retest area)
3,390: Minor Resistance
3,438: Bullish Target (Peak 2)
- Suggested Trading Strategy:
Primary Bias: BUY if price holds above 3,365
Entry Zone: Around 3,369–3,372 (retest + trendline confluence)
Stop Loss: Below 3,352
Take Profit: 3,438 (previous peak)
Risk/Reward: ~1:9 (very favorable setup)
- Look for bullish confirmation (e.g., bullish engulfing or pin bar around 3,365–3,370) for a high-probability entry.
- Alternate Scenario:
If price breaks below 3,352 with strong volume, the bullish thesis may be invalidated. In that case, consider short-term short positions targeting 3,320 area.
This chart setup presents a promising trend-continuation opportunity, with technical confluences supporting further upside. As always, wait for clear price action signals before entry and manage risk accordingly.
