Futures market

GOLD CONSOLIDATION BEFORE FURTHER GROWTHThe ISM report released last night showed weak data, which further strengthens the bullish outlook for GOLD. The price moved from 3350 to 3390, starting its rise a few hours before the news and peaking shortly after the data was released.
Currently, GOLD is consolidating with 3375 acting as a key support level. As seen on the chart, the price is holding above this zone.
In this kind of market condition, I usually apply a range trading strategy. It helps minimize risk since stop-loss levels are placed close to the entry. However, it's worth noting that this approach is susceptible to fake breakouts.
The current tight range is between 3378 (buy zone) and 3385 (sell zone), with each boundary serving as a potential target. Stops can be placed slightly below support or above resistance levels.
Alternatively, you can set pending STOP orders at both ends of the range to catch any potential breakout or breakdown. Using STOP LIMIT orders is also a viable strategy in this scenario.

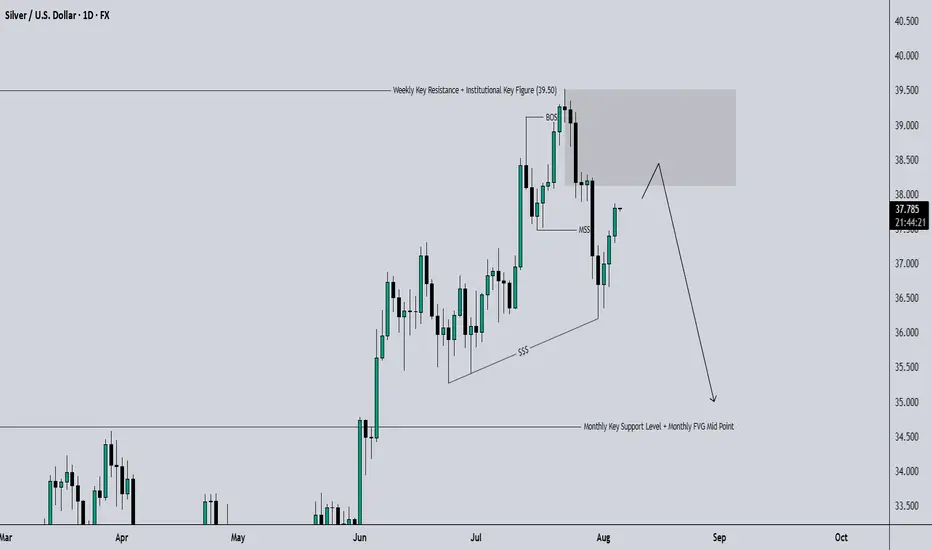
Silver Short IdeaBearish rising wedge breakout with PO of $28. Currently forming a rising wedge for the right shoulder of a head and shoulders top, not yet broken out… but we’re at the 50% retracement from the most recent multi year high.

Daily Analysis- XAUUSD (Wednesday, 6th August 2025)Bias: Bullish
Notes:
- Strong bullish closure on daily
- Conflicts of global politics and potential rate cut incoming
- Potential BUY if there's
confirmation on lower timeframe
- Pivot point: 3350
Disclaimer:
This analysis is from a personal point of view, always conduct on your own research before making any trading decisions as the analysis do not guarantee complete accuracy.

August 6, 2025 - XAUUSD GOLD Analysis and Potential OpportunitySummary:
We’re still in a bullish market, with no signs of a major reversal and last month’s low still holding. The overall strategy remains buying on dips. On the upside, 3390 is the key resistance to watch today — if broken, the next target is the 3400 psychological level. However, if 3400 is rejected again, it may offer a high-risk-reward short setup. On the downside, 3350 remains the most critical support zone for now.
📍 Key Levels to Watch:
• 3434 – Resistance
• 3420 – Resistance
• 3405 – Resistance
• 3400 – Psychological resistance
• 3390 – Intraday key resistance
• 3375 – Support
• 3371 – Support
• 3365 – Support
• 3350 – Psychological support
• 3345 – Support
📈 Intraday Strategy
SELL below 3375, targeting 3371, then 3365, 3358, 3350
BUY above 3385, targeting 3390, then 3394, 3400, 3405
👉 If you find this helpful or traded using this plan, a like would mean a lot and keep me motivated. Thanks for the support!
Disclaimer: This is my personal view, not financial advice. Always use proper risk control.

Gold - M30 Buy SetupOANDA:XAUUSD TVC:GOLD
Timeframe: m30
Risk Level: Low-Medium
🔹 Setup:
Price is testing the boundary of the ascending channel and retesting the support @ 3350
📈 Entry:
Current price zone: 3360-65
🎯 Targets (TP):
TP1: 3375
TP2: 3385
TP4: 3410
TP6: 3430
⛔ Stop Loss (SL):
3349
H4 Overview:
PEPPERSTONE:XAUUSD
#XAUUSD #GOLD #Buy #Signal #MJTrading
Psychology Always Matters:

GOLD LAST LIQUDITY GRAB SELL SELL SELLI have take another SELL (as seen on the chart)
GOLD just came to test SUPPLY/DEMAND AREA which work well as a LIQUIDITY GRAB/SL HUNT before DUMP HEAVILY
Stay alart gold at the moment looks good for sell gives very good risk/reward
Thanks

Gold Setting the Trap: Fake Rally Before the Fall?Gold (GC) Futures are showing signs of a potential reversal after a surprise bullish NY session, likely sparked by headline sentiment (Trump-related news). While the impulse looked strong, we remain below the previous daily high, and structure may still favor a deeper move south.
🔍 Key Notes:
Price is stalling near a high-volume node (~3436–3445).
Possible liquidity sweep above NY highs before reversal.
Watching for confirmation during Asian or London killzone.
Bearish continuation becomes more likely if we break below NY session lows and hold.
Bias: Bearish, targeting rebalancing of the H4 FVG if structure confirms.
Sharing this to track how the algo reacts inside upcoming killzones. Open to thoughts, breakdowns, and alternate reads 👇

Daily Bullish Count on XAUUSDMake sure to monitor the invalidation level; in addition, find my post on the Bearish Count as well for the counter scenario and its invalidation level.

Bearish Daily Count on XAUUSDMake sure to monitor the invalidation level; in addition, find my post on the Bullish Count as well for the counter scenario and its invalidation level.

Wheat ShortZW1! is now net short on the regression break.
The roll on this commodity short is (+3.7%) on the front month.

XAGUSD SWING: SHORT-TERM BEARISH OPPORTUNITY Hi there,
For Silver, I am long term bullish but we have a set up for some short opportunity.
As annotated, we are primed to see lower prices... between 34 - 34.5
If this happens, I'd resume looking for massive long opportunities.
You might want to keep this on your radar.
Cheers,
Jabari
CRUDE OIL Bullish Bias! Buy!
Hello,Traders!
CRUDE OIL keeps falling down
And the price will soon hit
A horizontal support of 64.00$
From where we will be
Expecting a local bullish rebound
Buy!
Comment and subscribe to help us grow!
Check out other forecasts below too!
Disclosure: I am part of Trade Nation's Influencer program and receive a monthly fee for using their TradingView charts in my analysis.

USOIL FREE LONG SIGNAL|
✅CRUDE OIL retested the strong support level of 65.14$
After trading in a local downtrend from some time
Which makes a bullish rebound a likely scenario
With the Take Profit of 65.93 and SL of 64.69$
LONG🚀
✅Like and subscribe to never miss a new idea!✅

August 6 Gold Price Analysis: Target $3,400 Trading RecommendatAugust 6 Gold Price Analysis: Target $3,400
Trading Recommendations:
Short-Term Day Trading:
1: Watch for a breakout above $3,380-3,400. A successful breakout could signal a bullish trend with a target price of $3,420.
2: Continue to monitor the $3,350-3,360 support level. Buy on dips as long as the price remains above $3,350.
3: Exercise caution when shorting. Gold prices may converge within the $3,360-3,380 range before rising again.
Buy: $3,350-3,360
Stop-loss: $3,340
Target price: $3,380-3,400+
4: This week's trading strategy focuses on buying at low prices.
Conclusion: The gold market is currently supported by multiple positive factors, and the technical outlook is bullish, but caution is advised regarding a break above key resistance levels. Investors should closely monitor Federal Reserve policy developments and geopolitical developments.
Latest News, Policy, and Technical Analysis
I. News and Policy
The probability of a September Federal Reserve rate cut has soared to 92%.
Weak employment data has weakened the US dollar, bolstering the appeal of gold as an interest-free asset.
Trump's tariff policy has heightened market uncertainty.
US President Trump announced new tariffs on Canada, Brazil, India, and other countries. Escalating trade frictions have heightened risk aversion, supporting gold's status as a safe-haven asset.
Trump also stated that he would "significantly increase tariffs on Indian goods imported into the United States within the next 24 hours" and planned to impose additional tariffs on semiconductors and pharmaceuticals, further exacerbating market volatility.
Federal Reserve personnel changes have raised concerns about policy credibility.
Federal Reserve Board member Kugler has resigned, and Trump will nominate a new member.
The market is concerned that the Fed's independence may be undermined, exacerbating monetary policy uncertainty.
Trump recently announced that he has narrowed the field of candidates for Federal Reserve Chair to four, with Treasury Secretary Bensonant explicitly declining the position.
Geopolitical risks are supporting gold prices.
The ongoing conflict between Russia and Ukraine, tensions in the Middle East, and Trump's "deadline" rhetoric targeting Russia have all contributed to some inflows into the gold market.
Gold ETF Holdings Rebound
Holdings of the world's largest gold-backed ETF (SPDR Gold Trust) increased by 1.72 tons to 954.80 tons from the previous trading day, indicating increased bullish sentiment among institutional investors towards gold.
II. Technical Analysis
Short-Term Trend (4-Hour Chart)
Gold prices found support near $3,325. After breaking through the key resistance level of $3,350, they have stabilized above the 100- and 200-day moving averages.
Key Resistance: $3,380-3,390; a break above this level could challenge the $3,420-3,440 range.
Key Support: $3,365 (short-term trendline); a break below this level could test the $3,350-3,340 range.
Positive factors: Expectations of a Fed rate cut, geopolitical risks, intensified trade frictions, and increased holdings of gold ETFs.
Potential risks: Gold prices could correct if US economic data is unexpectedly strong or the Fed delays a rate cut.

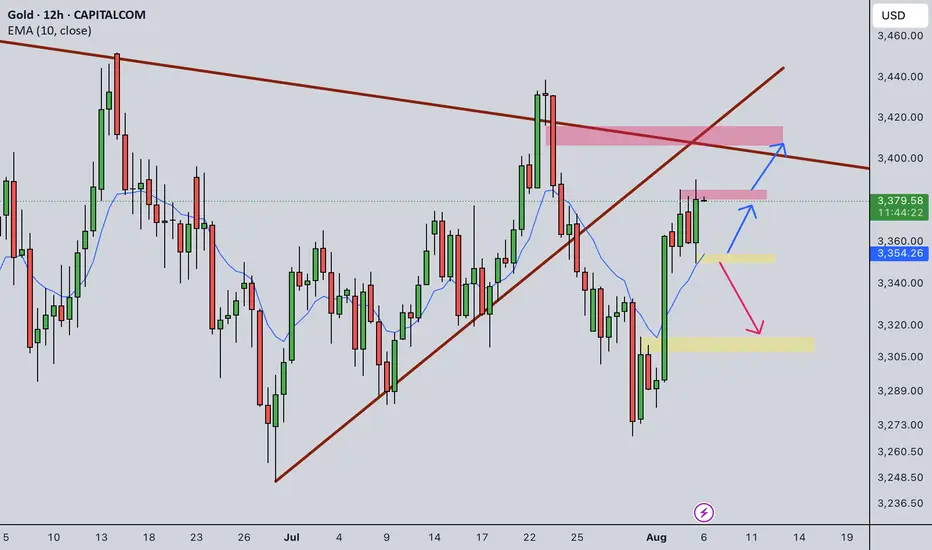
Gold Intraday Trading Plan 8/6/2025In 12hrly TF, gold seems to form bullish continuation pattern. Therefore, I will be cautious in engaging selling orders today.
For today's trading plan, I will only sell if 3350 is broken. I will buy if there is rejection from 3350 or if 3385 resistance is broken.
USOIL Bulls Seize a New OpportunityThe EIA crude oil inventory data is scheduled for release today and is expected to have a significant impact on USOIL prices. Based on the previously released API report, there’s a high probability that the EIA data will also be bullish.
From a technical perspective, USOIL is currently showing signs of a potential rebound. Therefore, for traders participating in USOIL today, it may be more favorable to adopt a bullish bias. If managed well around key support levels and timing, the setup could offer attractive profit opportunities.

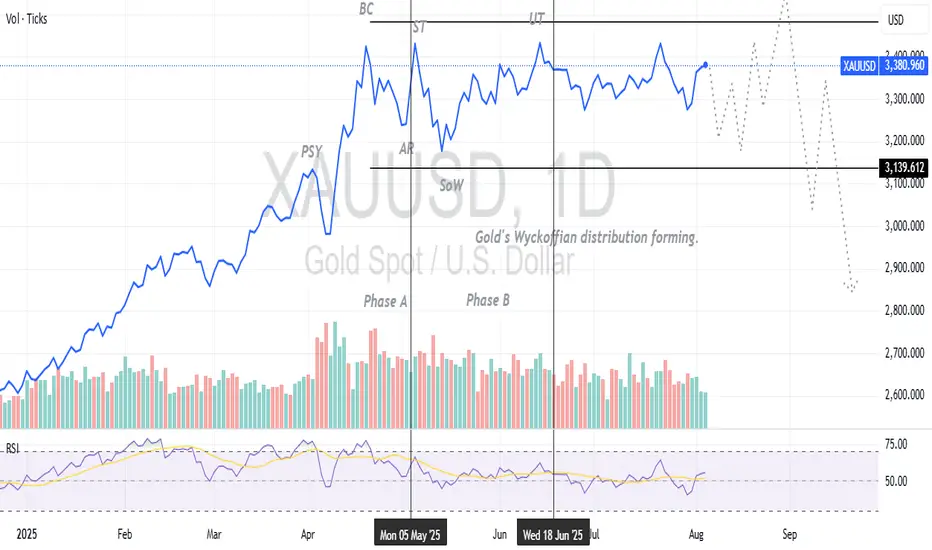
Wyckoff distributes Gold!Typically found in ranging periods as price juggles between a low and a high as marked by the two horizontal lines, this analysis relies on the Richard Wyckoff trading model to explain the ongoing activity in the price of Gold- XAUUSD, suggesting a potential shorting of the precious metal.
The buildup to now shows the market price has registered a chart pattern that typifies the events in a reaccumulation, preparing the price to continue upwards, or a distribution, campaigning for a price cancellation.
Only two more events remain for either pattern to be confirmed. They are a spring and SoS (Sign of Strength) if reaccumulating, or an upthrust and SoW (Sign of Weakness) if distributing To support the distribution idea is the fact that we are seeing Gold at its ATH (All Time High), a sell-off won't be a surprise as this pattern is anticipated for the 'far right' of bearishness rather than of a continuous bullishness.
Lastly, and reiterating that a confirmation of the price formation of the remaining pieces of the events expected to form a complete pattern will crown the effort.
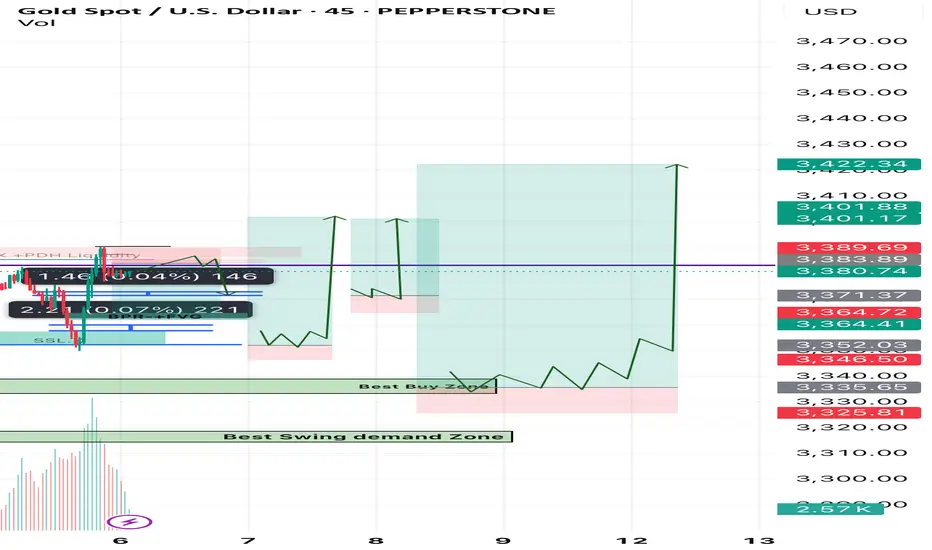
Gold h4 Based Setups Short Gold and Long analysis Market tapped above previous high (BSL + PDH Liquidity), then rejected → classic liquidity sweep
• Formed FVG + BPR zone (red box) and price consolidated below it
• You’re in a short trade targeting ~3365 (blue/green zone) where a new BPR + FVG block is formed (possible demand zone)
If price holds below 3383–3387 zone (FVG + BPR) and breaks 3375 support zone clearly
• We might see a drop toward:
• 3365 (1st TP – already marked)
• 3356–3352 (next demand & SSL area)
🟡 Bullish Rejection Possibility:
• If price reclaims 3387 with a strong candle close
• Then:
• Stops above 3388–3390 may get swept
• Upside potential = 3396–3402 (but less likely unless fundamentals support)
Golden Buying zone for Swing trade 3335-3330 zone
Second buy Golden Zone 3315-3318
Sl Below 3295 For Swing trader
Mange your Risk Alwayse use strick Stoploss
Happy Trading Best Of Luck
8/6: Watch for a Potential Double Top FormationGood morning, everyone!
Yesterday, gold experienced its first significant supply pressure around the 3386 level, but with support near 3350—helped by positive data—prices rebounded and climbed back toward 3390, resulting in solid overall gains.
From the 1-day chart (1D) perspective, the technical structure remains bullish, with MA20 providing firm support. Although short-term moving averages are currently converging, the overall bias remains towards a bullish divergence, suggesting further upside potential. There's a possibility for price to test the 3400–3420 zone in today’s session.
That said, the 3386–3398 region may still pose minor selling pressure, although it is not expected to be particularly strong. Key intraday support is seen in the 3378/3372–3362 range. If the market encounters another wave of heavy selling that damages the daily bullish setup, then the 3343–3348 area will become a critical battleground between bulls and bears.
📌 Trading Strategy for Today:
Maintain a sell-on-strength approach, especially if prices approach the 3418–3438 resistance area, where short opportunities become more attractive;
If a pullback occurs, monitor the aforementioned support zones for potential buy-on-dip opportunities, contingent on stability.
⚠️ Market Risk Reminder:
There will be key economic speeches during the US session, which could trigger heightened volatility. Ensure proper risk management and stop-loss settings are in place.

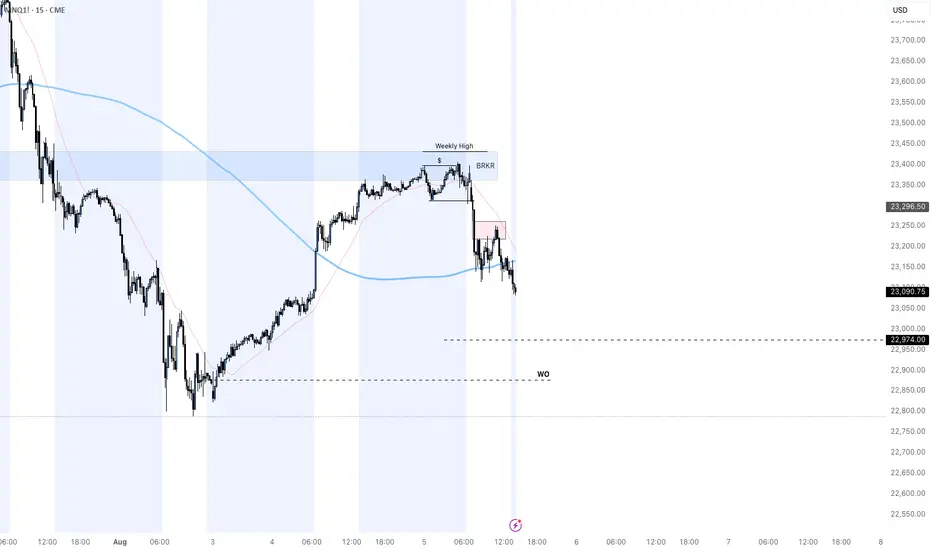
Day 2 — Trading Only S&P Futures — -$100, Grinding Back from Los Day 2 — Trading Only S&P Futures
Daily P/L: -100
Sleep: 8 hours
Emotions: Good
:thought_balloon: Today’s Trade thoughts:
I rushed into a trade thinking 6330 was going to be a good area of support to buy and oversized my position going 5 mes deep in my first trade and adding 5 more at the 48 min MOB at 6325 and got stopped out at the bottom down -400 and pretty much spent the rest of the day grinding back up.
Overall market seem to have rejected the higher timeframe resistance and deciding which direction to go.
:bell:News Highlights:
U.S. STOCKS END LOWER, VIX JUMPS AFTER WEAK ISM SERVICES DATA
:bar_chart: VX Algo Signals (9:30am – 2pm EST):
— 9:30 AM VXAlgo ES X1 Buy signal
— 9:40 AM VXAlgo NQ X1 Buy Signal
— 9:48 AM Market Structure flipped bullish on VX Algo X3!
— 11:00 AM VXAlgo ES X1 Buy signal (triple buy signal)
— 12:50 PM VXAlgo NQ X1DD Sell Signal
— 1:00 PM Market Structure flipped bullish on VX Algo X3!
— 1:30 PM VXAlgo NQ X1DD Buy Signal**
:chart_with_upwards_trend: Key Levels for Tomorrow:
Above 6332 = Bullish
Below 6310 = Bearish

XAU/USD | Bounce in Play – Watching $3350 Support for Next Move!By analyzing the gold chart on the 4-hour timeframe, we can see that after hitting the first target at $3361, gold continued its rally and reached our second supply level at $3385. Upon reaching this key level, the price faced strong selling pressure, dropping over 350 pips down to $3349. Gold is now trading around $3363, and if it can hold above the $3350 support level, we could expect another bullish push. The next upside targets are $3367, $3375, and $3385. This analysis will be updated in the coming hours with your continued support!
Please support me with your likes and comments to motivate me to share more analysis with you and share your opinion about the possible trend of this chart with me !
Best Regards , Arman Shaban

MNQ SHORT POSITION both setups played out **7:15 AM**
CME_MINI:MNQ1!
one thing to note is I have to be in control with my trigger finger I entered a 2nd position for mnq at the end of the moving into the consolidation lost about 40% of my move ending the day at 300$ after being up 437$